蒲强 , 邹滨, 郭宇
PU Qiang, GUO Yu
通讯作者:
收稿日期: 2015-12-14
修回日期: 2016-01-25
网络出版日期: 2016-12-20
版权声明: 2016 《地球信息科学学报》编辑部 《地球信息科学学报》编辑部 所有
基金资助:
作者简介:
作者简介:蒲 强(1990-),男,硕士生,主要从事遥感气溶胶反演与空气污染时空分布模拟研究。E-mail:145011073@.csu.edu.cn
展开
摘要
针对传统地面稀疏站点监测PM2.5浓度以点带面的缺陷,本研究拟借助多源遥感数据开展了地面大气细颗粒物PM2.5浓度空间分布模拟研究。以京津冀地区2013年的年均、季均PM2.5浓度模拟图为例,用简化的气溶胶反演算法(SARA)反演了 1 km高分辨率AOD,并结合高分辨率遥感提取污染相关地理要素,对研究区PM2.5浓度空间分布进行地理统计模拟及优选。结果表明:① SARA算法反演的AOD与地基AERONET相关性达0.99,能准确地反映研究区AOD的时空分布特征;② 集成多源遥感数据的地理加权回归模型拟合度高(平均R2-0.66),其空间模拟显示研究区平均PM2.5污染南部城镇最重,中东部城区次之,西北山区较轻;③ 研究区PM2.5污染程度高,全年平均模拟浓度高达75 μg/m3,在气候环境及主要污染源季节性差异驱动下,浓度分布季节性特征显著,冬季污染最严重,而夏、秋季相对较轻。该成果对于精细把握PM2.5污染特征,指导污染防控具有重要意义。
关键词:
Abstract
Chronic exposure to fine particulate matter with the aerodynamic diameter less than 2.5 μm (PM2.5) is a major risk factor for cardiovascular and respiratory morbidity. Environmental problems of PM2.5 in China have aroused great concerns within both the government and the public. However, studies of this subject have been limited due to the spare distribution of national PM2.5 monitoring network. Satellite-derived aerosol optical depth (AOD) measurements can provide the spatiotemporally resolved monitoring and have been widely applied to estimate the ground level PM2.5 concentration. So far, the AOD measurements only have moderate spatial resolutions (3 to 17.6 km) which are insufficient for resolving the city level aerosol features. In order to address this issue, a 1 km resolution AOD retrieval algorithm-SARA (for MODIS instruments) was applied. Additionally, based on the high-spatial resolution fusion images, the PM2.5 related factors (such as the land use data, dusty area and major roads information) had been extracted. This study then proposed a novel geostatistical modeling method that integrates the fine resolution retrieved AOD and the high resolution area-source emission data to investigate the spatial variability of PM2.5 levels. Results show that the SARA retrieved AOD can obtain an average correlation coefficient R of 0.99 and an RMSE of 0.08, when comparing with AERONET measurements, which indicates that SARA has good accuracy and reliability in representing the aerosol conditions over the study area. Results show that, the annual average value of PM2.5 even exceeded 75μg/m3 and a discrepant spatial heterogeneity occurred between seasons. The worst conditions occurred in the winter, and then in the autumn. The GWR-predicted PM2.5 concentrations (with an average R2 of 0.66) are strongly correlated with the in situ observations. The spatial patterns revealed in the mapping results show that the high-level PM2.5 pollution clustered in southern parts of the study domain, while the low-level mainly appears in the rural or mountain land within the northern areas. Furthermore, these findings recommend the combination superiority of GWR model and multi-source remote sensing data, as well as introduced the great potential of fine-scale PM2.5 simulation in distinguishing the spatial patterns of PM2.5 and guiding the air pollution control strategies.
Keywords:
大气细小颗粒物PM2.5(直径≤2.5 μm)滞留时间久、传输距离远且含有大量的有毒、有害物质,能通过人体呼吸道系统渗透进毛细血管,对呼吸和心血管系统造成损害,严重影响人体健康[1]。此外,PM2.5污染可直接降低能见度并引发城市灰霾事件,严重影响城市大气环境质量[2]。近年来,大气颗粒物PM2.5导致的极端大气污染事件频发,尤其在中国中东部地区,公众更多地暴露于重污染空气中,PM2.5污染已成为中国公众及政府环保部门重点关注的问题[3-5]。中国已在2012年底在全国大中城市陆续开展地面站点PM2.5浓度的连续采样监测,然而受仪器设备昂贵、设站要求高、人力资源限制,我国短期无法实现高密度的空气质量监测网络,仅依靠稀疏监测手段无法满足获取大区范围的PM2.5浓度时空分布信息的实际需求。
遥感技术能提供大范围区域的连续观测,其反演的大气气溶胶光学厚度(Aerosol Optical Depth,AOD)与大气颗粒浓度具有明显相关性[6-7]。但由于遥感AOD本身物理属性与近地PM2.5存在差异,且易受云雾干扰而缺失,因此仅用AOD单一指标估算地表PM2.5浓度的可靠性不足[8]。此外,已发布的遥感AOD产品空间分辨率从3~17.6 km不等[9],无法满足城区尺度研究需求。而PM2.5成因机制复杂,且与污染源、气象条件、地形及土地覆盖等空间地理要素显著相关[10-11],故引入高分辨率遥感影像数据,从空间视角辅助识别下垫面PM2.5污染相关空间地理要素,为研究PM2.5污染空间分布提供一种静态污染信息支持。
国内外研究表明,综合遥感AOD与多源地理要素集的地理统计模型(如土地利用回归模型[12-13]、地理加权回归模型[14-15])理论上可显著提高PM2.5浓度空间分布模拟的稳健性,且更具普适性,能有效地弥补城区稀疏站点监测在区域空间尺度上的空缺[16],但现有研究缺乏对各类模型的精度及稳健性的系统性比较分析。因此,本研究拟在遥感反演大气AOD和高分辨率遥感影像支持下,结合地理空间污染要素知识,提出一种集成多源遥感数据集和地理要素集的大气污染空间优选建模方法,以期准确地捕获PM2.5浓度时空分布特征,为区域污染减排及防控策略的制定提供科学依据。
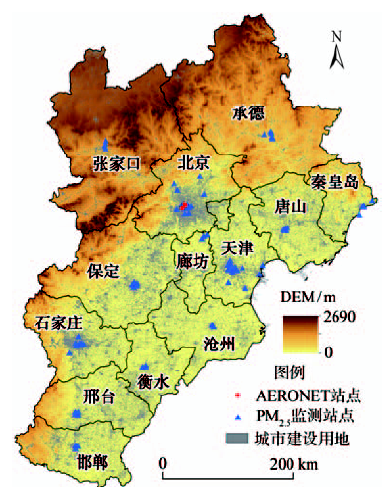
京津冀地区位于中国华北环渤海心脏地带(东经113°04′~119°53′,北纬36°01′~42°37′),西倚太行山脉,北靠燕山山脉,东临渤海,区域面积约为 21.6万km2,是中国北方经济总量及规模最大、最具活力的地区(图1)。其主要城市包括北京、天津、石家庄、保定、唐山、承德、张家口、秦皇岛、廊坊、邢台、衡水、沧州及邯郸。受暖温带季风气候影响,春夏秋三季盛行西南风和南风,而冬季盛行西北风且寒冷干燥、逆温频发,加之区域三面环山的地形极易导致气体滞留。内源排放与外源(尤其北方地区)污染物输入导致区域空气质量(主要为PM2.5)状况日益恶化,大气环境压力严峻。京津冀地区78个大气污染监测站数据显示:2013年各站点年均PM2.5浓度为97 μg/m3,远超国家环境空气污染物PM2.5二级标准年均浓度限值35 μg/m3。
图1 研究区及PM2.5监测站点分布示意图
Fig. 1 The study area and locations of PM2.5related monitoring sites
2.2.1 数据收集
本研究开展区域PM2.5浓度模拟及空间分布制图使用的数据包括:AOD反演数据集、PM2.5浓度与气象因子监测数据集以及其它地理要素数据集。
遥感AOD反演选用Terra和Aqua卫星搭载的MODIS传感器MYD02HKM、MYD03、MYD09GA产品(时间范围:2013年1月1日至12月31日),数据来源于美国航空航天宇航局(NASA)数据中心网站(http://ladsweb.nascom.nasa.gov);此外,反演AOD还用到全球气溶胶自动观测网AERONET地面站中Beijing站的L2.0级AOD数据(已通过云剔除和可靠性的人工检验),考虑到城区气溶胶粒子具有大气细颗粒物PM2.5的代表特性,最后对反演的AOD进行地面验证时采用研究区内AERONET Beijing_RADI与Beijing_CAMS地面站的L1.5级AOD数据(经过云剔除)。
PM2.5浓度监测数据来自中国环境监测总站城市空气质量实时发布平台(CNEMC,http://cnemc.cn)中京津冀地区78个站点的小时监测数据。气象因子监测数据集包括温度、相对湿度、气压、降水、风速,其来源于2013年中国地面气候资料日值数据集(http://cdc.nmic.cn)中京津冀地区13个气象站点数据。
其它地理要素数据集则基于2013年资源三号2.1 m全色与5.8 m多光谱融合影像(北京、天津2期均采用优于1 m航片)提取。影像识别结果主要包括土地利用覆盖、扬尘地表、工业企业排放点分布、城区主要道路网,其中土地利用覆盖包括水体、建筑、林地、草地、农用地5类;扬尘地表为总自然裸露与工地裸露地表总和;依据已采集地面兴趣点知识将影像识别的工业企业排放点分为石油化工企业及钢铁冶炼2类。
2.2.2 数据预处理
空间数据(如土地利用覆盖等)均采用对应2013年静态数据源,时序数据(如PM2.5监测浓度、气溶胶光学厚度、气象要素等)则分别计算为2013年全年及各季度的均值。借鉴已有研究结果[17-18],对于遥感气溶胶光学厚度要素,先选取PM2.5监测站点对应2013年的年均季均AOD栅格值作为特征变量,其均值AOD影像来自各AOD反演天数(Terra-171天,Aqua-151天)计算AOD影像对应平均值所得;再以各PM2.5监测站点为中心建立多种半径缓冲区范围,将地面空间污染要素综合为各监测站点缓冲区内各类污染相关地表所占面积百分比(500 m、1 km、2 km、3 km)。统计污染工业企业排放点要素在监测站点缓冲区内的企业排放点个数和各站点到其排放点最近距离2组信息(400 m、600 m、800 m、1 km、2 km、3 km);交通道路要素包括各站点缓冲区内道路总长度及站点距离道路的最近距离2个属性(100 m、200 m、300 m、400 m、500 m、600 m、800 m、1 km、2 km、3 km);气象要素使用距离各PM2.5监测站最邻近气象站的温度、相对湿度、气压、降水、风速5类气象信息作为属性值。最终完成以研究区PM2.5监测站为建模样本的地理特征变量匹配工作。
高分辨率气溶胶支持下的PM2.5浓度空间分布模拟制图主要包括2个部分:① 高分辨率AOD反演;② 地理统计回归建模及模型检验。
一种简化的气溶胶遥感反演算法(Simplified Aerosol Retrieval Algorithm,SARA)基于真实几何观测,适用于多种气溶胶类型与大气环境,并且反演过程中无需建立传统的反演查找表。SARA算法实现的3个理论假设为:① 地表为朗伯体表面; ② 单次散射率近似;③ 区域气溶胶逐日反演过程中单次散射反照率和非对称因子不存在空间分布异质性。即在单次散射近似中,路径辐射与气溶胶光学厚度、气溶胶散射相函数和单次散射率相关,此时假设地表为朗伯体表面,以及在区域气溶胶逐日反演过程中单次散射反照率和非对称因子不存在空间变化,各参数代入辐射传输模型后整理直接得到气溶胶光学厚度值,算法详细的推导过程参照 Bilal等[19-20]。
SARA AOD反演中利用MOD02HKM数据计算大气上界的表观反射率,MOD03数据提供天顶角、方位角和高度参数,MOD09GA反演所需的地表反射率数据,AERONET L2数据获取单次散射反照率、非对称因子。
地理加权回归(Geographic Weighted Regression,GWR)是一种常规空间线性回归模型的扩展模型。其通过对不同区域的影响进行估计,考虑局部特征作为权重,用空间权重矩阵来表征不同区域的空间非平稳特性,增强变量间空间位置关系的自适应性,使得其进行空间拟合的结果更符合客观情况[21]。本研究中模型结构如式(1)所示。
式中:s为各PM2.5站点的ID编号;PM2.5,s为在s站的浓度模型模拟值;AODs为s站对应AOD值;xk,s是对应s站上各相关地理要素的数值;β0,s是局部线性模型的截距;βk,s(k=1,2,3)为各建模要素与应变量PM2.5浓度的斜率关系值;εs 为模型随机误差。
相对于GWR模型考虑各站点空间距离的不同作为空间地理权重非平稳因子[22],OLS模型则定义自变量建模系数βk,s在空间范围内稳定不变,回归模型系数空间权重一致其模型结构如式(2)所示。
式中:β0是线性模型的截距;βk (k=1,2,3)是基于最小二乘原则的模型建模因子回归系数。本研究中,通过分别利用GWR及OLS模型进行建模,对比2个模型稳健性,从而确立最佳PM2.5浓度空间分布模拟路线。
鉴于样本数据有限,本研究采用交叉验证方法Cross-validation(CV)[14]验证GWR和OLS模型可靠性,具体使用留一检验方法基于相对误差(MRT)、均方根误差(RMSE)2个指标评价OLS和GWR模型在PM2.5浓度空间估算中的精度差异与稳定性。
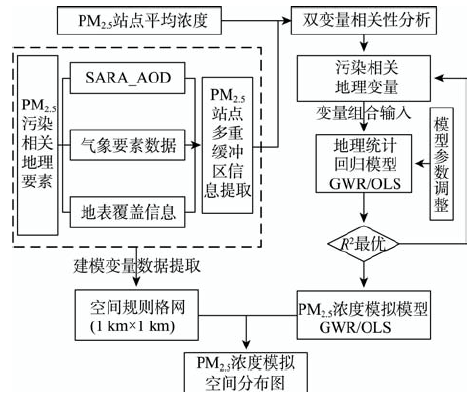
如图2所示,在进行地理统计回归建模前,先利用SPSS软件对PM2.5站点浓度与AOD及其它污染相关地理要素进行相关性分析,筛选出与PM2.5浓度显著相关的污染相关地理变量(如AOD、土地覆盖类型占比、风速等),再于ArcGIS 10.1环境下将其组合输入地统计回归模型基于拟合度最优法确定最优的GWR/OLS建模因子和模型结构。在整个研究区建立1 km分辨率格网,在各个格网点提取对应模型建模因子的数据集(方法及数据属性同2.1.2节),并运用式(1)、(2)中的GWR及OLS模型结构生成1 km分辨率下各个格网点的PM2.5浓度模拟值并可视化出图。
图2 研究区PM2.5浓度地理统计回归建模与制图流程
Fig. 2 Geostatistical modeling and PM2.5 mappingprocesses in the study area
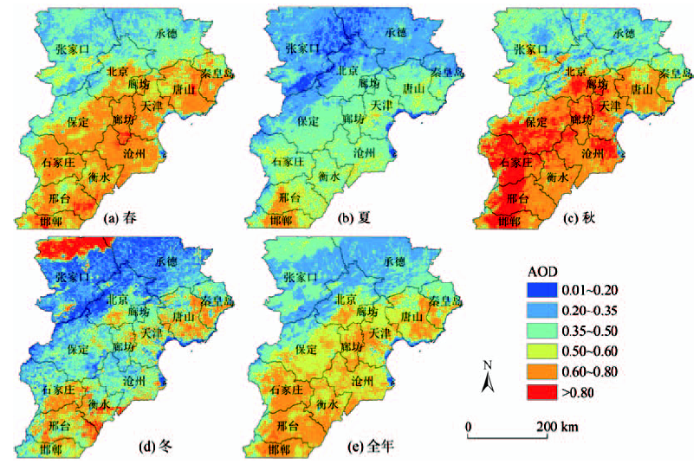
图3是2013年研究区1 km空间分辨率的年均和季均AOD空间分布图。总体而言,京津冀地区气溶胶分布存在明显空间差异。AOD相对高值区主要位于研究区东部、南部大片区域包括:北京、天津主城区和河北省东南部各城市,而北部张家口和承德地区AOD值则相对偏低。研究区AOD高值区往往出现并集聚在人口密集及工业相对集中的大型城镇地区,低值区则分布在太行、燕山山脉外围的城市及远郊地区,说明人类活动及城镇工业生产排放的颗粒物是导致AOD偏高的主要原因之一。同时,受季节性气候特征影响,研究区夏季因天气形势有利于气溶胶粒子扩散AOD值最低,而春季、秋季和冬季气溶胶光学厚度值则明显偏高,其原因可能是春季受北方沙尘天气粒子输送,而秋季和冬季则在雾和采暖燃煤及工业排放影响下导致气溶胶粒子数量骤升[23]。但需要指出的是,冬季张家口北部郊县地区的高AOD值却是因冰雪覆盖和强云反射干扰造成的区域内冬季AOD反演结果异常所致。
图3 京津冀2013年季均和年均SARA气溶胶光学厚度时空分布图
Fig. 3 Spatial distribution of 1 km annual and seasonal average SARAAOD over the study area
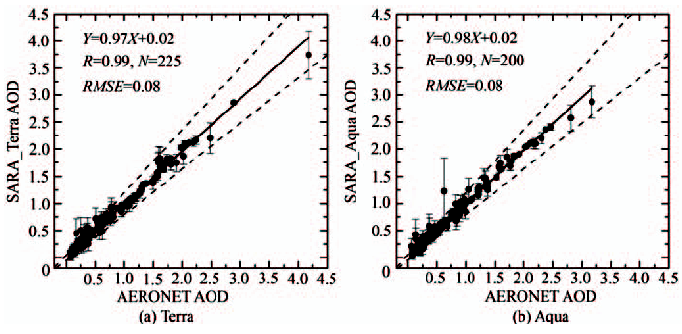
AERONET地基观测AOD对SARAAOD检验的散点分布如图4所示。基于Terra(图4(a))和Aqua(图4(b))卫星反演的SARAAOD与AERONET地基观测值相关性非常高(约0.99),且均方根误差(RMSE)仅为0.08,该结果验证了SARAAOD在城市区域具有较高的精度,能够为研究区PM2.5浓度空间分布模拟提供较可靠的关联数据支撑。
图4 检验样本点AERONET AOD与SARA AOD对比散点图
Fig. 4 Scatter plot comparison of SARA AOD retrievals and in situ AOD measurements at the AERONET sites
4.2.1 模型变量结果
研究区2013年的年均、季均PM2.5浓度回归最佳模型的模型参数如表1所示。OLS年均模型拟合度为0.70,季均模型拟合度在0.42-0.64之间;GWR年均模型拟合度为0.74,季均模型拟合度在 0.62-0.67之间;该结果表明遥感数据支持下的地理统计回归模型尤其是GWR模型较直接基于AOD数据估算近地表PM2.5浓度[8](平均R2:0.30-0.60)具有明显拟合度的改进;而GWR模型整体拟合度优于OLS模型,但2个模型都表现为夏季模型拟合度最差,秋季模型拟合度相对最高,春、秋季拟合度稍优于夏、冬两季。
表1 基于GWR和OLS的PM2.5浓度模拟最佳回归模型
Tab. 1 Parameterization and model fitting ofGWR and OLS models
| 时间 | PM2.5模型预测变量 | 调整后R2 | |
|---|---|---|---|
| OLS | GWR | ||
| 全年 | SARA_年,YCB2K_103,年_FS | 0.70 | 0.74 |
| 春 | SARA_春,春_FS,YCB2K_103,QYGS2K_208 | 0.64 | 0.64 |
| 夏 | SARA_夏,TDB600_2,QYGS3K_205 | 0.42 | 0.62 |
| 秋 | SARA_秋,YCB2K_103,秋_FS | 0.57 | 0.67 |
| 冬 | SARA_冬,YCB2K_103,冬_FS | 0.46 | 0.63 |
各模型的预测变量因时间尺度的不同而发生改变,如年均最佳模型中的预测变量为SARAAOD、建筑用地面积占比和风速;而春季则为SARA AOD、建筑用地面积占比、风速和造纸及纸制品企业个数,但各模型中主要污染响应地理要素为AOD及建筑扬尘地表面积比。此外,受不同地理要素对区域PM2.5浓度影响范围及污染贡献的差异影响,不同时间粒度的模型变量的空间尺度也不一致,如裸地面积占比的最佳尺度为600 m或1 km,石油化工企业个数的最佳尺度为2 km或3 km。
4.2.2 模型精度评价
表2为各OLS和GWR模型交叉验证结果。由表2可知:留一检验中,年均季均GWR模型的均相对偏差MRT都小于OLS模型(GWR模型: 8.34%~17.53%,OLS模型:13.77%~27.43%);而在标准偏差RMSE水平上,GWR模型(7.38~19.20 μg/m3)同样小于OLS模型(12.38~49.67 μg/m3)的检验结果,表明研究区各GWR模型的拟合误差均在合理范围内,拟合精度相对较高。
表2 GWR/OLS模型留一交叉验证结果
Tab. 2 Leave one out cross validation ofGWR and OLS models
| 时间 | MRT/(%) | RMSE/(μg/m3) | ||
|---|---|---|---|---|
| OLS | GWR | OLS | GWR | |
| 全年 | 16.70 | 10.31 | 16.93 | 15.57 |
| 春 | 13.77 | 6.07 | 12.38 | 7.38 |
| 夏 | 19.22 | 12.02 | 15.51 | 10.92 |
| 秋 | 24.25 | 8.34 | 23.21 | 9.88 |
| 冬 | 27.43 | 17.53 | 49.67 | 19.20 |
结合表1中的结果可知:对于PM2.5污染内部差异显著的京津冀地区,顾及污染物空间分布异质性的GWR模型,虽然需要对建模参数(如空间步长等)进行优化校正,计算复杂度较OLS模型有所增加,但其整体模拟效率与模拟精度都有显著的提高,能够支持进一步得到更可靠的PM2.5浓度模拟空间分布图。
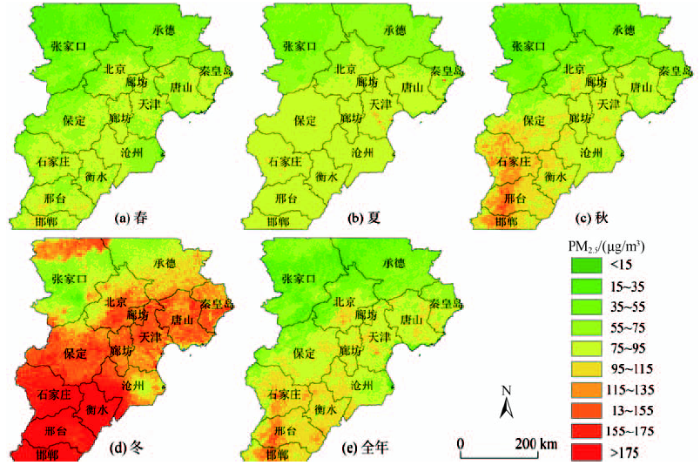
图5为基于GWR的京津冀2013年的年均、季均PM2.5浓度模拟空间分布图。图5(e)表明,全年PM2.5浓度低值区位于京津冀北部张家口和承德地区,而高值浓度位于北京、天津市主城区及河北省南部区域,尤其石家庄-邢台-邯郸一带污染浓度最为严重。从浓度统计特征发现,京津冀2013年均PM2.5浓度在11~167 μg/m3范围内变化,均值为75 μg/m3,大部分区域年均值超过国家规定的环境空气污染物二级标准浓度限值(35 μg/m3)的2倍,表明京津冀2013年平均PM2.5污染较为严重。
图5 基于GWR模型的京津冀2013年PM2.5浓度模拟季均和年均时空分布图
Fig. 5 Spatial distribution of the annual and seasonal average PM2.5 concentrations estimated by the GWR model
各季均PM2.5浓度模拟空间分布(图5(a)-(d))表明:研究区各季PM2.5浓度同样存在明显的时空分异,其中冬季PM2.5平均污染最为严重,主要集中在河北石家庄、衡水、邢台和邯郸等重工业、高排放 产业密集区,整个研究区PM2.5浓度均值超过 175 μg/m3。春季和秋季PM2.5污染程度次之,而夏季浓度污染相对较轻。该分布特征一定程度反映冬季京津冀采暖期,大量燃煤污染会导致冬季PM2.5污染;夏季PM2.5浓度较低的原因一方面是无燃煤供暖造成的污染,另一方面是因其高温湿润气候条件有利于PM2.5污染物的扩散。
本研究以京津冀地区PM2.5浓度高分辨率空间分布制图为例,首次在1 km空间分辨率尺度尝试融合遥感AOD与高分遥感影像提取的地理特征因子,开展PM2.5浓度高空间分辨率GWR模拟研究,探索了顾及空间异质性的PM2.5浓度空间分布精细模拟制图的可行性与价值,并得到以下结论:
(1)在地面AERONET数据辅助下,利用SARA算法可获得高精度的精细尺度区域AOD时空分布特征,也为区域PM2.5浓度空间分布模拟提供良好 支撑。
(2)顾及参数空间非平稳特性的GWR模型较传统OLS模型更能准确地模拟京津冀地区PM2.5浓度的局部空间分异特性;而受气候条件及主要污染源类型差异影响,研究区不同时间粒度PM2.5浓度拟合模型的特征响应变量不同。
(3)以高分辨AOD为基础的多源遥感数据融合方法,为在精细尺度识别区域PM2.5浓度的时空变化特征提供了新的手段,可突破现有PM2.5稀疏监测的空间局限,有利于PM2.5污染综合防控策略的制定。
The authors have declared that no competing interests exist.
| [1] |
Particulate air pollution as a predictor of mortality in a prospective study of US adults [J]. |
| [2] |
Clean the air, heat the planet? [J].https://doi.org/10.1126/science.1181568 URL [本文引用: 1] 摘要
This paper discusses the measures to control air pollution, not only in Asia, but in many regions of the world. There is mounting evidence for particle- and ozone-related health effects. Furthermore, ozone and aerosol particles affect Earth's radiation balance: many aerosols cool the atmosphere (a negative forcing), whereas ozone and black carbon aerosol have a warming effect (a positive forcin...
|
| [3] |
Estimation of citywide air pollution in Beijing [J].https://doi.org/10.1371/journal.pone.0053400 URL PMID: 3539974 [本文引用: 1] 摘要
There has been discrepancies between the daily air quality reports of the Beijing municipal government, observations recorded at the U.S. Embassy in Beijing, and Beijing residents' perceptions of air quality. This study estimates Beijing's daily area PM(2.5) mass concentration by means of a novel technique SPA (Single Point Areal Estimation) that uses data from the single PM(2.5) observation station of the U.S Embassy and the 18 PM(10) observation stations of the Beijing Municipal Environmental Protection Bureau. The proposed technique accounts for empirical relationships between different types of observations, and generates best linear unbiased pollution estimates (in a statistical sense). The technique extends the daily PM(2.5) mass concentrations obtained at a single station (U.S. Embassy) to a citywide scale using physical relations between pollutant concentrations at the embassy PM(2.5) monitoring station and at the 18 official PM(10) stations that are evenly distributed across the city. Insight about the technique's spatial estimation accuracy (uncertainty) is gained by means of theoretical considerations and numerical validations involving real data. The technique was used to study citywide PM(2.5) pollution during the 423-day period of interest (May 10, 2010 to December 6, 2011). Finally, a freely downloadable software library is provided that performs all relevant calculations of pollution estimation.
|
| [4] |
上海市A城区大气PM10、PM2.5污染与居民日死亡数的相关分析 [J].https://doi.org/10.3969/j.issn.1000-8020.2004.03.010 URL 摘要
目的 探讨大气颗粒物污染对人群健康的影响。方法 采用Poisson广义相加模型对上海市A城区大气PM1 0 、PM2 5的日平均污染浓度与居民日死亡数进行相关回归分析 ,并控制了时间长期趋势、气象、季节、一周日效应混杂因素的影响。结果 当大气PM1 0 、PM2 5浓度上升 10 μg m3时 ,总死亡数分别上升 0 5 3%(0 2 2 %~ 0 85 % )、0 85 % (0 32 %~ 1 39% )。结论 大气粗细颗粒物污染具有潜在的急性人群健康危害。
Study on relationship between ambient PM10, PM2.5 pollution and daily mortality in a district in Shanghai [J].https://doi.org/10.3969/j.issn.1000-8020.2004.03.010 URL 摘要
目的 探讨大气颗粒物污染对人群健康的影响。方法 采用Poisson广义相加模型对上海市A城区大气PM1 0 、PM2 5的日平均污染浓度与居民日死亡数进行相关回归分析 ,并控制了时间长期趋势、气象、季节、一周日效应混杂因素的影响。结果 当大气PM1 0 、PM2 5浓度上升 10 μg m3时 ,总死亡数分别上升 0 5 3%(0 2 2 %~ 0 85 % )、0 85 % (0 32 %~ 1 39% )。结论 大气粗细颗粒物污染具有潜在的急性人群健康危害。
|
| [5] |
城市空气质量健康风险评估研究进展 [J].https://doi.org/10.11820/dlkxjz.2006.03.005 Magsci [本文引用: 1] 摘要
随着工业化、城市化的发展, 城市大气污染对环境和人体健康的潜在影响正日益引起世界 各国的普遍关注。尤其是污染物产生的健康效应评估是当前研究的热点。目前空气质量健康影响 评估采用的主要方法是风险评估。完整的环境健康风险评估框架包括危害鉴别, 剂量—效应关系 评价, 暴露评价和风险表征四个环节。作者对城市空气质量数值模拟、人口暴露、大气污染物毒理 及其健康效应的研究现状分别阐述, 从研究尺度, 研究方法和健康效应的量化指标角度剖析了目 前研究存在的局限性, 提出未来研究的趋向及需重点解决的问题。
Research progress on urban air quality health risk assessment [J].https://doi.org/10.11820/dlkxjz.2006.03.005 Magsci [本文引用: 1] 摘要
随着工业化、城市化的发展, 城市大气污染对环境和人体健康的潜在影响正日益引起世界 各国的普遍关注。尤其是污染物产生的健康效应评估是当前研究的热点。目前空气质量健康影响 评估采用的主要方法是风险评估。完整的环境健康风险评估框架包括危害鉴别, 剂量—效应关系 评价, 暴露评价和风险表征四个环节。作者对城市空气质量数值模拟、人口暴露、大气污染物毒理 及其健康效应的研究现状分别阐述, 从研究尺度, 研究方法和健康效应的量化指标角度剖析了目 前研究存在的局限性, 提出未来研究的趋向及需重点解决的问题。
|
| [6] |
Application of MODIS aerosol product in the study of air pollution in Beijing [J].https://doi.org/10.1360/05yd0395 URL [本文引用: 1] 摘要
The direct correlation between NASA MODIS aerosol optical depth (AOD) products and the air pollution index (API) in Beijing was found relatively low based on the long-term comparison analysis. The correlation improved to some extent after taking account of the seasonal variation of scale height and the vertical distribution of aerosols. The correlation coefficient further improved significantly after considering the influencing factor of Relative Humidity (RH). This study concluded that satellite remote-sensing could serve as an efficient tool for monitoring the spatial distribution of particulate pollutants on the ground-level, as long as corrections have been made in the two aforementioned processes. Taking advantage of the MODIS information, we analyzed a pollution episode occurring in October 2004 in Beijing. It indicated that satellite remote-sensing could describe the formation process of the ground-level pollution episode in detail, and showed that regional transport and the topography were crucial factors to air quality in Beijing. The annual averaged distribution in the urban area of Beijing and its surroundings could be also obtained from the high-resolution retrieval results, implicating that high-resolution satellite remote-sensing might be potential in monitoring the source distribution of particulate pollutants.
|
| [7] |
Using satellite remote sensing data to estimate the high-resolution distribution of ground-level PM2.5 [J].https://doi.org/10.1016/j.rse.2014.09.015 URL [本文引用: 1] 摘要
Although ground-level monitoring can provide accurate PM2.5 measurements, it has limited spatial coverage and resolution. In contrast, satellite-based monitoring can provide aerosol optical depth (AOD) products with higher spatial resolution and continuous spatial coverage, but it cannot directly measure ground-level PM2.5 concentration. Observation-based and simulation-based approaches have been actively developed to retrieve ground-level PM2.5 concentrations from satellite AOD and sparse ground-level observations. However, the effect of aerosol characteristics (e.g., aerosol composition and size distribution) on the AOD鈥揚M2.5 relationship is seldom considered in observation-based methods. Although these characteristics are considered in simulation-based methods, the results still suffer from model uncertainties. In this study, we propose an observation-based algorithm that considers the effect of the main aerosol characteristics. Their related effects on hygroscopic growth, particle mass extinction efficiency, and size distribution are estimated and incorporated into the AOD鈥揚M2.5 relationship. The method is applied to quantify the PM2.5 distribution in China. Good agreements between satellite-retrieved and ground-observed PM2.5 annual and monthly averages are identified, with significant spatial correlations of 0.90 and 0.76, respectively, at 565 stations in China. The results suggest that this approach can measure large scale PM distributions with verified results that are at least as good as those from simulation-based estimations. The results also show the method's capacity to identify PM2.5 spatial distribution with high-resolution at national, regional, and urban scales and to provide useful information for air pollution control strategies, health risk assessments, etc.
|
| [8] |
利用MODIS资料监测京津冀地区近地面PM2.5方法研究 [J].https://doi.org/10.3969/j.issn.1673-503X.2014.05.005 URL [本文引用: 2] 摘要
为了建立京津冀地区冬季近地面细颗粒物浓度监测方法的模型,利用气象模式资料对2013年1—3月MODIS的AOD二级深蓝算法产品进行湿度和垂直订正,与同期观测的地面细颗粒物PM2.5资料进行相关分析。结果表明:AQUA的MODIS深蓝算法AOD产品更适用于建立冬季AOD-PM2.5遥感监测模型,其R2为0.33;以气象模式资料中边界层高度代替气溶胶标高对MODIS的AOD进行垂直订正,并结合IMPROVE观测的气溶胶吸湿增长特征构建分区湿度订正方法,可以提高AODPM2.5模型结果的精度,建立较理想的京津冀地区冬季遥感反演综合模型,模型模拟结果与地面监测结果 R2达0.50以上。根据建立的模型计算了2013年1—3月京津冀地区PM2.5月平均浓度,京津冀地区1月PM2.5浓度较高,南部大部分地区空气质量已达到重度污染水平。
Study on monitoring surface PM2.5 concentration in Jing-Jin-Ji regions using MODIS data [J].https://doi.org/10.3969/j.issn.1673-503X.2014.05.005 URL [本文引用: 2] 摘要
为了建立京津冀地区冬季近地面细颗粒物浓度监测方法的模型,利用气象模式资料对2013年1—3月MODIS的AOD二级深蓝算法产品进行湿度和垂直订正,与同期观测的地面细颗粒物PM2.5资料进行相关分析。结果表明:AQUA的MODIS深蓝算法AOD产品更适用于建立冬季AOD-PM2.5遥感监测模型,其R2为0.33;以气象模式资料中边界层高度代替气溶胶标高对MODIS的AOD进行垂直订正,并结合IMPROVE观测的气溶胶吸湿增长特征构建分区湿度订正方法,可以提高AODPM2.5模型结果的精度,建立较理想的京津冀地区冬季遥感反演综合模型,模型模拟结果与地面监测结果 R2达0.50以上。根据建立的模型计算了2013年1—3月京津冀地区PM2.5月平均浓度,京津冀地区1月PM2.5浓度较高,南部大部分地区空气质量已达到重度污染水平。
|
| [9] |
Evaluation of MODIS aerosol retrieval algorithms over the Beijing-Tianjin-Hebei region during low to very high pollution events [J].https://doi.org/10.1002/2015JD023082 URL [本文引用: 1] 摘要
This study evaluates the performance of different MODerate resolution Imaging Spectroradiometer (MODIS) aerosol algorithms during fine particle pollution events over the Beijing-Tianjin-Hebei region using Aerosol Robotic Network aerosol optical depth (AOD). These algorithms include the Deep Blue (DB) Collection 5.1 (C5) and Collection 6 (C6) algorithms at 10 km resolution, the Dark Target (DT) C5 and C6 algorithms at 10 km, the DT C6 algorithm at 3 km, and the Simplified Aerosol Retrieval Algorithm (SARA) at 500 m, 3 km, and 10 km resolutions. The DB C6 retrievals have 34-39% less uncertainties, 2-3 times smaller root-mean-square error (RMSE), and 3-4 times smaller mean absolute error (MAE) than DB C5 retrievals. The DT C6 has 4-8% lower bias, 4-12% less overestimation, and smaller RMSE and MAE errors than DT C5. Due to underestimation of surface reflectance and the use of inappropriate aerosol schemes, 87-89% of the collocations of the DT C6 at 3 km fall above the expected error (EE), with overestimation of 64-79% which is 15-27% higher than that for the DT C6 at 10 km. The results suggest that the DT C6 at 3 km resolution is less reliable than that at 10 km. The SARA AOD has small RMSE and MAE errors with 90-96% of the collocations falling within the EE. Overall, the SARA showed 15-16% less uncertainty than the DB C6 (10 km), 69-72% less than the DT C6 (10 km), and 79-83% less than the DT C6 (3 km) retrievals.
|
| [10] |
土地利用/覆盖的空气污染效应分析 [J].https://doi.org/10.3724/SP.J.1047.2015.00290 URL Magsci [本文引用: 1] 摘要
以长株潭城市群核心区为对象,运用GIS和RS技术获取研究区土地利用/覆盖和空气污染分布格局,结合景观指数移动窗口分析结果,分年均和季节时间尺度分析NO<sub>2</sub>、PM<sub>10</sub>、O<sub>3</sub>、PM<sub>2.5</sub>浓度空间分布特征与土地利用格局的耦合关系。结果表明:长株潭城市群土地利用/覆盖,对空气污染物浓度的变化影响显著,具有季节效应。建设用地和道路面积占比与NO<sub>2</sub>、PM<sub>2.5</sub>浓度显著正相关,与O<sub>3</sub>浓度呈显著负相关;林地面积占比越大,NO<sub>2</sub>、PM<sub>2.5</sub>浓度越低;土地利用/覆盖对PM<sub>10</sub>浓度影响相对不稳定,易受不同季节局地尺度工业生产和建筑开发活动影响。从土地利用/覆盖微观配置角度,景观破碎程度越高,PM<sub>10</sub>浓度越高;散布与并列指数越大,NO<sub>2</sub>和PM<sub>2.5</sub>浓度越高、O<sub>3</sub>浓度越低;多样性指数与PM<sub>2.5</sub>浓度显著正相关。从优化土地利用降低空气污染角度创建的长株潭城市群生态绿心区的作用尚未真正展现。研究结果对明确反映土地利用/覆盖与空气污染特征间的关系,指导城市土地利用活动的合理开发具有重要的价值。
Impact analysis of land use/cover on air pollution [J].https://doi.org/10.3724/SP.J.1047.2015.00290 URL Magsci [本文引用: 1] 摘要
以长株潭城市群核心区为对象,运用GIS和RS技术获取研究区土地利用/覆盖和空气污染分布格局,结合景观指数移动窗口分析结果,分年均和季节时间尺度分析NO<sub>2</sub>、PM<sub>10</sub>、O<sub>3</sub>、PM<sub>2.5</sub>浓度空间分布特征与土地利用格局的耦合关系。结果表明:长株潭城市群土地利用/覆盖,对空气污染物浓度的变化影响显著,具有季节效应。建设用地和道路面积占比与NO<sub>2</sub>、PM<sub>2.5</sub>浓度显著正相关,与O<sub>3</sub>浓度呈显著负相关;林地面积占比越大,NO<sub>2</sub>、PM<sub>2.5</sub>浓度越低;土地利用/覆盖对PM<sub>10</sub>浓度影响相对不稳定,易受不同季节局地尺度工业生产和建筑开发活动影响。从土地利用/覆盖微观配置角度,景观破碎程度越高,PM<sub>10</sub>浓度越高;散布与并列指数越大,NO<sub>2</sub>和PM<sub>2.5</sub>浓度越高、O<sub>3</sub>浓度越低;多样性指数与PM<sub>2.5</sub>浓度显著正相关。从优化土地利用降低空气污染角度创建的长株潭城市群生态绿心区的作用尚未真正展现。研究结果对明确反映土地利用/覆盖与空气污染特征间的关系,指导城市土地利用活动的合理开发具有重要的价值。
|
| [11] |
Spatial modeling of PM2.5 concentrations with a multifactoral radial basis function neural network [J].https://doi.org/10.1007/s11356-015-4380-3 URL PMID: 25813644 [本文引用: 1] 摘要
Accurate measurements of PM2.5 concentration over time and space are especially critical for reducing adverse health outcomes. However, sparsely stationary monitoring sites considerably hinder the ability to effectively characterize observed concentrations. Utilizing data on meteorological and land-related factors, this study introduces a radial basis function (RBF) neural network method for estimating PM2.5 concentrations based on sparse observed inputs. The state of Texas in the USA was selected as the study area. Performance of the RBF models was evaluated by statistic indices including mean square error, mean absolute error, mean relative deviation, and the correlation coefficient. Results show that the annual PM2.5 concentrations estimated by the RBF models with meteorological factors and/or land-related factors were markedly closer to the observed concentrations. RBF models with combined meteorological and land-related factors achieved best performance relative to ones with either type of these factors only. It can be concluded that meteorological factors and land-related factors are useful for articulating the variation of PM2.5 concentration in a given study area. With these covariate factors, the RBF neural network can effectively estimate PM2.5 concentrations with acceptable accuracy under the condition of sparse monitoring stations. The improved accuracy of air concentration estimation would greatly benefit epidemiological and environmental studies in characterizing local air pollution and in helping reduce population exposures for areas with limited availability of air quality data.
|
| [12] |
A review of land-use regression models to assess spatial variation of outdoor air pollution [J].https://doi.org/10.1016/j.atmosenv.2008.05.057 Magsci [本文引用: 1] 摘要
Studies on the health effects of long-term average exposure to outdoor air pollution have played an important role in recent health impact assessments. Exposure assessment for epidemiological studies of long-term exposure to ambient air pollution remains a difficult challenge because of substantial small-scale spatial variation. Current approaches for assessing intra-urban air pollution contrasts include the use of exposure indicator variables, interpolation methods, dispersion models and land-use regression (LUR) models. LUR models have been increasingly used in the past few years. This paper provides a critical review of the different components of LUR models. We identified 25 land-use regression studies. Land-use regression combines monitoring of air pollution at typically 20–100 locations, spread over the study area, and development of stochastic models using predictor variables usually obtained through geographic information systems (GIS). Monitoring is usually temporally limited: one to four surveys of typically one or two weeks duration. Significant predictor variables include various traffic representations, population density, land use, physical geography (e.g. altitude) and climate. Land-use regression methods have generally been applied successfully to model annual mean concentrations of NO<sub>2</sub>, NO<sub><em>x</em></sub>, PM<sub>2.5</sub>, the soot content of PM<sub>2.5</sub> and VOCs in different settings, including European and North-American cities. The performance of the method in urban areas is typically better or equivalent to geo-statistical methods, such as kriging, and dispersion models. Further developments of the land-use regression method include more focus on developing models that can be transferred to other areas, inclusion of additional predictor variables such as wind direction or emission data and further exploration of focalsum methods. Models that include a spatial and a temporal component are of interest for (e.g. birth cohort) studies that need exposure variables on a finer temporal scale. There is a strong need for validation of LUR models with personal exposure monitoring.
|
| [13] |
Incorporating local land use regression and satellite aerosol optical depth in a hybrid model of spatiotemporal PM2. 5 exposures in the Mid-Atlantic states [J].https://doi.org/10.1021/es302673e URL PMID: 23013112 Magsci [本文引用: 1] 摘要
Satellite-derived aerosol optical depth (AOD) measurements have the potential to provide spatiotemporally resolved predictions of both long and short-term exposures, but previous studies have generally shown moderate predictive power and lacked detailed high spatio- temporal resolution predictions across large domains. We aimed at extending our previous work by validating our model in another region with different geographical and metrological characteristics, and incorporating fine scale land use regression and nonrandom missingness to better predict PM2.5 concentrations for days with or without satellite AOD measures. We start by calibrating AOD data for 2000-2008 across the Mid-Atlantic. We used mixed models regressing PM2.5 measurements against day-specific random intercepts, and fixed and random AOD and temperature slopes. We used inverse probability weighting to account for nonrandom missingness of AOD, nested regions within days to capture spatial variation in the daily calibration, and introduced a penalization method that reduces the dimensionality of the large number of spatial and temporal predictors without selecting different predictors in different locations. We then take advantage of the association between grid-cell specific AOD values and PM2.5 monitoring data, together with associations between AOD values in neighboring grid cells to develop grid cell predictions when AOD is missing. Finally to get local predictions (at the resolution of 50 m), we regressed the residuals from the predictions for each monitor from these previous steps against the local land use variables specific for each monitor. "Out-of-sample" 10-fold cross-validation was used to quantify the accuracy of our predictions at each step. For all days without AOD values, model performance was excellent (mean "out-of-sample" R-2 = 0.81, year-to-year variation 0.79-0.84). Upon removal of outliers in the PM2.5 monitoring data, the results of the cross validation procedure was even better (overall mean "out of sample" R-2 of 0.85). Further, cross validation results revealed no bias in the predicted concentrations (Slope of observed vs predicted = 0.97-1.01). Our model allows one to reliably assess short-term and long-term human exposures in order to investigate both the acute and effects of ambient particles, respectively.
|
| [14] |
Estimating ground-level PM2.5 concentrations in the southeastern US using geographically weighted regression [J].https://doi.org/10.1016/j.envres.2012.11.003 URL PMID: 23219612 [本文引用: 2] 摘要
Most of currently reported models for predicting PM(2.5) concentrations from satellite retrievals of aerosol optical depth are global methods without considering local variations, which might introduce significant biases into prediction results. In this paper, a geographically weighted regression model was developed to examine the relationship among PM(2.5), aerosol optical depth, meteorological parameters, and land use information. Additionally, two meteorological datasets, North American Regional Reanalysis and North American Land Data Assimilation System, were fitted into the model separately to compare their performances. The study area is centered at the Atlanta Metro area, and data were collected from various sources for the year 2003. The results showed that the mean local R(2) of the models using North American Regional Reanalysis was 0.60 and those using North American Land Data Assimilation System reached 0.61. The root mean squared prediction error showed that the prediction accuracy was 82.7% and 83.0% for North American Regional Reanalysis and North American Land Data Assimilation System in model fitting, respectively, and 69.7% and 72.1% in cross validation. The results indicated that geographically weighted regression combined with aerosol optical depth, meteorological parameters, and land use information as the predictor variables could generate a better fit and achieve high accuracy in PM(2.5) exposure estimation, and North American Land Data Assimilation System could be used as an alternative of North American Regional Reanalysis to provide some of the meteorological fields.
|
| [15] |
Estimating ground-level PM2.5 in China using satellite remote sensing [J].https://doi.org/10.1021/es5009399 URL PMID: 24901806 Magsci [本文引用: 1] 摘要
Estimating ground-level PM2.5 from satellite-derived aerosol optical depth (AOD) using a spatial statistical model is a promising new method to evaluate the spatial and temporal characteristics of PM2.5 exposure in a large geographic region. However, studies outside North America have been limited due to the lack of ground PM2.5 measurements to calibrate the model. Taking advantage of the newly established national monitoring network, we developed a national-scale geographically weighted regression (GWR) model to estimate daily PM2.5 concentrations in China with fused satellite AOD as the primary predictor. The results showed that the meteorological and land use information can greatly improve model performance. The overall cross-validation (CV) R-2 is 0.64 and root mean squared prediction error (RMSE) is 32.98 mu g/m(3). The mean prediction error (MPE) of the predicted annual PM2.5 is 8.28 mu g/m(3). Our predicted annual PM2.5 concentrations indicated that over 96% of the Chinese population lives in areas that exceed the Chinese National Ambient Air Quality Standard (CNAAQS) Level 2 standard. Our results also confirmed satellite-derived AOD in conjunction with meteorological fields and land use information can be successfully applied to extend the ground PM2.5 monitoring network in China.
|
| [16] |
High-resolution satellite mapping of fine particulates based on geographically weighted regression [J].
concentrations over urban areas.
|
| [17] |
A review of land-use regression models for characterizing interurban air pollution exposure [J].https://doi.org/10.1080/08958370701495998 URL PMID: 17886060 [本文引用: 1] 摘要
Epidemiologic studies of air pollution require accurate exposure assessments at unmonitored locations in order to minimize exposure misclassification. One approach gaining considerable interest is the land-use regression (LUR) model. Generally, the LUR model has been utilized to characterize air pollution exposure and health effects for individuals residing within urban areas. The objective of this article is to briefly summarize the history and application of LUR models to date outlining similarities and differences of the variables included in the model, model development, and model validation. There were 6 studies available for a total of 12 LUR models. Our findings indicated that among these studies, the four primary classes of variables used were road type, traffic count, elevation, and land cover. Of these four, traffic count was generally the most important. The model R2 explaining the variability in the exposure estimates for these LUR models ranged from .54 to .81. The number of air sampling sites generating the exposure estimates, however, was not correlated with the model R2 suggesting that the locations of the sampling sites may be of greater importance than the total number of sites. The primary conclusion of this study is that LUR models are an important tool for integrating traffic and geographic information to characterize variability in exposures.
|
| [18] |
Application of land use regression to estimate long-term concentrations of traffic-related nitrogen oxides and fine particulate matter [J].https://doi.org/10.1021/es0606780 URL PMID: 17438795 [本文引用: 1] 摘要
Land use regression (LUR) is a promising technique for predicting ambient air pollutant concentrations at high spatial resolution. We expand on previous work by modeling oxides of nitrogen and fine particulate matter in Vancouver, Canada, using two measures of traffic. Systematic review of historical data identified optimal sampling periods for NO and N02. Integrated 14-day mean concentrations were measured with passive samplers at 116 sites in the spring and fall of 2003. Study estimates for annual mean NO and NO2 ranged from 5.4-98.7 and 4.8-28.0 ppb, respectively. Regulatory measurements ranged from 4.8-29.7 and 9.0-24.1 ppb and exhibited less spatial variability. Measurements of particle mass concentration (PM2.5) and light absorbance (ABS) were made at a subset of 25 sites during another campaign. Fifty-five variables describing each sampling site were generated in a Geographic Information System (GIS) and linear regression models for NO, NO2, PM2.5, and ABS were built with the most predictive covariates. Adjusted R(2) values ranged from 0.39 to 0.62 and were similar across traffic metrics. Resulting maps show the distribution of NO to be more heterogeneous than that of NO2, supporting the usefulness of this approach for assessing spatial patterns of traffic-related pollution.
|
| [19] |
A Simplified high resolution MODIS Aerosol Retrieval Algorithm (SARA) for use over mixed surfaces [J].https://doi.org/10.1016/j.rse.2013.04.014 URL [本文引用: 1] 摘要
Aerosol Optical Depth (AOD) is a measure of the columnar atmospheric aerosol content. Satellite remote sensing has been used to retrieve AOD over land and ocean at spatial resolutions of several to several tens of km. In most cases, a Radiative Transfer Model (RTM) is used to construct a look-up table (LUT) to act as a map between measurements and physical quantities. In the current study, MODerate resolution Imaging Spectroradiometer (MODIS) measurements were used to develop a Simplified Aerosol Retrieval Algorithm (SARA) for use over Hong Kong at high (50002m) spatial resolution, without using a LUT. Instead, RTM calculations were applied directly to the MODIS data, with the aerosol properties derived from a local urban Aerosol Robotic Network (AERONET) station at the Hong Kong Polytechnic University, and surface reflectance from the MOD09GA level-2 daily surface reflectance product. For validation, the SARA AOD at 50002m, along with the operational MODIS aerosol product (MOD04 C005) at 1002km spatial resolution, was compared with data from a ground-based Microtops II sun photometer at the Hong Kong International Airport, a Sky-radiometer at the City University of Hong Kong, and an AERONET station at Hong Kong Hok Tsui. The 50002m AOD retrieved from the SARA showed a high consistency with ground-based AOD measurements, with average correlation coefficient ~020.964, root mean square error (RMSE) ~020.077, and mean absolute error (MAE) ~020.065. The SARA AOD showed a good agreement with MOD04 C005 AOD over both urban and rural areas of Hong Kong, with average correlation coefficient ~020.917, RMSE ~020.087, and MAE ~020.072. The results demonstrate that our simplified AOD algorithm is better able to represent aerosol conditions over Hong Kong than the MOD04 C005 standard product as well as other higher resolution algorithms which have been tested over Hong Kong.
|
| [20] |
Validation and accuracy assessment of a Simplified Aerosol Retrieval Algorithm (SARA) over Beijing under low and high aerosol loadings and dust storms [J].https://doi.org/10.1016/j.rse.2014.07.015 URL Magsci [本文引用: 1] 摘要
An effective Simplified Aerosol Retrieval Algorithm (SARA) based on real viewing geometry and encompassing a wide range of aerosol conditions and types (omega(0) = 030-1.0) was tested over Beijing, a city under the influence of both anthropogenic emissions and dust storms. The SARA AOD was retrieved at seven resolutions (500 m, 1 km, 2 km, 4 km, 6 km, 8 km, and 10 km) using MODIS level 1 and 2 data products (MOD02, MOD03, and MOD09) for the years 2012 and 2013. For comparison purposes, the MODIS dark-target (DT) AOD observations at 10 km resolution were obtained for the same time period. Both algorithms, SARA and MODIS DT were validated using Beijing_RADI and Beijing_CAMS AERONET AOD measurements and accuracy was evaluated using the Confidence Envelope of Expected Error (CEEE). The SARA AOD achieved very high correlation (0.972-0.994) with low Root Mean Square Error (RMSE similar to 0.067-0.133) and very high accuracy (87-95%). In comparison, the MODIS DT algorithm overestimated AOD for both low and high AOD observations with large RMSE (0.115-0342) and very low accuracy (20-52%). The robustness and accuracy of SARA and the MODIS DT algorithms for low (ADD < 0.40) and high (AOD > 0.40) aerosol loadings was evaluated using the Fraction of Expected Error (FEE). The SARA algorithm achieved 46-60% higher average accuracy than the MODE DT algorithm indicating SARA's greater accuracy and reliability in AOD retrieval over Beijing under low and high aerosol loadings, including severe dust storms. The SARA algorithm is unique among satellite based AOD retrievals, in its ability to depict extreme dust storms (AOD similar to 5.0) at fine spatial resolution (500 m) over urban and suburban areas such as Beijing, XiangHe and the Bohai Sea, as is demonstrated by the dust storm of 17th April 2006. (C) 2014 Elsevier Inc. All rights reserved.
|
| [21] |
Geographically weighted regression: a method for exploring spatial nonstationarity [J].https://doi.org/10.1111/j.1538-4632.1996.tb00936.x URL [本文引用: 1] 摘要
By Mark S. Pearce; Geographically weighted regression: A method for exploring spatial nonstationarity
|
| [22] |
Estimating regional spatial and temporal variability of PM2.5 concentrations using satellite data, meteorology, and land use information [J].https://doi.org/10.1289/ehp.0800123 URL PMID: 19590678 [本文引用: 1] 摘要
Studies of chronic health effects due to exposures to particulate matter with aerodynamic diameters
|
| [23] |
利用MODIS研究中国东部地区气溶胶光学厚度的分布和季节变化特征 [J].
通过与太阳光度计观测结果的对比, 确认了NASA Terra卫星的MODIS气溶胶产品的精度. 利用2000年8月至2003年4月MODIS气溶胶产品统计了中国东部地区气溶胶光学特征和季节变化特点, 认为人类活动是中国东部气溶胶的主要来源, 所有的大值区都分布在华北平原、长江中下游平原、四川盆地、珠江三角洲等工业发达、人口密集、经济迅速发展的地区. Ångström指数的分布显示中国东部气溶胶以人类活动产生的气溶胶为主, 但在春季、秋季、冬季受到来自北方沙尘的影响显著. 人口密集城市地区气溶胶Ångström指数低于其周边地区, 显示城市地区由于人类活动产生的扬尘、煤烟等大粒子占有相当比例, 与发达国家城市地区不同. 这些结果为气候研究和环境研究提供了重要的基本数据.
Spatial and seasonal distribution of MODIS aerosol optical depth over Eastern China [J].
通过与太阳光度计观测结果的对比, 确认了NASA Terra卫星的MODIS气溶胶产品的精度. 利用2000年8月至2003年4月MODIS气溶胶产品统计了中国东部地区气溶胶光学特征和季节变化特点, 认为人类活动是中国东部气溶胶的主要来源, 所有的大值区都分布在华北平原、长江中下游平原、四川盆地、珠江三角洲等工业发达、人口密集、经济迅速发展的地区. Ångström指数的分布显示中国东部气溶胶以人类活动产生的气溶胶为主, 但在春季、秋季、冬季受到来自北方沙尘的影响显著. 人口密集城市地区气溶胶Ångström指数低于其周边地区, 显示城市地区由于人类活动产生的扬尘、煤烟等大粒子占有相当比例, 与发达国家城市地区不同. 这些结果为气候研究和环境研究提供了重要的基本数据.
|

/
| 〈 |
|
〉 |