唐志光 , 李弘毅
, 李弘毅
TANG Zhiguang, LI Hongyi
通讯作者:
收稿日期: 2015-06-29
修回日期: 2015-10-28
网络出版日期: 2016-07-15
版权声明: 2016 《地球信息科学学报》编辑部 《地球信息科学学报》编辑部 所有
基金资助:
作者简介:
作者简介:唐志光(1985-),男,湖南邵阳人,博士,讲师,主要从事冰冻圈遥感研究。E-mail: tangzhg11@lzb.ac.cn
展开
摘要
青藏高原地形复杂,积雪时空分布异质性较强且大部分地区积雪较薄,而被动微波遥感因其空间分辨率低以及雪深反演中的不确定性,极大地限制了其反演青藏高原雪深的精度。本文尝试将多源遥感数据以及与积雪模型(SnowModel)相结合,来重建更高质量的青藏高原雪深数据。首先,利用MODIS积雪面积比例产品,根据构建的积雪衰减曲线以及经验的融合规则对低分辨率被动微波雪深进行了降尺度;然后,结合MODIS/被动微波融合雪深数据和SnowModel对研究区进行雪深数据同化实验;最后,利用地面站实测雪深数据对MODIS/被动微波融合雪深以及同化输出雪深的精度进行了分析和对比。结果表明,基于数据同化方法得到的雪深数据更接近地面观测雪深值,通过均方根误差以及相关系数的对比,同化雪深结果优于MODIS/被动微波融合雪深结果。
关键词:
Abstract
Due to the variability and complexity of the topography in the Tibetan Plateau, the snow cover over most area of Tibetan Plateau is thin and revealing a high temporal and spatial heterogeneity. The passive microwave remote sensing greatly limits the precision of retrieved snow depth over the Tibetan Plateau, on account of its low spatial resolution and the uncertainty existed during snow depth retrieval. This paper attempts to reconstruct higher quality of snow depth data over the Tibetan Plateau through the fusion of multi-source remote sensing data, combining with a physic based snow model (SnowModel). This research mainly includes the following aspects: first of all, using the in-situ observed snow depth data and corresponding MODIS fractional snow cover data, the snow depletion curve of the study area is established. The MODIS fractional snow cover products (500 m) and passive microwave snow depth products (0.25°) are combined to produce the downscaled snow depth data (0.1°) using an empirical combination rule and the established snow depletion curve. Then, the downscaled snow depth data are assimilated into the SnowModel using the ensemble Kalman filter (EnKF) method. The accuracy of the downscaled snow depth data and the assimilated snow depth are analyzed through comparing them with the in situ observed snow depth data. The results show that there is an obvious depletion curving relationship between the snow depth and fractional snow cover area in the Tibetan Plateau. Using the root mean square error (RMSE) and correlation coefficients (R) as the evaluation standard, the assimilated snow depth is evaluated to be closer to the in-situ observed snow depth than the downscaled snow depth data.
Keywords:
积雪作为冰冻圈的重要组成部分,是地球表层上地域分布最广泛、季节变化最明显、对气候异常变化最敏感的覆盖物[1]。积雪因特有的表面高反照率、低导热率以及融雪水文效应,对地气系统的辐射平衡、能量交换和水分循环等均产生显著影响[2-3];同时,其也影响着地球陆地上中高纬度地带和高海拔地区的生态地理环境,常常导致积雪灾害,危及农牧业生产、交通安全,甚至造成居民生命财产的重大损失。青藏高原是全球中低纬度典型的高海拔积雪分布区,也是中国及周边各国10余条大江河的重要发源地。青藏高原积雪变化影响该区域甚至全球尺度的水循环与气候变化进程,已有研究表明青藏高原积雪异常对东亚夏季季风及季风降水具有显著影响[4-7],且积雪的时空分布对气候变化异常敏感[8-9]。因此,准确地监测青藏高原的积雪分布信息具有重要意义。
自20世纪60年代初期,从可见光到微波的一系列遥感传感器已在积雪研究中发挥了重要的作用。在气候与冰冻圈(CliC)、地球观测系统(EOS)、寒区陆面过程实验(CLPX)等的国际研究计划中,积雪遥感都被赋予了重要的位置。积雪遥感中最常用的波段是可见光、近红外和微波。其中,可见光和近红外波段主要用于提取积雪面积,特别是自Terra和Aqua卫星发射以来,因其携带的MODIS传感器具有较高的光谱及时空分辨率,决定了它在积雪面积监测中的绝对优势,已发展成熟的MODIS积雪制图算法[10-11]和全球的MODIS积雪面积产品[12]得到了广泛的验证和应用,但光学遥感最大的弱点是不能用于反演雪深以及易受云的影响。被动微波遥感不仅能够全天时、全天候地观测积雪,也能够穿透大部分积雪层以探测雪深信息,而且其时间分辨率高,能够迅速覆盖全球,在监测全球和大陆尺度的积雪时空变化中发挥重要作用,也已经发展了较为成熟的雪深反演算法和遥感产品[13-16]。然而,由于积雪属性(面积、深度、粒径、密度等)的非均匀分布以及被动微波遥感空间分辨率极低(约25 km)的缺点,使利用被动微波遥感提取的雪深信息存在较大的不确定性[17-18],这在雪深较薄且呈非连续分布的青藏高原尤为突出。因此,利用其他较高空间分辨率的积雪遥感数据产品,特别是高质量的MODIS积雪面积产品,以更好地表达低分辨率的被动微波遥感雪深数据像元内的异质性,是提高雪深数据精度的有效途径。
积雪水文模拟是研究积雪分布的另一重要手段。随着积雪水文模型从一维过程积雪模型向空间三维积雪模型的转变,以及对积雪物理过程描述的改进,积雪的空间分布模拟能力取得长足的进步[19]。特别是随着陆面数据同化研究的成熟,积雪数据同化的研究也日益活跃起来。积雪数据同化方法能将积雪观测信息(或遥感资料)和积雪过程模型结合起来,采用优化算法实现积雪的模型模拟和观测信息的优势互补,从而提高积雪参数的反演精度。目前,已有大量研究通过在积雪模型中同化积雪遥感产品来提高雪深/雪水当量的反演精度,主要包括:(1)同化MODIS积雪面积产品,积雪面积的同化采用积雪面积-雪深之间经验关系的直接插入法或积雪衰减曲线来约束模型模拟的雪深[20-21];(2)直接同化被动微波遥感的雪深数据[22-23];(3)对MODIS积雪面积和被动微波雪深数据的多尺度同化[24-25]。这些研究所采用的同化算法多为集合卡尔曼滤波(Ensemble Kalman Filter,EnKF)[26]。
本研究以青藏高原为研究区,结合去云后的MODIS积雪面积比例产品、被动微波雪深产品以及积雪模型(SnowModel),尝试通过MODIS积雪面积比例数据和被动微波雪深数据的融合以及数据同化的方法来重建更高质量的青藏高原雪深数据;并采用地面站实测雪深数据对MODIS/被动微波融合雪深以及同化输出雪深结果的精度进行了分析和对比。
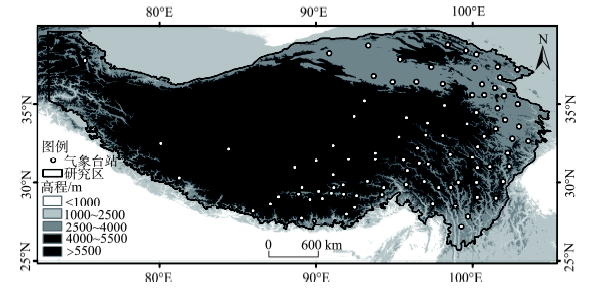
研究区为海拔大于2500 m的青藏高原地区(图1),位于73°~105°E,25°~40°N之间,总面积约为296.8万km2。研究区平均海拔为4367 m。青藏高原四周都是大山脉,积雪主要集中在这些山脉地区,包括南部的喜马拉雅山、西部的喀喇昆仑山、北部的昆仑山、东北部的祁连山、西南部的横断山等。
2.2.1 去云后的MODIS积雪面积比例数据
唐志光等[9,27]已对MODIS积雪面积比例产品在青藏高原的精度进行了验证,并针对该产品中存在大量云覆盖的问题,发展了基于三次样条函数的去云算法,生成了一套青藏高原逐日无云的MODIS积雪面积比例数据集(2000-2011年),经验证表明该去云后的产品具有较高的精度。该数据集也已经发布到“寒区旱区科学数据中心”(http://westdc.westgis.ac.cn)。本文所选用的2000-2008年MODIS积雪面积比例数据即来源于该数据集,数据投影方式为UTM,空间分辨率为500 m。
2.2.2 被动微波雪深数据
本文所用的青藏高原被动微波雪深数据为车涛等[15]发展的中国雪深长时间序列数据集,来源于“寒区旱区科学数据中心”(http://westdc.westgis.ac.cn),并选用了该数据集中2001-2008年的被动微波雪深数据产品,数据投影方式为经纬度投影,空间分辨率为0.25°。
2.2.3 气象要素驱动数据
本文采用降尺度后的青藏高原近地表大气驱动数据作为积雪模型(SnowModel)的输入数据(包括气温、地表气压、水汽混合比、辐射、风速、风向和降雨等),其空间分辨率为0.1°,时间分辨率为1 h。该数据是利用新一代数值模型WRF(Weather Research & Forecasting Model),对一天4次、空间分辨率为1°×1°的美国大气与海洋局的全球预测系统(Global Forecast System,GFS)数据进行动力降尺度制备而成[28-29],并且通过黑河流域的22个站点观测资料的逐日和逐时验证表明,该降尺度方法得到的近地表大气驱动数据具有较好的可信度[29]。
2.2.4 地面台站及其他数据
本文收集了研究区94个地面气象台站2001-2008年的逐日积雪深度观测资料。研究区地面气象台站的空间分布见图1。气象台站的海拔高度介于2200~4800 m之间。地面气象站雪深观测数据用于对MODIS/被动微波融合雪深数据以及雪深同化结果的精度评价。另外,数据还包括研究区植被类型数据,其来源于“黑河计划数据管理中心”(http://westdc.westgis.ac.cn)。植被类型数据也作为积雪模型(SnowModel)的输入数据。
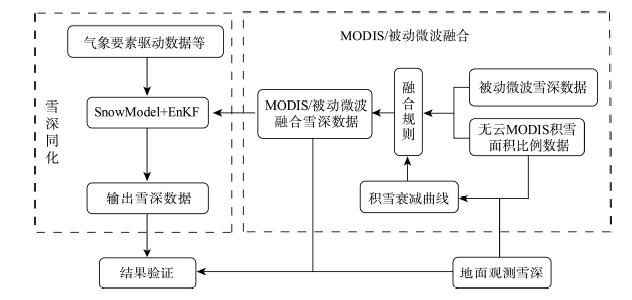
研究区雪深重建流程如图2所示,主要包括积雪衰减曲线构建、融合MODIS积雪面积的被动微波雪深降尺度和雪深数据同化3方面。
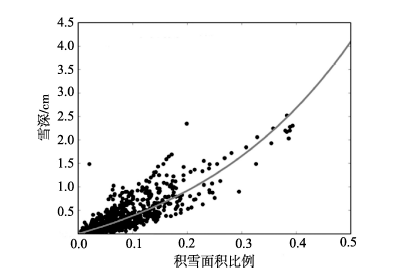
积雪衰减曲线是指积雪消融过程中积雪面积比例与雪深之间经验函数关系[30],已被广泛应用于水文模型中雪深的模拟以及积雪同化实验中[20,24,30]。本文采用研究区的94个地面台站雪深观测数据、去云后的MODIS积雪面积比例数据来构建适合于本研究区的积雪衰减曲线。鉴于单点雪深观测的空间代表性较差,在积雪衰减曲线构建过程中,选取每个地面观测站所对应的94个MODIS像元的集合作为理想的“抽样地区”,则该抽样地区的每个MODIS像元都有一个对应地面台站的观测雪深值,因此能获得代表该“抽样地区”的平均雪深和积雪面积比例。“抽样地区”平均雪深(
式中:
通过计算足够日数(n个)的
式中:FSC为积雪面积比例;SD为该积雪面积比例所对应的雪深,单位为cm;该拟合曲线对应的决定系数R2值为0.67。
为了检验所构建的积雪衰减曲线的有效性,抽选研究区2001、2003、2005年的相关数据(地面台站雪深观测数据、去云后的MODIS积雪面积比例数据)进行交叉验证,同样以地面台站所对应的94个MODIS像元的集合作为理想的“抽样地区”。验证方法为:首先,基于地面站雪深观测数据和MODIS积雪面积比例数据,利用式(1)、(2)分别计算出2001、2003、2005年该“抽样地区”的逐日“真实”平均雪深(
表1 积雪衰减曲线的雪深估算精度
Tab. 1 The accuracy of snow depth simulation using the snow depletion curve
| 年份 | MAE/cm | RMSE/cm | R |
|---|---|---|---|
| 2001 | 0.31 | 0.77 | 0.74 |
| 2003 | 0.27 | 0.63 | 0.81 |
| 2005 | 0.37 | 0.95 | 0.67 |
| 平均值 | 0.32 | 0.78 | 0.74 |
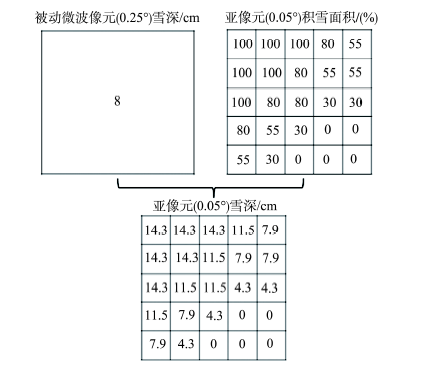
融合算法包含2个基本假设:(1)低分辨率的被动微波像元的雪深值代表该像元区域内雪深的平均值;(2)被动微波像元的雪深可以根据其亚像元的积雪面积大小进行线性的重新分配。因此,根据被动微波像元雪深值以及每个亚像元的积雪面积比例值,可计算出每个亚像元的雪深大小。图4为该融合算法的示意图。
图4 MODIS/被动微波积雪产品融合示意图
Fig. 4 Sketch map of snow depth downscaling method combining MODIS and passive microwave snow data
以利用MODIS积雪面积将被动微波雪深数据降尺度到空间分辨率为0.05°为例。首先对去云后的MODIS积雪面积比例数据(500 m,约为0.005°)进行投影转换和重采样,投影转换成与被动微波雪深数据一致的经纬度投影,像元大小重采样为0.05°。每一个0.05°的亚像元的雪深值的计算如式(4)所示。
式中:
在融合算法中还考虑了以下2种特殊情况:
(1)被动微波像元(0.25°)雪深值大于0(
(2)亚像元(0.05°)的积雪面积比例值大于0(即
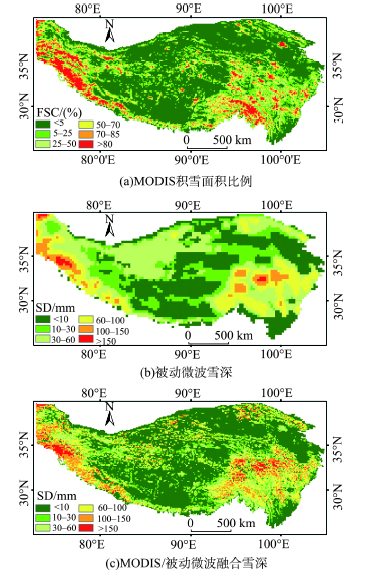
利用MODIS积雪面积比例产品、被动微波雪深产品,通过上述融合算法计算得出研究区0.05°的融合雪深数据。为了在雪深数据同化的过程中与气象要素驱动数据(0.1°)的空间分辨率保持一致,最终的融合雪深数据被重采样到0.1°。图5为2008年3月25日MODIS积雪面积比例、被动微波雪深以及其对应的MODIS/被动微波融合雪深数据。
图5 研究区MODIS/被动微波融合雪深示意图
Fig. 5 An example of snow depth downscaling combining MODIS and passive microwave snow data
3.3.1 雪深同化系统的构成
雪深同化系统的构成如图2所示。模型算子选用分布式积雪模型(Snow Model);数据同化采用集合卡尔曼滤波(EnKF)算法。选用MODIS/被动微波融合雪深数据作为观测数据进行直接同化。
(1)分布式积雪过程模型-SnowModel
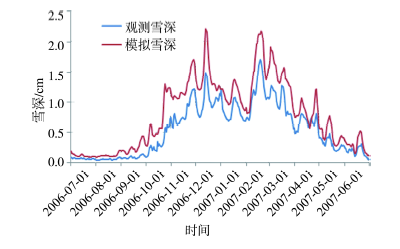
选用Liston等[31]发展的分布式积雪过程模型-SnowModel作为雪深同化系统的模型算子,该模型已经得到广泛的应用和区域性验证。模拟过程包含了积雪累积、雪升华、风吹雪条件下的积雪重新分布、积雪密度变化和积雪融化。模型所需的输入包括:降水、气温、相对湿度、风速、风向、太阳辐射、长波辐射、地表气压,以及空间分布的植被类型数据等。详细的模型介绍可参阅文献[31]。图6为2006-2007年一个水文年中SnowModel在青藏高原地区的模拟精度结果,图中所列数值为研究区94个地面站点所对应的模拟/观测雪深的平均值。由图6可看出,SnowModel能较好地模拟雪深的变化,但总体上还存在一定程度的高估;以观测雪深为“真值”,得出模拟雪深值的平均绝对误差为0.23 cm,均方根误差为0.45 cm。
图6 SnowModel的雪深模拟精度
Fig. 6 The simulation accuracy of snow depth using SnowModel
(2)集合卡尔曼滤波(EnKF)算法
集合卡尔曼滤波最早由Evensen[32]和Burgers 等[33]提出,是迄今数据同化领域应用最为广泛的算法。它的主要原理是利用蒙特卡罗方法来实现集合预报、集合滤波和误差矩阵的计算。集合卡尔曼滤波能很好地解决数据同化系统中如何处理观测算子和模型算子非线性的问题,避免了模型的线性化,从而保留了模型的动态特征[34]。有关集合卡尔曼滤波的详细介绍可参考文献[26]。
3.3.2 雪深同化策略
本研究中将积雪过程模型(SnowModel)模拟的积雪状态变量(雪深)作为反演的先验知识,通过集合卡尔曼滤波(EnKF)算法融合雪深的观测信息(MODIS/被动微波融合雪深数据)。随着模型系统的运行,不断的引入观测,最终获取同化后的雪深数据集。
同化过程中,采用50个集合来实现EnKF的运行;对系统中的驱动数据(短波辐射、长波辐射、降水和气温)、模型积雪状态变量(雪深)和雪深观测数据(MODIS/被动微波融合雪深)进行扰动。扰动规则参考已有的相关研究[24-25]:对短波辐射、降水、模型状态变量(雪深)和雪深观测数据进行乘法扰动(均值为1);对长波辐射和气温数据采用加法扰动(均值为0);对驱动变量的扰动还考虑了变量之间的相关性。这些变量的扰动参数如表2所示。根据SnowModel模型预报的雪深集合以及观测(MODIS/被动微波融合雪深)的雪深集合,利用EnKF算法得到更新的雪深集合,其平均值作为该时刻的最优雪深数据输出,而更新后的雪深集合又作为下一时刻SnowModel的初始场。
表2 基于EnKF的雪深同化扰动参数表
Tab. 2 Perturbation parameters in the EnKF estimation of snow depth
| 变量 | 扰动方法 | 标准差 | 相关系数矩阵 | ||||
|---|---|---|---|---|---|---|---|
| 驱动 | 气温 | 加法 | 0.5 | 1.0 | -0.5 | 0.3 | 0.6 |
| 降水 | 乘法 | 0.5 | -0.5 | 1.0 | -0.5 | 0.5 | |
| 短波辐射 | 乘法 | 0.1 | 0.3 | -0.5 | 1.0 | -0.3 | |
| 长波辐射 | 加法 | 15 | 0.6 | 0.5 | -0.3 | 1.0 | |
| 模型状态 | 雪深 | 乘法 | 0.01 | - | - | - | - |
| 观测 | 融合雪深 | 乘法 | 0.2 | - | - | - | - |
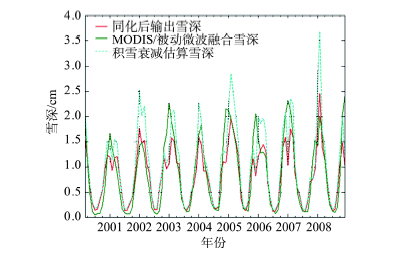
本文采用MODIS/被动微波积雪产品融合、数据同化的方法重建了研究区2000年3月至2008年12月的雪深数据;另外,直接利用积雪衰减曲线来进行积雪面积到雪深的转化。重建后的雪深数据空间分辨率均为0.1°。由图7可看出,当平均雪深小于0.5 cm和大于1 cm时,积雪衰减曲线估算雪深和MODIS/被动微波融合雪深二者之间具有明显的差异。当平均雪深大于1 cm时(雪季),积雪面积比例为100%的像元也增加,此时积雪衰减曲线估算雪深偏高是因为当像元积雪面积达到或者接近100%时,衰减曲线失效所引起的误差导致该方法计算的雪深出现高估。而当研究区平均雪深小于0.5 cm时(夏季),研究区大部分有雪地区都集中在高海拔山脉地区,分布极不均匀,呈明显的斑状分布,此时被动微波反演的雪深因其分辨率低而产生较大的误差,这可能是导致积雪衰减曲线估算雪深与MODIS/被动微波融合雪深之间有较大差异的主要原因。
图7 不同重建方法的雪深结果比较(2000-2008年)
Fig. 7 Comparison of different evaluated snow depth from 2000 to 2008 in TP
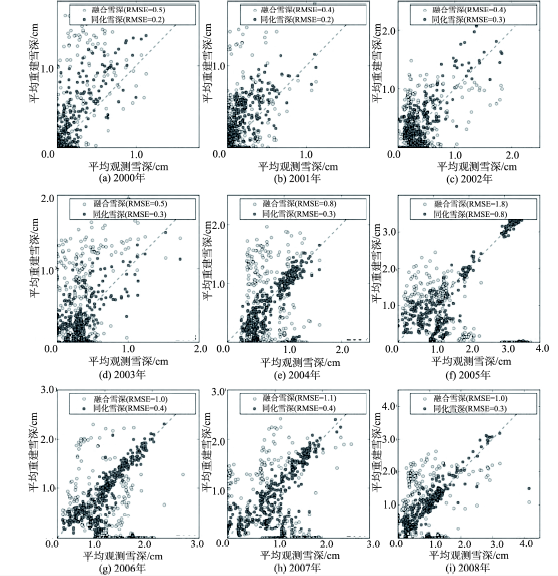
同化方法的输出雪深与MODIS/被动微波融合雪深之间也体现出明显的差异。为了分析MODIS/被动微波融合雪深与同化输出雪深数据的精度,选用了研究区2000-2008年94个地面台站的雪深观测数据作为“真值”与重建后的雪深数据进行对比分析。首先,分别对研究区94个地面站的观测雪深值以及所对应的94个重建雪深像元的雪深值取平均;然后,将平均观测雪深与平均重建雪深进行对比,这样每一天都能计算得到代表研究区的一个平均观测雪深与平均重建雪深样本。图8为2000-2008逐年的重建雪深与观测雪深的对比结果,并统计了2种方法的重建雪深结果与地面观测“真值”之间的均方根误差(RMSE)与相关系数(R)(表3)。
表3 重建雪深与站点观测雪深的精度验证结果
Tab. 3 Results of the validation between the simulated and observed snow depth
| 年份 | 融合雪深 | 同化雪深 | |||
|---|---|---|---|---|---|
| RMSE/cm | R | RMSE/cm | R | ||
| 2000 | 0.51 | 0.51 | 0.20 | 0.73 | |
| 2001 | 0.43 | 0.45 | 0.23 | 0.66 | |
| 2002 | 0.40 | 0.47 | 0.35 | 0.81 | |
| 2003 | 0.50 | 0.55 | 0.31 | 0.61 | |
| 2004 | 0.80 | 0.40 | 0.34 | 0.79 | |
| 2005 | 1.79 | 0.27 | 0.82 | 0.79 | |
| 2006 | 1.02 | 0.34 | 0.44 | 0.82 | |
| 2007 | 1.11 | 0.37 | 0.42 | 0.76 | |
| 2008 | 1.05 | 0.41 | 0.34 | 0.87 | |
图8 同化雪深、MODIS/被动微波融合雪深与站点观测雪深的对比
Fig. 8 Comparison between the simulated and observed snow depth.
从图8可看出,经过同化后得到的雪深数据更接近地面观测的雪深“真值”。近9年的比较结果中,同化后雪深数据的均方根误差(RMSE)在0.20~0.82 cm之间,相关系数(R)在0.61~0.87之间;而MODIS/被动微波融合雪深的均方根误差(RMSE)在0.40~1.79 cm之间,相关系数(R)范围为0.27-0.55。每一年的评价结果中,与MODIS/被动微波融合雪深数据相比,同化后的雪深数据的均方根误差(RMSE)都降低,精度得到改善,特别是在2005、2006、2007和2008年。
由于受研究区复杂地形等因素的影响,本文的雪深重建方法存在一定的不确定性:
(1)MODIS/被动微波融合降尺度过程是建立在被动微波像元的雪深可以根据其内部亚像元的积雪面积为权重进行线性的重新分配的假设基础上。虽然这种方法能根据较高分辨率的MODIS积雪面积对被动微波雪深进行降尺度,而且基本保持被动微波反演的雪水当量的总量保持不变,但是由于研究区复杂地形的影响导致积雪的非连续分布,使得以积雪面积为权重的线性分配方法本身存在一定不确定性。
(2)构建的研究区经验积雪衰减曲线源于有限的地面观测站雪深及其对应的MODIS积雪面积,没有足够的地面观测数据来构建各种不同地形条件下积雪面积与雪深的关系。另外,积雪衰减曲线构建过程中,拟合曲线的样本像元的积雪面积比例都小于50%(图3);所以当积雪面积比例大于50%时,该积雪衰减曲线关系式的估算雪深可能存在较大的误差。
(3)积雪过程的模拟也会受到研究区显著的空间异质性的影响。研究区不稳定、斑状的积雪分布广泛、风吹雪频繁发生、冻土分布广泛、下垫面具有高度的异质性,这都会影响积雪的模拟精度。山区的地形起伏也会对积雪模拟带来较大影响,不同坡度和曲率的等尺寸网格上的积雪水热过程也是完全不同的[19]。然而,本研究由于受计算速度和驱动数据的限制,对整个研究区融雪过程的模拟都是一致的,因此,今后的研究中应考虑非均匀的积雪过程,采用不同的参数化方案来进行积雪的空间模拟。
本文通过结合多源遥感数据、分布式积雪过程模型(SnowModel)以及同化的方法来提高研究区雪深反演的精度,重建研究区的雪深数据。结果表明:利用地面站观测雪深数据以及MODIS积雪面积比例数据较好地拟合了研究区的积雪衰减曲线;基于数据同化方法得到的雪深数据更接近地面观测雪深的“真值”;通过均方根误差以及相关系数的对比可知,同化雪深结果明显优于MODIS/被动微波融合雪深结果,而MODIS/被动微波融合雪深与地面台站雪深之间存在较大的偏差。
由于研究区复杂的地形条件以及有限的数据源,雪深重建方法存在一定的不确定性。例如,没有足够的地面观测数据来构建各种不同地形条件下的积雪衰减曲线,以提高积雪面积到雪深的转换精度;发展的MODIS积雪面积与被动微波雪深之间的经验融合算法,难以精确地表达复杂地形条件下的亚像元雪深;此外,研究区复杂的地形以及下垫面的高度异质性都会影响雪深同化过程中积雪过程模型的模拟精度。这些都是今后研究中应重点关注的问题。
致谢:感谢美国国家数据中心(NSIDC)和中国西部环境与生态科学数据中心(http: //westdc.westgis.ac.cn)对本研究所提供的数据支持。
The authors have declared that no competing interests exist.
| [24] |
Multiscale assimilation of advanced microwave scanning radiometer-EOS snow water equivalent and moderate resolution imaging spectroradiometer snow cover fraction observations in northern Colorado [J]. |
| [25] |
Peters-Lidard C D, Kumar S, et al. Assimilating satellite-based snow depth and snow cover products for improving snow predictions in Alaska [J]. |
| [26] |
The ensemble Kalman filter: Theoretical formulation and practical implementation [J].https://doi.org/10.1007/s10236-003-0036-9 Magsci [本文引用: 1] 摘要
<a name="Abs1"></a>The purpose of this paper is to provide a comprehensive presentation and interpretation of the Ensemble Kalman Filter (EnKF) and its numerical implementation. The EnKF has a large user group, and numerous publications have discussed applications and theoretical aspects of it. This paper reviews the important results from these studies and also presents new ideas and alternative interpretations which further explain the success of the EnKF. In addition to providing the theoretical framework needed for using the EnKF, there is also a focus on the algorithmic formulation and optimal numerical implementation. A program listing is given for some of the key subroutines. The paper also touches upon specific issues such as the use of nonlinear measurements, in situ profiles of temperature and salinity, and data which are available with high frequency in time. An ensemble based optimal interpolation (EnOI) scheme is presented as a cost-effective approach which may serve as an alternative to the EnKF in some applications. A fairly extensive discussion is devoted to the use of time correlated model errors and the estimation of model bias.
|
| [27] |
青藏高原MODIS积雪面积比例产品的精度验证与去云研究 [J].Accuracy validation and cloud obscuration removal of MODIS fractional snow cover products over Tibetan Plateau [J]. |
| [28] |
Dynamic downscaling of near-surface air temperature at the basin scale using WRF-a case study in the Heihe River Basin, China [J]. |
| [29] |
Validation of WRF model on simulating forcing data for Heihe River Basin [J].https://doi.org/10.3724/SP.J.1226.2011.00344 URL [本文引用: 2] 摘要
The research of coupling WRF (Weather Research and Forecasting Model) with a land surface model is enhanced to explore the interaction of the atmosphere and land surface; however,regional applicability of WRF model is questioned.In order to do the validation of WRF model on simulating forcing data for the Heihe River Basin,daily meteorological observation data from 15 stations of CMA (China Meteorological Administration) and hourly meteorological observation data from seven sites of WATER (Watershed Airbome Telemetry Experimental Research) are used to compare with WRF simulations,with a time range of a whole year for 2008.Results show that the average MBE (Mean Bias Error) of daily 2-m surface temperature,surface pressure,2-m relative humidity and 10-m wind speed were -0.19 ℃,-4.49 hPa,4.08% and 0.92 m/s,the average RMSE (Root Mean Square Error)of them were 2.11 ℃,5.37 hPa,9.55% and 1.73 m/s,and the average R (correlation coefficient) of them were 0.99,0.98,0.80 and 0.55,respectively.The average MBE of hourly 2-m surface temperature,surface pressure,2-m relative humidity,10-m wind speed,downward shortwave radiation and downward longwave were -0.16 ℃,-6.62 hPa,-5.14%,0.26 m/s,33.0 W/m2 and -6.44 W/m2,the average RMSE of them were 2.62 ℃,17.10 hPa,20.71%,2.46 m/s,152.9 W/m2 and 53.5 W/m2,and the average R of them were 0.96,0.97,0.70,0.26,0.91 and 0.60,respectively.Thus,the following conclusions were obtained:(1) regardless of daily or hourly validation,WRF model simulations of 2-m surface temperature,surface pressure and relative humidity are more reliable,especially for 2-m surface air temperature and surface pressure,the values of MBE were small and R were more than 0.96;(2) the WRF simulating downward shortwave radiation was relatively good,the average R between WRF simulation and hourly observation data was above 0.9,and the average R of downward longwave radiation was 0.6; (3) both wind speed and rainfall simulated from WRF model did not agree well with observation data.
|
| [30] |
A land cover-based snow cover representation for distributed hydrologic models [J].https://doi.org/10.1029/94WR02973 URL [本文引用: 2] 摘要
A snow cover depletion curve (SDC) summarizes the relationship between snow cover distribution and an average snow cover property, such as depth or water equivalent, for a given area. Snow cover depletion curves have been developed for, and applied in, hydrological models on a watershed or elevation zone basis. However, land cover-;based SDCs are not prominent in the literature. For this study the areal distribution of snow cover for dominant land cover units was measured during the winters of 1991 and 1992 in the Laurel Creek watershed in southern Ontario, Canada. On the basis of these data a general model for land cover-;based SDCs is developed for these land cover units, namely, short grass, ploughed fields, and deciduous forests. This model is derived from the three-parameter lognormal distribution, which is shown to characterize the areal depletion curves of the land cover units studied. The SDCs based on this new model provide a formal distributed snow cover representation that can be used in vegetation-based distributed hydrological models requiring accurate spatial representations of snow cover attributes.
|
| [31] |
A distributed snow-evolution modeling system (SnowModel) [J]. |
| [32] |
Sequential data assimilation with a nonlinear quasi-geostrophic model using Monte Carlo methods to forecast error statistics [J].https://doi.org/10.1029/94JC00572 URL [本文引用: 1] 摘要
A new sequential data assimilation method is discussed. It is based on forecasting the error statistics using Monte Carlo methods, a better alternative than solving the traditional and computationally extremely demanding approximate error covariance equation used in the extended Kalman filter. The unbounded error growth found in the extended Kalman filter, which is caused by an overly simplified closure in the error covariance equation, is completely eliminated. Open boundaries can be handled as long as the ocean model is well posed. Well-known numerical instabilities associated with the error covariance equation are avoided because storage and evolution of the error covariance matrix itself are not needed. The results are also better than what is provided by the extended Kalman filter since there is no closure problem and the quality of the forecast error statistics therefore improves. The method should be feasible also for more sophisticated primitive equation models. The computational load for reasonable accuracy is only a fraction of what is required for the extended Kalman filter and is given by the storage of, say, 100 model states for an ensemble size of 100 and thus CPU requirements of the order of the cost of 100 model integrations. The proposed method can therefore be used with realistic nonlinear ocean models on large domains on existing computers, and it is also well suited for parallel computers and clusters of workstations where each processor integrates a few members of the ensemble.
|
| [33] |
Van Leeuwen P J, Evensen G. Analysis scheme in the ensemble Kalman filter [J]. |
| [34] |
|
| [1] |
|
| [2] |
Quantifying the uncertainty in passive microwave snow water equivalent observations [J].https://doi.org/10.1016/j.rse.2004.09.012 URL [本文引用: 1] 摘要
This study uses a novel approach to quantify these errors by taking into account various factors that impact passive microwave responses from snow in various climatic/geographic regions. Among these factors are vegetation cover (particularly forest cover), snow morphology (crystal size), and errors related to brightness temperature calibration. A time-evolving retrieval algorithm that considers the evolution of snow crystals is formulated. An error model is developed based on the standard error estimation theory. This new algorithm and error estimation method is applied to the passive microwave data from Special Sensor Microwave/Imager (SSM/I) during the 1990鈥1991 snow season to produce annotated error maps for North America. The algorithm has been validated for seven snow seasons (from 1988 to 1995) in taiga, tundra, alpine, prairie, and maritime regions of Canada using in situ SWE data from the Meteorological Service of Canada (MSC) and satellite passive microwave observations. An ongoing study is applying this methodology to passive microwave measurements from Scanning Multichannel Microwave Radiometer (SMMR); future study will further refine and extend the analysis globally, and produce an improved SWE dataset of more than 25 years in length by combining SSMR and SSM/I measurements.
|
| [3] |
Observed impact of snow cover on the heat-balance and the rise of continental spring temperatures [J].https://doi.org/10.1126/science.263.5144.198 URL PMID: 17839175 [本文引用: 1] 摘要
Analysis of satellite-derived snow cover, radiative balance, and surface air temperature over Northern Hemisphere extratropical land shows that the retreat of the Northern Hemisphere's extent of spring snow cover over the past 20 years parallels a change in the influence of snow cover on the radiative balance and an observed increase of spring temperatures over the same area. These results help explain why the long-term (20th century) increase in surface air temperature over Northern Hemisphere land has been greater in spring than in any other season relative to the interannual variability.
|
| [4] |
MODIS/Terra observed snow cover over the Tibet Plateau: distribution, variation and possible connection with the East Asian Summer Monsoon (EASM) [J]. |
| [5] |
Moore G W K. On the relationship between Tibetan snow cover, the Tibetan plateau monsoon and the Indian summer monsoon [J]. |
| [6] |
Relationship between the Tibetan snow in spring and the East Asian summer monsoon in 2003: a global and regional modeling study [J].https://doi.org/10.1175/2008JCLI2496.1 URL 摘要
In 2003, a climate extreme accompanying a wet and cool summer over East Asia was recorded over the East Asian countries including central China, Korea, and Japan. A possible relation of this record-breaking summer in East Asia to above-normal snowfall over the Tibetan Plateau in spring has been investigated using the National Centers for Environmental Prediction (NCEP) global and regional model...
|
| [7] |
Bierkens M F P. Seasonal prediction of monsoon rainfall in three Asian river basins: the importance of snow cover on the Tibetan Plateau [J]. |
| [8] |
Spatiotemporal distribution of snow in eastern Tibet and the response to climate change [J].https://doi.org/10.1016/j.rse.2012.01.006 URL [本文引用: 1] 摘要
The spatial and temporal distribution of snow and its response to changes in climate were investigated from 1979 to 2005 in eastern Tibet. The Lhasa River basin, Niyang River basin and Changdu region cover an area of approximately 15×10 4 km 2 and ranges in elevation from 2000 to more than 7000m. This large area necessitates innovative procedures for estimating potential spatial and temporal changes in snow cover. For this analysis we used the microwave long-term snow cover dataset of China with a spatial resolution of 25km and temporal resolution of 1day. After data validation between the microwave dataset and MODIS snow product, we defined two parameters for each pixel: (1) median date of the snow-free period ( T m ); and (2) duration of the snow-free period (Δ T ). After removing transient-snow dominated areas, we find that the duration of the snow-free period was inversely correlated with elevation (R=610.651, p <0.001). TFPW-MK (Trend-free pre-whitening Mann–Kendall) was then used to examine and highlight the trend of Δ T with time. At lower-elevation sites, the length of the snow-free season increased. In contrast, at higher-elevations, it decreased. Mann–Kendall tests on monthly air temperature and annual precipitation for the period 1979 to 2005 from seven climate stations in the region operated by the China Meteorological Data Sharing Service System show a significant increase in annual precipitation and an increase in monthly air temperatures for the fall through spring months. Thus, the length of the snow covered season appears to be decreasing at lower elevation because of the increase in air temperatures. However, at higher elevations the increase in precipitation appears to compensate for the increase in air temperature such that the snow-free period has decreased.
|
| [9] |
Spatiotemporal changes of snow cover over the Tibetan plateau based on cloud-removed moderate resolution imaging spectroradiometer fractional snow cover product from 2001 to 2011 [J]. |
| [10] |
Development of methods for mapping global snow cover using moderate resolution imaging spectroradiometer data [J].https://doi.org/10.1016/0034-4257(95)00137-P URL [本文引用: 1] 摘要
An algorithm is being developed to map global snow cover using Earth Observing System (EOS) Moderate Resolution Imaging Spectroradiometer (MODIS) data beginning at launch in 1998. As currently planned, digital maps will be produced that will provide daily, and perhaps maximum weekly, global snow cover at 500-m spatial resolution. Statistics will be generated on the extent and persistence of snow cover in each pixel for each weekly map, cloud cover permitting. It will also be possible to generate snow-cover maps at 250-m spatial resolution using MODIS data, and to study snow-cover characteristics. Preliminary validation activities of the prototype version of our snow-mapping algorithm, SNOMAP, have been undertaken. SNOMAP will use criteria tests and a decision rule to identify snow in each 500-m MODIS pixel. Use of SNOMAP on a previously mapped Landsat Thematic Mapper (TM) scene of the Sierra Nevadas has shown that SNOMAP is 98 % accurate in identifying snow in pixels that are snow covered by 60% or more. Results of a comparison of a SNOMAP classification with a supervised-classification technique on six other TM scenes show that SNOMAP and supervised-classification techniques agree to within about 11 % or less for nearly cloud-free scenes and that SNOMAP provided more consistent results. About 10 % of the snow cover, known to be present on the 14 March 1991 TM scene covering Glacier National Park in northern Montana, is obscured by dense forest cover. Mapping snow cover in areas of dense forests is a limitation in the use of this procedure for global snow-cover mapping. This limitation, and sources of error will be assessed globally as SNOMAP is refined and tested before and following the launch of MODIS.
|
| [11] |
Estimating fractional snow cover from MODIS using the normalized difference snow index [J].https://doi.org/10.1016/j.rse.2003.10.016 URL [本文引用: 1] 摘要
Snow-cover information is important for a wide variety of scientific studies, water supply and management applications. The NASA Earth Observing System (EOS) Moderate Resolution Imaging Spectroradiometer (MODIS) provides improved capabilities to observe snow cover from space and has been successfully using a normalized difference snow index (NDSI), along with threshold tests, to provide global, automated binary maps of snow cover. The NDSI is a spectral band ratio that takes advantage of the spectral differences of snow in short-wave infrared and visible MODIS spectral bands to identify snow versus other features in a scene. This study has evaluated whether there is a “signal” in the NDSI that could be used to estimate the fraction of snow within a 500 m MODIS pixel and thereby enhance the use of the NDSI approach in monitoring snow cover. Using Landsat 30-m observations as “ground truth,” the percentage of snow cover was calculated for 500-m cells. Then a regression relationship between 500-m NDSI observations and fractional snow cover was developed over three different snow-covered regions and tested over other areas. The overall results indicate that the relationship between fractional snow cover and NDSI is reasonably robust when applied locally and over large areas like North America. The relationship offers advantages relative to other published fractional snow cover algorithms developed for global-scale use with MODIS. This study indicates that the fraction of snow cover within a MODIS pixel using this approach can be provided with a mean absolute error less than 0.1 over the range from 0.0 to 1.0 in fractional snow cover.
|
| [12] |
Riggs G, Hall D, Salomonson V. MODIS snow products user guide to collection 5 [EB/OL]. . |
| [13] |
Snow water equivalent estimation by microwave radiometry [J].https://doi.org/10.1016/0165-232X(82)90019-2 URL [本文引用: 1] 摘要
Calculations made from a microscopic scattering model are used to simulate the effect of varying SWE on the microwave brightness temperature. Data obtained from truck mounted, airborne and spaceborne systems from various tests sites have been studied. The simulated SWE compares favorably with the measured SWE for dry snowpacks. In addition, whether or not the underlying soil is frozen or thawed may be discriminated using the polarization information obtained by spaceborne sensors.
|
| [14] |
Hemispheric-scale comparison and evaluation of passive-microwave snow algorithms [J].https://doi.org/10.3189/172756402781817428 URL 摘要
Passive-microwave satellite remote sensing can greatly enhance large-scale snow measurements based on visible satellite data alone because of the ability to acquire data through most clouds or during darkness as well as to provide a measure of snow depth or water equivalent. This study provides preliminary results from the comparison and evaluation of several different passive-microwave algorithms. These algorithms represent examples which include both mid- and high-frequency channels, vertical and horizontal polarizations and polarization-difference approaches. In our comparisons we utilize larger, more comprehensive, validation datasets which can be expected to provide a full range of snow/climate conditions rather than limited data which may only represent a "snapshot" in time and space. Evaluation of snow extent derived from passive-microwave data is undertaken through comparison with the U.S. National Oceanic and Atmospheric Administration (NOAA) Northern Hemisphere snow charts which are based on visible-band satellite data. Results clearly indicate those time periods and geographic regions where the two techniques agree and where they tend to consistently disagree. Validation of snow water equivalent derived from passive-microwave data is undertaken using measurements from snow-course transects in the former Soviet Union. Preliminary results indicate a general tendency for nearly all of the algorithms to underestimate snow water equivalent.
|
| [15] |
利用被动微波遥感数据反演我国积雪深度及其精度评价 [J].
<p>考虑到我国西部地区使用SSM/I全球算法将高估积雪深度,故以东经105°为界将我国分为东部和西部。在西部地区采用修正后的雪深算法,东部地区沿用全球算法。对散射系数较高,容易和积雪相混淆的降雨、寒漠和冻土地表类型,通过积雪分类树进行剔除,进而发展了一套适用于全国积雪深度的业务化反演方案。最后利用MODIS积雪产品对冬季90天的结果进行了精度评价,总体精度平均达到86.4%,最高精度达到95.5%,Kappa系数均值为65.5%,最大值达到86.2%。</p>
Retrieval of snow depth in china by passive microwave remote sensing data and its accuracy assessment [J].
<p>考虑到我国西部地区使用SSM/I全球算法将高估积雪深度,故以东经105°为界将我国分为东部和西部。在西部地区采用修正后的雪深算法,东部地区沿用全球算法。对散射系数较高,容易和积雪相混淆的降雨、寒漠和冻土地表类型,通过积雪分类树进行剔除,进而发展了一套适用于全国积雪深度的业务化反演方案。最后利用MODIS积雪产品对冬季90天的结果进行了精度评价,总体精度平均达到86.4%,最高精度达到95.5%,Kappa系数均值为65.5%,最大值达到86.2%。</p>
|
| [16] |
青藏高原积雪深度和雪水当量的被动微波遥感反演 [J].
利用1993年1月份的SSM/I亮度温度数据反演了青藏高原的雪水当量,首先使用被动微波SSM/I数据19和37GHz的水平极化数据来反演雪深,根据积雪时间的函数来计算实时的雪密度,由雪的深度和密度计算出雪水当量.最后,利用SSM/I数据的19和37GHz的垂直极化亮度温度梯度对计算出的雪水当量进行回归分析,得到了利用SSM/I数据直接反演雪水当量的算法.
Estimation of snow water equivalent in the Tibetan Plateau using passive microwave remote sensing data [J].
利用1993年1月份的SSM/I亮度温度数据反演了青藏高原的雪水当量,首先使用被动微波SSM/I数据19和37GHz的水平极化数据来反演雪深,根据积雪时间的函数来计算实时的雪密度,由雪的深度和密度计算出雪水当量.最后,利用SSM/I数据的19和37GHz的垂直极化亮度温度梯度对计算出的雪水当量进行回归分析,得到了利用SSM/I数据直接反演雪水当量的算法.
|
| [17] |
积雪属性非均匀性对被动微波遥感积雪的影响 [J].
<p>积雪属性的非均匀性在水平方向上表现为像元内积雪未完全覆盖和雪深分布的不均匀,在垂直方向上表现为积雪剖面上粒径和密度的不一致导致的积雪分层现象。这些积雪属性的非均匀性对被动微波遥感反演雪深或雪水当量带来很大的不确定性,并且给反演结果的验证带来不确定性。通过野外积雪的微波辐射特性观测、遥感积雪产品对比分析、积雪辐射传输模型模拟对这些问题进行阐述和探讨,为今后积雪微波遥感反演算法发展和结果验证提供参考。</p>
Impacts on passive microwave remote sensing of snow from heterogeneities of snow properties [J].
<p>积雪属性的非均匀性在水平方向上表现为像元内积雪未完全覆盖和雪深分布的不均匀,在垂直方向上表现为积雪剖面上粒径和密度的不一致导致的积雪分层现象。这些积雪属性的非均匀性对被动微波遥感反演雪深或雪水当量带来很大的不确定性,并且给反演结果的验证带来不确定性。通过野外积雪的微波辐射特性观测、遥感积雪产品对比分析、积雪辐射传输模型模拟对这些问题进行阐述和探讨,为今后积雪微波遥感反演算法发展和结果验证提供参考。</p>
|
| [18] |
A review of global satellite-derived snow products [J].https://doi.org/10.1016/j.asr.2011.12.021 URL [本文引用: 1] 摘要
Snow cover over the Northern Hemisphere plays a crucial role in the Earth’s hydrology and surface energy balance, and modulates feedbacks that control variations of global climate. While many of these variations are associated with exchanges of energy and mass between the land surface and the atmosphere, other expected changes are likely to propagate downstream and affect oceanic processes in coastal zones. For example, a large component of the freshwater flux into the Arctic Ocean comes from snow melt. The timing and magnitude of this flux affects biological and thermodynamic processes in the Arctic Ocean, and potentially across the globe through their impact on North Atlantic Deep Water formation.Several recent global remotely sensed products provide information at unprecedented temporal, spatial, and spectral resolutions. In this article we review the theoretical underpinnings and characteristics of three key products. We also demonstrate the seasonal and spatial patterns of agreement and disagreement amongst them, and discuss current and future directions in their application and development. Though there is general agreement amongst these products, there can be disagreement over certain geographic regions and under conditions of ephemeral, patchy and melting snow.
|
| [19] |
积雪水文模拟中的关键问题及其研究进展 [J].https://doi.org/10.7522/j.issn.1000-0240.2013.0051 Magsci [本文引用: 2] 摘要
<p>针对近年来积雪水文模拟研究的发展趋势, 在简要评述积雪模拟基本方法的基础上, 分别就各类方法的不同着眼点展开讨论, 从模拟方案的简繁、 积雪面积等重要状态变量在模型中如何体现等角度进行了叙述.针对我国青藏高原积雪特征, 提炼出现阶段空间分布式积雪水文模拟中的3个关键问题: 网格尺度积雪空间异质性的模拟、 风吹雪的空间参数化、 季节性冻土下垫面的融雪模拟. 分别就这些问题, 回溯了国内外最新研究进展, 强调了发展积雪衰减曲线在网格尺度积雪模拟中的重要性, 讨论了山区环境中具有操作性的风吹雪空间参数化方案, 分析了冻土下垫面融雪研究存在的一些具体问题.</p>
Key research topics and their advances on modeling snow hydrological processes [J].https://doi.org/10.7522/j.issn.1000-0240.2013.0051 Magsci [本文引用: 2] 摘要
<p>针对近年来积雪水文模拟研究的发展趋势, 在简要评述积雪模拟基本方法的基础上, 分别就各类方法的不同着眼点展开讨论, 从模拟方案的简繁、 积雪面积等重要状态变量在模型中如何体现等角度进行了叙述.针对我国青藏高原积雪特征, 提炼出现阶段空间分布式积雪水文模拟中的3个关键问题: 网格尺度积雪空间异质性的模拟、 风吹雪的空间参数化、 季节性冻土下垫面的融雪模拟. 分别就这些问题, 回溯了国内外最新研究进展, 强调了发展积雪衰减曲线在网格尺度积雪模拟中的重要性, 讨论了山区环境中具有操作性的风吹雪空间参数化方案, 分析了冻土下垫面融雪研究存在的一些具体问题.</p>
|
| [20] |
Assimilation of snow covered area information into hydrologic and land-surface models [J].https://doi.org/10.1016/j.advwatres.2005.10.001 Magsci [本文引用: 2] 摘要
<h2 class="secHeading" id="section_abstract">Abstract</h2><p id="">This paper describes a data assimilation method that uses observations of snow covered area (SCA) to update hydrologic model states in a mountainous catchment in Colorado. The assimilation method uses SCA information as part of an ensemble Kalman filter to alter the sub-basin distribution of snow as well as the basin water balance. This method permits an optimal combination of model simulations and observations, as well as propagation of information across model states. Sensitivity experiments are conducted with a fairly simple snowpack/water-balance model to evaluate effects of the data assimilation scheme on simulations of streamflow. The assimilation of SCA information results in minor improvements in the accuracy of streamflow simulations near the end of the snowmelt season. The small effect from SCA assimilation is initially surprising. It can be explained both because a substantial portion of snowmelts before any bare ground is exposed, and because the transition from 100% to 0% snow coverage occurs fairly quickly. Both of these factors are basin-dependent. Satellite SCA information is expected to be most useful in basins where snow cover is ephemeral. The data assimilation strategy presented in this study improved the accuracy of the streamflow simulation, indicating that SCA is a useful source of independent information that can be used as part of an integrated data assimilation strategy.</p>
|
| [21] |
Enhancing the estimation of continental-scale snow water equivalent by assimilating MODIS snow cover with the ensemble Kalman filter [J]. |
| [22] |
Assimilating remotely sensed snow observations into a macroscale hydrology model [J].https://doi.org/10.1016/j.advwatres.2005.08.004 Magsci [本文引用: 1] 摘要
<h2 class="secHeading" id="section_abstract">Abstract</h2><p id="">Accurate forecasting of snow properties is important for effective water resources management, especially in mountainous areas like the western United States. Current model-based forecasting approaches are limited by model biases and input data uncertainties. Remote sensing offers an opportunity for observation of snow properties, like areal extent and water equivalent, over larger areas. Data assimilation provides a framework for optimally merging information from remotely sensed observations and hydrologic model predictions. An ensemble Kalman filter (EnKF) was used to assimilate remotely sensed snow observations into the variable infiltration capacity (VIC) macroscale hydrologic model over the Snake River basin. The snow cover extent (SCE) product from the moderate resolution imaging spectroradiometer (MODIS) flown on the NASA Terra satellite was used to update VIC snow water equivalent (SWE), for a period of four consecutive winters (1999–2003). A simple snow depletion curve model was used for the necessary SWE–SCE inversion. The results showed that the EnKF is an effective and operationally feasible solution; the filter successfully updated model SCE predictions to better agree with the MODIS observations and ground surface measurements. Comparisons of the VIC SWE estimates following updating with surface SWE observations (from the NRCS SNOTEL network) indicated that the filter performance was a modest improvement over the open-loop (un-updated) simulations. This improvement was more evident for lower to middle elevations, and during snowmelt, while during accumulation the filter and open-loop estimates were very close on average. Subsequently, a preliminary assessment of the potential for assimilating the SWE product from the advanced microwave scanning radiometer (AMSR-E, flown on board the NASA Aqua satellite) was conducted. The results were not encouraging, and appeared to reflect large errors in the AMSR-E SWE product, which were also apparent in comparisons with SNOTEL data.</p>
|
| [23] |
Scanning multichannel microwave radiometer snow water equivalent assimilation [J].https://doi.org/10.1029/2006JD007209 URL [本文引用: 1] 摘要
ABSTRACT 1] Accurate prediction of snowpack status is important for a range of environmental applications, yet model estimates are typically poor and in situ measurement coverage is inadequate. Moreover, remote sensing estimates are spatially and temporally limited due to complicating effects, including distance to open water, presence of wet snow, and presence of thick snow. However, through assimilation of remote sensing estimates into a land surface model, it is possible to capitalize on the strengths of both approaches. In order to achieve this, reliable estimates of the uncertainty in both remotely sensed and model simulated snow water equivalent (SWE) estimates are critical. For practical application, the remotely sensed SWE retrieval error is prescribed with a spatially constant but monthly varying value, with data omitted for (1) locations closer than 200 km to significant open water, (2) times and locations with model-predicted presence of liquid water in the snowpack, and (3) model SWE estimates greater than 100 mm. The model error is estimated using standard error propagation with a calibrated spatially and temporally constant model error contribution. A series of tests have been performed to assess the assimilation algorithm performance. Multiyear model simulations with and without remotely sensed SWE assimilation are presented and evaluated with in situ SWE observations. The SWE estimates from assimilation were found to be superior to both the model simulation and remotely sensed estimates alone, except when model SWE estimates rapidly and erroneously crossed the 100-mm SWE cutoff early in the snow season.
|
| [34] |
|

/
| 〈 |
|
〉 |