杨俊 , 孙静
, 孙静
YANG Jun, SUN Jing
通讯作者:
收稿日期: 2015-12-10
修回日期: 2016-06-14
网络出版日期: 2016-08-10
版权声明: 2016 《地球信息科学学报》编辑部 《地球信息科学学报》编辑部 所有
基金资助:
作者简介:
作者简介:杨 俊(1978-),男,湖北孝昌人,博士后,副教授,主要从事区域地表过程、土地利用变化模拟研究。E-mail:yangjun@lnnu.edu.cn
展开
摘要
本文选择大连市沙河口和西岗区为研究区,以Landsat ETM、SPOT等数据为基础,通过遥感解译和反演得到1999年和2013年研究区内绿地及地表温度空间分布及演变特征,结合温度-植被指数(TVX)空间分析法测度城区发展过程中绿色空间减退所引起的热环境效应,以提出更有针对性的城市气候变化适应性规划。研究结果表明:(1)1999-2013年,研究区绿地面积减少43.8%,绿地斑块增加42.9%,城市绿地呈现面积减少、空间分布碎化的演变特征。其中,森林绿地、公园绿地和街区绿地转化为建设用地的贡献率分别为43.8%、42.9%和13.3%,街区绿地因原始面积小且转化率高,被建设用地侵占最为严重。(2)1999-2013年,研究区地表温度最高值上升5.2 K,地表温差增加1.7 K,地温聚集区间由301.6 ~304.7 K上升至306.5~310.9 K,热环境效应加剧。(3)TVX模型追踪结果显示,快速城市化过程中研究区内城市绿地转化为建设用地引起植被覆盖度下降和地表温度上升,其中街区绿地被侵占造成的地表热环境效应大于公园绿地和森林绿地。
关键词:
Abstract
Shahekou and Xigang District of Dalian was the subject of this study. Based on remote sensing images of SPOT5 and ETM7 sensors, we obtained the spatial pattern and evolution characteristics of green space and surface temperature in this area from 1999 to 2013 by remote sensing interpretation and inversion. This work adopted the TVX Model to accurately measure evolution of green space and thermal environmental effects in order to put forward a more targeted climate change adaptation planning for urban. The results showed that: (1) in 1999-2013, the greenbelt area decreased 43.8% and greenbelt patch increased 42.86%. The urban green space has evolution characteristic of decreasing area and the spatial distribution fragmentation. The contribution of forest green land, park green land and neighborhood green land transformation into construction is 43.8%, 42.9% and 13.3%, respectively. The occupation of neighborhood green land for construction is the most serious because the original neighborhood green land area is small and the conversion rate high; (2) in 1999-2013, the highest rise of surface temperature is 5.2 K and the surface temperature difference increased 1.7 K. The geothermal aggregation interval increased from 301.6~304.7 K to 306.5~310.9 K and the thermal environmental effects deteriorated. (3) During the period studied, the landscape of land cover and land surface temperature changed significantly. TVX model tracking results indicated that urban green space transformation into urban construction land caused vegetation coverage decreased and surface temperature raised due to the rapid urbanization. Neighborhood green land encroachment caused more serious surface thermal environmental effects than park and forest green land.
Keywords:
绿地是城市的基础性要素之一,是城市内部唯一具有自然或者半自然状态的土地利用形式,在城市生态环境保护方面有突出作用[1]。城市绿色空 间[2]正逐渐引起城市生态学、城市地理学等相关学者的关注,成为继城市经济空间、城市社会空间之外的另一城市空间研究热点。地理学在广泛吸收其他学科成果的基础上,主要从空间布局的角度分析城市绿色空间的分布特征及社会、经济和生态功能。近年来,快速的城市化进程使城市下垫面状况发生很大改变,城市绿地逐渐减少,城市生态环境问题凸显,反映了城市化对区域气候的负面影响,其中城市热环境效应[3]成为最明显的城市生态环境问题之一。
国外关于城市热环境效应的监测已有200多年历史,Howard[4]对伦敦市及其郊区所做的气温观察记录被认为是最早关于城市热环境效应的记载。1958年,由Manley[5]首次在论文中正式提出城市热岛(Urban Heat Island,UHI)这个概念并引起关注。从此,城市热环境效应开始了大量实证性的研究,这个阶段大多采用大气温度观测数据对城市热环境效应进行描述和研究,所研究的内容多为城市区域的大气热岛现象。随着卫星遥感技术的发展,遥感数据反演所得的地表的辐射温度能够大面积覆盖地表,具有较高的空间分辨率和空间连续性,其宏观、快速、动态的特点使其成为城市热环境效应研究的科学技术平台。Rao率先应用卫星遥感资料对太平洋中部海岸城市的地表温度进行观测和分析并研究城市热环境特征[6]。Gallo[7]首次指出植被指数和城市热环境之间存在明显的负相关性,之后Rotem-Mindali、Feyisa、Declet-Barreto等人的研究相继证实了城市绿地对城市热岛的缓解作用,而绿地的降温效果主要取决于种群、郁闭度、分布面积和格局等因素[8-9]。城市绿地的热环境调节作用逐渐成为学者研究的焦点和热点,相关研究以城市绿地公园的降温作用居多。
国内关于城市热环境效应的研究起步略晚于西方国家,研究成果大多集中在城市化迅速的城市和地区。周淑贞[10]以20世纪50年代至80年代的气象观测数据研究上海市热效应的日变化规律、年变化规律以及年际变化规律,奠定了国内城市热环境效应研究的基础。匡文慧[11]等学者从土地利用角度揭示城市热环境效应的影响机理和作用强度、指出多因素共同作用于城市热效应的发展和演变,并强调城市植被对城市热环境效应的缓解作用。陈云浩[12]等景观学者将景观生态学理论融入到城市热环境效应研究中,探索城市热环境与城市空间结构、城市规模发展变化的关系以及城市绿地、公 园[13]在小区域尺度上的热环境效应缓解作用。城市化与热效应相结合的研究[14-15]正逐渐引起重视,研究方向多集中在城市化过程中城市面积增长与城市热岛同步性,城市绿色空间演变与城市热环境作用关系的研究还未形成成熟的研究体系。
以上大量国内外研究可看出,利用卫星遥感资料,结合单通道法、劈窗法、多通道法等算法反演地表温度[16],分析城市热环境效应特征并提出缓解对策是目前城市热环境效应研究的主要流程[17-18]。研究视角从单纯对城市热环境的描述性研究逐步发展为定量化、机理性的研究,并逐渐将RS[19]、GIS技术、景观学理论[20]和生态学理论[21]等学科研究方法运用到城市热环境效应的研究中。城市热环境效应的研究区域大多以城市及周边乡村为对象,采用中小尺度进行研究[22]。本文结合RS、GIS技术,采用单窗算法反演地表温度,以城市内生演变为切入点,依据温度-植被指数(TVX)模型分析城市化对植被覆盖度和地表温度的影响,研究TVX 空间中绿地像元格局与城市地表温度之间的作用关系,分析城市化背景下城市绿地演变引起的生态环境效应,以提出更有针对性的城市气候变化适应性规划、合理配置城市绿地资源,使热环境效应的研究由理论面向解决城市发展存在的实际问题。
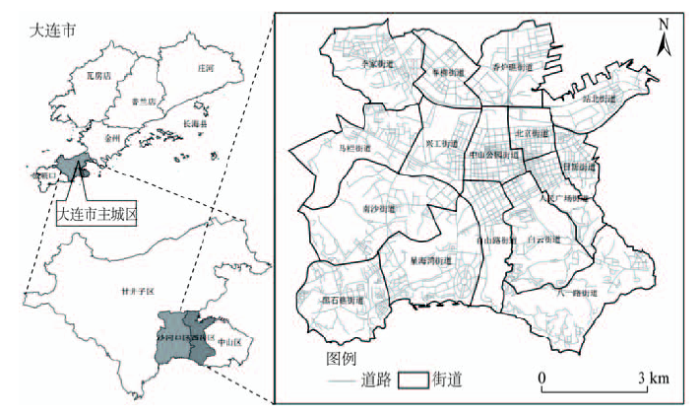
大连市位于北半球的暖温带地区(120°58′~123°31′E, 38°43′~40°10′N),地处辽东半岛南端,黄渤海之滨,背依中国东北腹地,区内山地丘陵多,平原低地少,具有海洋性特点的暖温带大陆性季风气候,冬无严寒,夏无酷暑,四季分明。大连市主城区包括市沙河口、西岗、中山和甘井子4个区,主城区中沙河口和西岗2个区面积共74.9 km2(图1),20世纪90年代以来,该城市发展迅速,其绿地空间及热环境演变研究具有代表性。
原始数据为Landsat7 ETM数据和SPOT5遥感影像(表1),参考数据为研究区城市规划及气候气象统计资料等。ETM影像条带号为120、33,质量较好,云量值低。以同期MOD07产品参照气象观测数据经ArcGIS软件空间插值获取研究区温度和湿度数据。MODIS大气温度、湿度廓线产品(MOD07)能够提供各个气压层的温度和湿度大气参数,气温廓线的地面大气温度平均反演误差较小,可基于地面水汽压和大气可降水量的经验关系估算出该地区的相对湿度[23-24]。将大连市区域内由MOD07上的取值点和大连市气象测站点的数据相结合,在ArcGIS软件中进行空间插值,得到研究区气温和湿度的空间数据。
表1 数据来源与说明
Tab. 1 Data sources and description
| 时间 | 数据类型 | 分辨率 | 来源 |
|---|---|---|---|
| 1999-08-19 | Landsat7 ETM | 30 m | 地理空间数据云 |
| Landsat7 ETM | 30 m | 地理空间数据云 | |
| MOD07 大气廓线产品 | 5 km | NASA 网站下载 | |
| 2013-08-29 | Landsat7 ETM | 30 m | 地理空间数据云 |
| SPOT5 | 10 m | 国家海洋监测中心 | |
| MOD07 大气廓线产品 | 5 km | NASA 网站下载 |
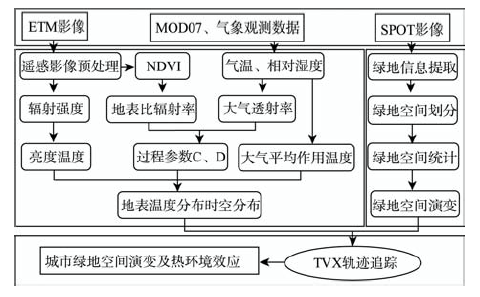
城市绿地空间演变及热环境效应主要分为3部分:(1)以空间叠置与转置分析方法研究城市绿地空间演变特征;(2)以地表温度分布及演变特征研究城市热环境效应;(3)以TVX空间轨迹追踪法研究城市发展中绿色空间演变引起的热环境效应机理。具体研究流程如图2所示。
本研究运用ArcGIS软件进行空间叠置与转置分析,得到城市绿地与其他土地利用类型之间的转换情况,反映2个时期各种土地类型面积变化、转移去向比率以及转移后贡献率等情况,转移矩阵公式为式(11)。
式中:S为土地类型面积;n为土地利用的类型数;i、 j分别为研究初期和末期的土地利用类型序号。
选取我国著名学者覃志豪提出的单窗算法[25],以地表辐射率、大气透射率、亮温温度和大气平均温度等参数进行地表温度的演算具体公式为式(2)-(4)。其优势在于参数易确定、应用广泛且演算精度高,能够较准确地反映区域地表热量空间分布状态。
式中:
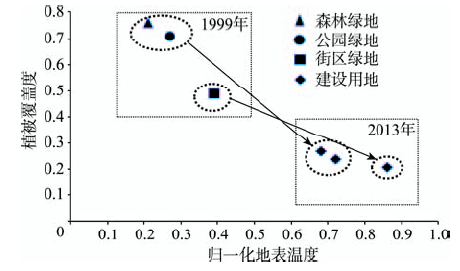
TVX空间模型以土地利用/覆盖类型为基本分析单元,将像元地表温度与植被指数绘制在散点图中,研究其聚类点在TVX空间中的运动轨迹,以追踪城市化对地表温度和植被覆盖度的影响,为城市化进程中生态格局的现状及其演变趋势提供相应的环境响应结果[27]。具体地,以归一化地表温度为横坐标、植被覆盖度为纵坐标构建TVX空间,提取研究时间段内由森林绿地、公园绿地、街区绿地转化为建设用地的聚类点,取各土地利用类型聚类点的初始和终点时期的平均值,绘制其在TVX空间中的运动轨迹[28]。该轨迹路径的幅度用以反映地表信息改变所引起的热环境效应强度,更直观地显示城市发展导致的环境效应。
1999-2013年研究区城市绿地空间演变定量分析结果表明:绿地空间分布变化明显,绿地面积缩减的同时,其空间分布也呈分散化、破碎化趋势(表3)。绿地斑块总数量由4232个增加到6046个,增量为1814个;绿地面积由25.6 km2减少到14.4 km2,减量为43.8%。其空间转化率的特征为新增建设用地主要由森林绿地和公园绿地转化而来,森林绿地、公园绿地和街区绿地转化为建设用地的总贡献率分别为43.8%、42.9%和13.3%。虽然街区绿地转化面积小于森林绿地和公园绿地,但其原始面积小、转化率高,被建设用地侵占程度最为严重。
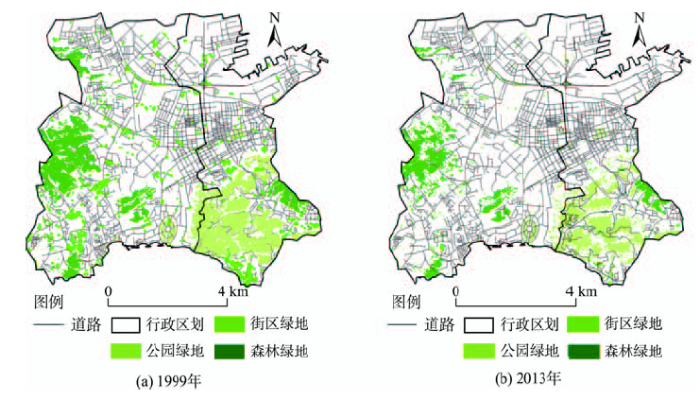
从研究区绿地空间组成和分布的演变过程来看,1999-2013年公园绿地主要分布在研究区东南角,沿道路分布呈现退减趋势(图3)。森林绿地主要分布在研究区西侧,随着建设用地扩张,面积减少严重。街区绿地原多在研究区内道路两侧分布,随城市化发展,研究区北侧街区绿地面积减少、破碎化严重,呈现分散的态势。
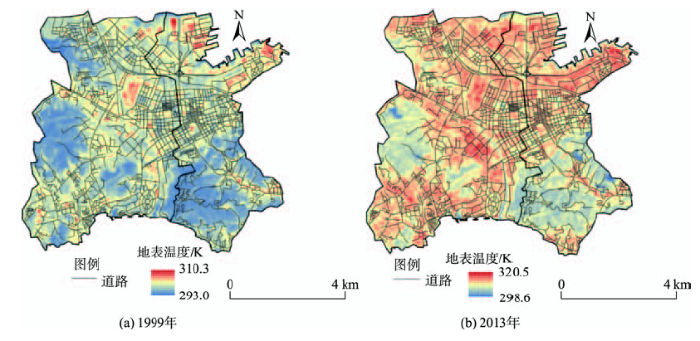
研究区1999、2013年地表温度最低值分别为295.1 K、298.6 K,最高温度分别为310.3K、315.5K,同期地表温度差分别为15.2K、16.9K,地表温度集中分布的区间由301.6~304.7 K上升至306.5~ 310.9 K,地表温度呈现上升趋势(图4)。经实测验证,单窗算法计算得到的地表温度与实测地表温度数据误差在5%以内,可以反映研究区地表温度的空间分布状态。从研究区地表温度空间分布的演变过程来看,1999年,研究区地表温度总体较低,部分地区低温优势明显,高温区面积少且分布零散。至2013年,地表温度上升较为显著,具体表现原低温优势减弱,高温面积增加且覆盖范围广。
表2 绿地空间斑块数量及面积
Tab. 2 The patch number and area of green space
| 森林绿地 | 公园绿地 | 街区绿地 | 合计 | |||||
|---|---|---|---|---|---|---|---|---|
| 斑块数 | 面积/km2 | 斑块数 | 面积/km2 | 斑块数 | 面积/km2 | 斑块数 | 面积/km2 | |
| 1999年 | 2489 | 9.6 | 901 | 12.4 | 842 | 3.6 | 4232 | 25.6 |
| 2013年 | 2806 | 4.7 | 1728 | 7.6 | 1512 | 2.1 | 6046 | 14.4 |
| 1999-2013年变化量 | 317 | -4.9 | 827 | -4.8 | 670 | -1.5 | 1814 | -11.2 |
1999年,城市绿地空间的森林绿地、公园绿地和街区绿地聚类点主要位于TVX空间的左上角,对应较高的植被覆盖度和较低的地表温度(图5)。在城市发展过程中,研究区内部分像元改变了原始特征,由地表温度较低的城市绿地转化为地表温度较高的建设用地,被占用的城市绿地空间土地利用类型均向空间右下角移动,到2013年像元终点对应较低的植被指数和较高的地表温度。像元的向量轨迹表明城市绿地转化为建设用地会引起地表温度升高,街区绿地被破坏所造成的地表热环境效应大于公园绿地和森林绿地。
图5 TVX空间及聚类点变化图(1999-2013年)
Fig. 5 The change trajectory of the TVX space and clustering pointfrom1999 to 2013
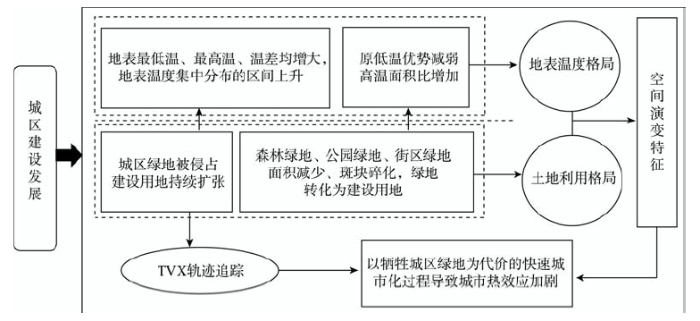
21世纪初是大连市城市化的加速发展阶段,改革开放20年来的经济发展,生产力水平提高,经济体制变化是加速城市化的强大推动力。在这种时代背景下,政府出台一系列加快推进城市化步伐的政策,使大连市城市化步入新阶段,大规模的扩建和改造使城市绿地减少、建设用地增加,引起土地利用和地表温度格局变化(图6)。
图6 绿地空间演变的热环境机理分析图
Fig. 6 The analysis of thermal environmental mechanism of green space evolution
本研究以大连市沙河口和西岗区为例,利用空间叠置与转置分析、地表温度反演及TVX轨迹追踪等方法,分析研究区快速城市化过程中绿地空间演变及热环境效应,研究结果表明:
(1)1999-2013年,研究区内43.8%的城市绿地转化其他土地利用类型,城市绿地呈现面积减少、空间分布碎化的演变特征。其中,街区绿地因原始面积小且转化率高,被建设用地侵占最为严重。同时,区内地表温度呈上升态势,地表温度差增大,热环境效应加剧。
(2)由TVX追踪结果显示,在快速的城市化建设过程中,研究区内具有生态环境保护与调节作用的城市绿地转化为建设用地,引起城市植被覆盖度下降和地表温度上升。其中,研究区内街区绿地被破坏所造成的地表热环境效应大于公园绿地和森林绿地。
(3)在研究期内,研究区尚未出现极端的高温气候,但地表高温值上升5.2 K,并呈现持续增长态势,使人居环境舒适度受到影响。因此,在城市化建设与发展过程中应该合理配置适应人居环境需要的生态空间,促进城市可持续发展。
空间异质性定量化研究存在尺度效应,遥感影像的解译和波段运算也存在一定误差,城市热环境效应机理还需要通过高精度、长时序、多时段数据的进一步论证和总结。今后,可从时间尺度和空间尺度入手,开展深入研究。
The authors have declared that no competing interests exist.
| [1] |
城市绿色空间研究内容与展望 [J].https://doi.org/10.11820/dlkxjz.2015.01.003 URL Magsci [本文引用: 1] 摘要
伴随社会经济快速发展,城市绿色空间对生态环境和宜居生活的作用逐渐受到关注。同时,随着城市建成区面积的不断扩大,城市绿色空间成为一种稀缺资源。不断减少的城市绿色空间,与城市人口的增加,以及其休闲健康功能需求的增长间形成了一种空间错位。如何合理规划绿色空间,发挥绿色空间的效用和功能,已成为城市地理学和城市规划实践中重要的研究内容。本文系统论述和梳理了城市绿色空间概念提出的背景和发展历程,并在此基础上综合分析不同学科对城市绿色空间的理解及研究成果,提出目前城市绿色空间的相关研究内容和进展;并对其研究趋势进行了分析,从城市规划建设、城市可持续发展、研究方法创新等方面提出了推动城市绿色空间相关研究的建议。
Progress and prospect on urban green space research [J].https://doi.org/10.11820/dlkxjz.2015.01.003 URL Magsci [本文引用: 1] 摘要
伴随社会经济快速发展,城市绿色空间对生态环境和宜居生活的作用逐渐受到关注。同时,随着城市建成区面积的不断扩大,城市绿色空间成为一种稀缺资源。不断减少的城市绿色空间,与城市人口的增加,以及其休闲健康功能需求的增长间形成了一种空间错位。如何合理规划绿色空间,发挥绿色空间的效用和功能,已成为城市地理学和城市规划实践中重要的研究内容。本文系统论述和梳理了城市绿色空间概念提出的背景和发展历程,并在此基础上综合分析不同学科对城市绿色空间的理解及研究成果,提出目前城市绿色空间的相关研究内容和进展;并对其研究趋势进行了分析,从城市规划建设、城市可持续发展、研究方法创新等方面提出了推动城市绿色空间相关研究的建议。
|
| [2] |
Measuring forest fragmentation using multitemporal forest cover maps: Forest loss and spatial pattern analysis in the Gran Chaco, central Argentina [J].https://doi.org/10.1016/j.landurbplan.2015.08.006 URL [本文引用: 1] 摘要
Forest fragmentation is a landscape-level process that consists of two interdependent components: forest loss and spatial pattern changes to which species respond differently. Efficient programs to conserve native biodiversity require a sound understanding of the relation between forest cover and the spatial pattern of forest fragments, but these issues remain almost unknown for subtropical ecosystems. We examine the forest fragmentation of the Gran Chaco in central Argentina over the last 30 years. In particular, we quantify forest loss and spatial pattern changes using random sampling techniques on multi-temporal forest cover maps (1979, 1999 and 2010). We analyzed forest fragmentation according to the following steps: (i) selection of fragmentation pattern indices (PIs), (ii) sampling on forest cover maps and PIs calculation, (iii) statistical comparison by bootstrapping, and (iv) trajectory analysis. During the last three decades, forest cover declined dramatically (6590%) and the selected pattern metrics (MPS, PD, ED) varied significantly ( p 02<020.05). The results depict a devastating situation of Gran Chaco forests with a progressive reduction to few small fragments during the last decades. Furthermore when forest loss exceeded the 6550% of the total land area, the temporal trajectories of the selected PIs underwent an abrupt change. Distinguishing habitat spatial pattern changes from forest loss over time supports the identification of specific conservation actions and provide the basis to establish the lower threshold of forest cover and the more effective arrangement of fragments necessary to mitigate the fragmentation effects.
|
| [3] |
Examining urban heat island relations to land use and air pollution: multiple endmember spectral mixture analysis for thermal remote sensing [J].https://doi.org/10.1109/JSTARS.2013.2263425 URL [本文引用: 1] 摘要
This paper proposes an integration of Spectral Mixture Analysis and Endmember Remote Sensing Indices to derive land surface temperature (LST), to identify urban heat islands (UHI) and to investigate their relationships to land use/land cover (LULC) and air-pollution in Tabriz city, Iran. LST values are assessed from ASTER remotely sensed thermal images to appraise the intensity of UHIs through a statistical approach. The results indicate that LST is highly influenced by LULC and that UHIs are closely linked to LST and LULC. As expected, LST is sensitive to vegetation and moisture and low temperatures are found in water bodies and vegetated areas. High temperatures are related to construction zones and industrial sites which are not necessarily located in the city centre. While the results demonstrate a high correlation between UHIs and air-pollution spatial analysis discloses a different pattern: when correlating identified UHI zones with air pollution the market area of Tabriz city reveals the highest measured PM values.
|
| [4] |
The elimate of London,vols [D]. |
| [5] |
On the frequency of snowfall in metropolitan England [J].https://doi.org/10.1002/qj.49708435910 URL [本文引用: 1] 摘要
No abstract is available for this article.
|
| [6] |
Remote sensing of urban heat islands from an environmental satellite [J]. |
| [7] |
Assessment of urban heat islands: a satellite perspective [J].https://doi.org/10.1016/0169-8095(94)00066-M URL [本文引用: 1] 摘要
The use of remotely sensed data offers a potential objective method for assessment of urban heat islands. Several studies that utilized satellite derived data are reviewed and future prospects are presented. The use of satellite derived Normalized Difference Vegetation Index data and the potential use of Defense Meteorological Satellite Program sensor data are reviewed in detail.
|
| [8] |
Creating the park cool island in an inner-city neighborhood: heat mitigation strategy for Phoenix, AZ [J].https://doi.org/10.1007/s11252-012-0278-8 URL [本文引用: 1] 摘要
We conducted microclimate simulations in ENVI-Met 3.1 to evaluate the impact of vegetation in lowering temperatures during an extreme heat event in an urban core neighborhood park in Phoenix, Arizona. We predicted air and surface temperatures under two different vegetation regimes: existing conditions representative of Phoenix urban core neighborhoods, and a proposed scenario informed by princi...
|
| [9] |
The role of local land-use on the urban heat island effect of Tel Aviv as assessed from satellite remote sensing [J].https://doi.org/10.1016/j.apgeog.2014.11.023 URL [本文引用: 1] 摘要
Climate change in cities has received much focus in the past few decades. Heat stress in urban areas has an adverse effect on human health and is expected to worsen in the future due to the global warming. Vegetation has been shown to mitigate this effect, but introducing ‘green’ areas into the metropolitan space is a challenging task. We assessed the thermal load in terms of surface temperature in Tel Aviv, the biggest metropolitan area of Israel. The thermal effect of four different urban land uses was estimated. Specifically, we compared the cooling effect of residential areas with high vegetation cover (referred here as ‘green’ residential) to that of small to medium size (2–40ha) public parks. To this end, we used satellite data of land surface temperature (LST) and the Normalized Difference Vegetation Index (NDVI), as a surrogate for vegetation cover. High-temporal data were combined with high spatial resolutions data to produce 10-year average LST and NDVI maps at high spatial resolution over Tel Aviv. As expected, industrial areas had the highest LST due to lowest ratio of vegetation to free space area (1%), while ‘green’ areas displayed the lowest LST. Green residential and small-medium public parks had comparable thermal loads, with green residential having slightly lower LST (by 0.5°C). In general, small-medium public parks displayed higher LST than expected. Inefficient use of free spaces for vegetation, i.e., relatively low vegetation cover to free space ratio, was probably the main cause for this. Public parks had a higher local cooling effect, but a less continuous one on the proximate surrounding (30–90m from the park), probably due to their relative location in the urban fabric. Our results suggest that ‘greening’ areas within the private urban space should be encouraged at the expense of building new small-medium parks in metropolitan areas that lack the sufficient free space for larger parks. The outcome of this study may have key implications for urban planners seeking to mitigate urban heat island effects under the limitation of existing dense urban layout.
|
| [10] |
上海城市热岛效应 [J].https://doi.org/10.11821/xb198204004 URL [本文引用: 1] 摘要
正为了弄清上海城市热岛效应,应用了下列资料: (1) 1955年上海外滩、徐家汇(这两站代表市区)和松江(代表远郊)的全年观测资料。 (2) 1956、1957两年上海徐家汇(市区)、龙华(城市边缘)和松江(远郊)观测资料。 (3) 1959年8月9—11日,由上海气象局、华东师范大学和同济大学等单位用阿斯曼通风干湿表,对上海市区进行了33个定点(测点位置分布见图1)、逐时四层次(20、50、
On The Shanghai urban heat island effect [J].https://doi.org/10.11821/xb198204004 URL [本文引用: 1] 摘要
正为了弄清上海城市热岛效应,应用了下列资料: (1) 1955年上海外滩、徐家汇(这两站代表市区)和松江(代表远郊)的全年观测资料。 (2) 1956、1957两年上海徐家汇(市区)、龙华(城市边缘)和松江(远郊)观测资料。 (3) 1959年8月9—11日,由上海气象局、华东师范大学和同济大学等单位用阿斯曼通风干湿表,对上海市区进行了33个定点(测点位置分布见图1)、逐时四层次(20、50、
|
| [11] |
Quantifying the heat flux regulation of metropolitan land use/land cover components by coupling remote sensing modeling with in situ measurement [J]. |
| [12] |
上海城市热环境的空间格局分析 [J].https://doi.org/10.1002/mop.10502 URL [本文引用: 1] Study on spatial pattern of urban heat environment in Shanghai City [J].https://doi.org/10.1002/mop.10502 URL [本文引用: 1] |
| [13] |
城市公园景观空间结构对其热环境效应的影响 [J].https://doi.org/10.5846/stxb201306101641 URL [本文引用: 1] 摘要
热岛效应是快速城市化进程中最具代表性的生态环境问题之一.以绿 地和水体为主体的城市公园所形成的“城市冷岛”是缓解城市热岛效应和改善城市热环境的有效途径.研究选取北京市城区24个公园为研究对象,利用 landsat-5 TM遥感影像反演城市地表温度,探讨城市公园内部景观构成、斑块形态和空间布局这3个方面的空间结构特征与其内部温度(Ta)、对周边环境降温的影响范围 (Lmax)及降温幅度(△Tmax)的关系.研究表明:从景观构成来看,Ta、Lmax、△Tmax与水体面积均呈现显著相关性,是影响公园内外热环境 的关键因子;Ta及△Tmax与公园内绿地面积无显著相关性,而主要受三维绿量和硬质地表比例的影响;与此相反,Lmax与绿量相关性并不显著,但与林地 面积呈显著正相关.因此,综合考虑公园内外整体降温效应,应在保证绿地面积达到一定规模的同时,尽量丰富绿地内部空间结构,增大三维绿量;从斑块形态来 看,绿地斑块形状越复杂,公园内部温度越低,影响范围越远,而公园外围边界形状与内部温度呈较显著正相关,但对周边热环境的影响并不明显;从空间布局来 看,硬质地表分布与Ta、Lmax、△Tmax均显著相关,其布局越分散,内部温度越低,对周边的影响范围及降温幅度越大;此外,公园林地布局越分散,内 部温度越低,影响范围越大,但对△Tmax影响不明显.在城市公园规划设计中,从缓解城市热岛效应出发,应将公园景观内部的空间结构特征作为重要的考虑因 素之一.
Impacts of structure characteristics on the thermal environment effect of city parks [J].https://doi.org/10.5846/stxb201306101641 URL [本文引用: 1] 摘要
热岛效应是快速城市化进程中最具代表性的生态环境问题之一.以绿 地和水体为主体的城市公园所形成的“城市冷岛”是缓解城市热岛效应和改善城市热环境的有效途径.研究选取北京市城区24个公园为研究对象,利用 landsat-5 TM遥感影像反演城市地表温度,探讨城市公园内部景观构成、斑块形态和空间布局这3个方面的空间结构特征与其内部温度(Ta)、对周边环境降温的影响范围 (Lmax)及降温幅度(△Tmax)的关系.研究表明:从景观构成来看,Ta、Lmax、△Tmax与水体面积均呈现显著相关性,是影响公园内外热环境 的关键因子;Ta及△Tmax与公园内绿地面积无显著相关性,而主要受三维绿量和硬质地表比例的影响;与此相反,Lmax与绿量相关性并不显著,但与林地 面积呈显著正相关.因此,综合考虑公园内外整体降温效应,应在保证绿地面积达到一定规模的同时,尽量丰富绿地内部空间结构,增大三维绿量;从斑块形态来 看,绿地斑块形状越复杂,公园内部温度越低,影响范围越远,而公园外围边界形状与内部温度呈较显著正相关,但对周边热环境的影响并不明显;从空间布局来 看,硬质地表分布与Ta、Lmax、△Tmax均显著相关,其布局越分散,内部温度越低,对周边的影响范围及降温幅度越大;此外,公园林地布局越分散,内 部温度越低,影响范围越大,但对△Tmax影响不明显.在城市公园规划设计中,从缓解城市热岛效应出发,应将公园景观内部的空间结构特征作为重要的考虑因 素之一.
|
| [14] |
快速城市化区域城市热岛及其环境效应研究 [J].
<p>以广州为中心的珠江三角洲区域城市化十分迅速,城市热岛对城市生态环境影响极大。城市热岛及其环境效应的研究有利于城市合理规划和可持续发展。利用中尺度模式MM5模拟广州地区的城市热岛效应,模式采用四重嵌套网格,最高水平分辨率为1km。研究通过数值模拟结果与自动气象站观测的气温和ETM+热红外波段反演的地温的对比,表明该方案能准确模拟地表的温度状况和城市热岛的环境效应。研究还表明城市干岛与热岛相伴而生,02时和11时广州热岛强度较小,相对湿度较高,20时热岛强度达到最大,城区相对湿度则最低;因城市热岛的存在,改变了原盛行风向,减弱了风速,且湿地、绿地、河流廊道等景观分割了城市热岛和干岛,增加了其破碎度,调节了城市气候。</p>
Research on urban heat Island and its environmental effects of rapidly urbanized regions [J].
<p>以广州为中心的珠江三角洲区域城市化十分迅速,城市热岛对城市生态环境影响极大。城市热岛及其环境效应的研究有利于城市合理规划和可持续发展。利用中尺度模式MM5模拟广州地区的城市热岛效应,模式采用四重嵌套网格,最高水平分辨率为1km。研究通过数值模拟结果与自动气象站观测的气温和ETM+热红外波段反演的地温的对比,表明该方案能准确模拟地表的温度状况和城市热岛的环境效应。研究还表明城市干岛与热岛相伴而生,02时和11时广州热岛强度较小,相对湿度较高,20时热岛强度达到最大,城区相对湿度则最低;因城市热岛的存在,改变了原盛行风向,减弱了风速,且湿地、绿地、河流廊道等景观分割了城市热岛和干岛,增加了其破碎度,调节了城市气候。</p>
|
| [15] |
The impacts of rapid urbanization on the thermal environment: a remote sensing study of Guangzhou, South China [J].https://doi.org/10.3390/rs4072033 URL [本文引用: 1] 摘要
Not Available
|
| [16] |
热红外遥感反演陆地表面温度研究进展 [J].https://doi.org/10.3969/j.issn.1001-070X.2006.01.002 URL [本文引用: 1] 摘要
总结了地表绝对发射率信息的提取方法;综述了热红外遥感反演陆面温度的各种方法,并指出这些方法的优缺点、适用性及应用情况;分析了热红外遥感反演陆面温度面临的困难;展望了热红外遥感反演陆面温度的发展趋势.
The progress in the study of thermal infrared remote sensing for retrieving land surface temperature [J].https://doi.org/10.3969/j.issn.1001-070X.2006.01.002 URL [本文引用: 1] 摘要
总结了地表绝对发射率信息的提取方法;综述了热红外遥感反演陆面温度的各种方法,并指出这些方法的优缺点、适用性及应用情况;分析了热红外遥感反演陆面温度面临的困难;展望了热红外遥感反演陆面温度的发展趋势.
|
| [17] |
Utility of landsat image in the study of land cover and land surface temperature change [J].https://doi.org/10.1016/j.proenv.2011.09.206 URL Magsci [本文引用: 1] 摘要
Scientists have aimed at exploring land use and land cover (LULC) and their environmental influence in order to improve our understanding of the causes and consequences of these phenomena. This study addresses and use and land cover change (LUCC) in the upper reaches of Pearl River Delta, China, from 1990 to 2008. Based on remotely sensed images of Landsat. LUCC and land surface temperature were assessed. Results showed that land surface temperature was highly influenced by the LUCC from 1990 to 2008. An examination of the relationship between the LULC and LST maps was finally conducted to comprehension their interactions. Results indicated that Landsat image was effective for quantifying the heat environment and providing reliable measurements of land use change. LST was found to be positively correlated with impervious surface but negatively correlated with vegetated land. Each temperature zone was associated with a dominant LULC category. (C) 2011 Published by Elsevier Ltd. Selection and/or peer-review under responsibility of Conference ESIAT2011 Organization Committee.
|
| [18] |
Energy savings potentials of commercial buildings by urban heat island reduction strategies in Montreal (Canada) [J].https://doi.org/10.1016/j.enbuild.2015.10.018 URL [本文引用: 1] 摘要
The energy consumption of commercial buildings in Montreal (Canada) with absorptive and reflective skin materials is investigated. Four building prototypes (small office, medium office, large office, and retail store) with two types of heating systems (gas heating and heat pump) categorized based on vintage and HVAC system (old building with old HVAC, old building with new HVAC, and new building with new HVAC) are studied (total of 24 cases). For each case three simulations are performed using DOE-2 building energy model: (1) dark roof and walls with measured weather data: representing the actual case and the basis for comparing the effect on albedo enhancement, (2) cool roof and walls with measured weather data: determining the direct effect of increasing albedo of an individual building, and (3) cool roof and walls with modified weather data: predicting the effect of albedo enhancement in urban scale that contributes to weather condition. In all cases the effect of snow on the roof is considered and for modification of the weather data output of mesoscale meteorological simulation is used. Calculated energy consumption and energy expenditure showed that, in general, increasing the reflectivity of building skin saves energy and money. The surface modification is more beneficial for old vintage buildings. The maximum expenditure savings is about 11% for buildings with dark roof and walls, where the contribution of urban-scale increase in the surface albedo can be as high as 4% in the total energy expenditure savings.
|
| [19] |
Bi-temporal characterization of land surface temperature in relation to impervious surface area, NDVI and NDBI, using a sub-pixel image analysis [J].https://doi.org/10.1016/j.jag.2009.03.001 URL [本文引用: 1] 摘要
As more than 50% of the human population are situated in cities of the world, urbanization has become an important contributor to global warming due to remarkable urban heat island (UHI) effect. UHI effect has been linked to the regional climate, environment, and socio-economic development. In this study, Landsat Thematic Mapper (TM) and Enhanced Thematic Mapper Plus (ETM+) imagery, respectively acquired in 1989 and 2001, were utilized to assess urban area thermal characteristics in Fuzhou, the capital city of Fujian province in south-eastern China. As a key indicator for the assessment of urban environments, sub-pixel impervious surface area (ISA) was mapped to quantitatively determine urban land-use extents and urban surface thermal patterns. In order to accurately estimate urban surface types, high-resolution imagery was utilized to generate the proportion of impervious surface areas. Urban thermal characteristics was further analysed by investigating the relationships between the land surface temperature (LST), percent impervious surface area, and two indices, the Normalized Difference Vegetation Index (NDVI) and Normalized Difference Built-up Index (NDBI). The results show that correlations between NDVI and LST are rather weak, but there is a strong positive correlation between percent ISA, NDBI and LST. This suggests that percent ISA, combined with LST, and NDBI, can quantitatively describe the spatial distribution and temporal variation of urban thermal patterns and associated land-use/land-cover (LULC) conditions.
|
| [20] |
城市景观格局时空特征的热环境效应研究——以广州市花都区为例 [J].https://doi.org/10.11849/zrzyxb.2015.03.011 URL [本文引用: 1] 摘要
1999—2009年,广州市花都区经历了经济腾飞的10 a,不断变迁的城市景观格局时刻影响着热环境的分布。论文基于Landsat TM/ETM+遥感数据,获得地温反演图和土地利用类型图。采用均值-标准差法划分热力等级以分析热力重心变化,并与建设用地重心变化作对比。通过移动窗口得出可视化的景观指数,指数刻画包括景观多样性和建设用地密度、形状和分布状况,进而分析景观指数与地温间的相关性。研究结果表明:区内南部受人类活动影响最为剧烈;土地利用类型并非是影响地温分布的唯一因素;区内城市景观格局多样性与地温虽存在正相关关系,但随着多样性程度加剧且各组合面积比例均匀,降低了两者相关程度;建设用地面积比例、分离度与地温的相关关系较为稳定,且比例较高或分离度较低的所在区域通常为高温区;建设用地平均分维指数与地温的相关性随着其形状的复杂性加剧和分布范围扩大而降低,即影响了高温形成的程度。
Study on thermal environment effect of urban landscape pattern: a case study on Huadu district, Guangzhou [J].https://doi.org/10.11849/zrzyxb.2015.03.011 URL [本文引用: 1] 摘要
1999—2009年,广州市花都区经历了经济腾飞的10 a,不断变迁的城市景观格局时刻影响着热环境的分布。论文基于Landsat TM/ETM+遥感数据,获得地温反演图和土地利用类型图。采用均值-标准差法划分热力等级以分析热力重心变化,并与建设用地重心变化作对比。通过移动窗口得出可视化的景观指数,指数刻画包括景观多样性和建设用地密度、形状和分布状况,进而分析景观指数与地温间的相关性。研究结果表明:区内南部受人类活动影响最为剧烈;土地利用类型并非是影响地温分布的唯一因素;区内城市景观格局多样性与地温虽存在正相关关系,但随着多样性程度加剧且各组合面积比例均匀,降低了两者相关程度;建设用地面积比例、分离度与地温的相关关系较为稳定,且比例较高或分离度较低的所在区域通常为高温区;建设用地平均分维指数与地温的相关性随着其形状的复杂性加剧和分布范围扩大而降低,即影响了高温形成的程度。
|
| [21] |
Measuring forest fragmentation using multitemporal forest cover maps: Forest loss and spatial pattern analysis in the Gran Chaco, central Argentina [J].https://doi.org/10.1016/j.landurbplan.2015.08.006 URL [本文引用: 1] 摘要
Forest fragmentation is a landscape-level process that consists of two interdependent components: forest loss and spatial pattern changes to which species respond differently. Efficient programs to conserve native biodiversity require a sound understanding of the relation between forest cover and the spatial pattern of forest fragments, but these issues remain almost unknown for subtropical ecosystems. We examine the forest fragmentation of the Gran Chaco in central Argentina over the last 30 years. In particular, we quantify forest loss and spatial pattern changes using random sampling techniques on multi-temporal forest cover maps (1979, 1999 and 2010). We analyzed forest fragmentation according to the following steps: (i) selection of fragmentation pattern indices (PIs), (ii) sampling on forest cover maps and PIs calculation, (iii) statistical comparison by bootstrapping, and (iv) trajectory analysis. During the last three decades, forest cover declined dramatically (6590%) and the selected pattern metrics (MPS, PD, ED) varied significantly ( p 02<020.05). The results depict a devastating situation of Gran Chaco forests with a progressive reduction to few small fragments during the last decades. Furthermore when forest loss exceeded the 6550% of the total land area, the temporal trajectories of the selected PIs underwent an abrupt change. Distinguishing habitat spatial pattern changes from forest loss over time supports the identification of specific conservation actions and provide the basis to establish the lower threshold of forest cover and the more effective arrangement of fragments necessary to mitigate the fragmentation effects.
|
| [22] |
Spatial distribution and microscale characteristics of the urban heat island in Tel-Aviv, Israel [J].https://doi.org/10.1016/S0169-2046(99)00075-4 URL [本文引用: 1] 摘要
A significant urban heat island (UHI) was identified in Tel-Aviv on a stable winter day. The UHI detection was performed using air temperatures at both the roof and the street levels (using fixed-station and car-traverse measurements) and at the surface level (using an airborne thermal video radiometer [TVR]). Whereas the complex microscale characteristics of the UHI studied by the TVR at the surface level showed variations of up to 10°C, at the street level, air temperature variations of 3–5°C were identified between the city center and the surrounding areas. It was found that during the nighttime, the warm Mediterranean Sea has a moderating effect on the roof-level temperatures, whereas, at the street level, the urban heat island is more pronounced. The combined method of monitoring the UHI from different levels and on different scales for the first time enabled a spatial assessment of the city’s UHI and its diverse thermal coverage characteristics. The thermal differences of neighborhoods, urban activity and urban components were compared. It was demonstrated that the city cover plays an important role in the thermal activity of Tel-Aviv. A similar UHI spatial pattern was obtained using isotherm maps, generated from the air temperatures at street level, and thermal images, generated by the TVR at the surface level. It was concluded that there are differences in the magnitude of the UHI at different levels of the canopy layer and at different times, but the UHI pattern has similar trends.
|
| [23] |
利用MODIS大气廓线产品计算空气相对湿度的方法研究 [J].https://doi.org/10.3969/j.issn.1004-4965.2007.06.013 URL [本文引用: 1] 摘要
森林火灾遍及全球,损失巨大。火险天气指数(FWI)是森林火灾预警和管理的有效工具。相对湿度(RH)是计算天气火险指数一个非常重要的参数。然而,由插值方法得到的RH在远离气象站点的地方往往存在很大的误差。因此,尝试利用MODIS遥感数据计算基于像元的高分辨率RH。MODIS的MOD07大气廓线产品,可以提供大气可降水量和地表气温数据。基于地面水汽压和大气可降水量的经验关系,利用MODIS数据计算了地表空气的相对湿度,平均绝对误差小于5%。结果表明,利用MODIS数据能简单而有效地计算地表空气的相对湿度,拓展了遥感技术在森林火险管理中的应用。
A method of estimating relative humidity from MODIS atmospheric profile products [J].https://doi.org/10.3969/j.issn.1004-4965.2007.06.013 URL [本文引用: 1] 摘要
森林火灾遍及全球,损失巨大。火险天气指数(FWI)是森林火灾预警和管理的有效工具。相对湿度(RH)是计算天气火险指数一个非常重要的参数。然而,由插值方法得到的RH在远离气象站点的地方往往存在很大的误差。因此,尝试利用MODIS遥感数据计算基于像元的高分辨率RH。MODIS的MOD07大气廓线产品,可以提供大气可降水量和地表气温数据。基于地面水汽压和大气可降水量的经验关系,利用MODIS数据计算了地表空气的相对湿度,平均绝对误差小于5%。结果表明,利用MODIS数据能简单而有效地计算地表空气的相对湿度,拓展了遥感技术在森林火险管理中的应用。
|
| [24] |
卫星气候数据集的应用研究与发展分析 [J].https://doi.org/10.3724/SP.J.1047.2015.01278 URL [本文引用: 1] 摘要
卫星气候数据集是卫星气候研究的基础。在规范卫星气候数据集基本概念的基础上,针对现有基本气候数据集(FCDR)和专题气候数据集(TCDR)的分类方式,无法反映卫星气候数据特点的问题,认为应将专题气候数据集进一步划分为单一遥感仪器专题气候数据集、多种遥感仪器融合专题气候数据集及卫星与多源资料融合专题气候数据集等几类。这种分类方法便于用户更好地了解和使用卫星气候数据。然后,重点围绕基本气候变量和基本卫星气候变量含义、卫星气候数据集生产规范、国内外主要卫星气候数据生产计划等方面,综述了卫星气候数据集建设及规范化生产已取得的最新研究进展。在此基础上,分析了卫星气候数据集建设和应用中存在的主要问题,展望了卫星气候数据集发展,同时对我国卫星气候数据集建设提出具体建议。
Research progress of satellite-based climate dataset [J].https://doi.org/10.3724/SP.J.1047.2015.01278 URL [本文引用: 1] 摘要
卫星气候数据集是卫星气候研究的基础。在规范卫星气候数据集基本概念的基础上,针对现有基本气候数据集(FCDR)和专题气候数据集(TCDR)的分类方式,无法反映卫星气候数据特点的问题,认为应将专题气候数据集进一步划分为单一遥感仪器专题气候数据集、多种遥感仪器融合专题气候数据集及卫星与多源资料融合专题气候数据集等几类。这种分类方法便于用户更好地了解和使用卫星气候数据。然后,重点围绕基本气候变量和基本卫星气候变量含义、卫星气候数据集生产规范、国内外主要卫星气候数据生产计划等方面,综述了卫星气候数据集建设及规范化生产已取得的最新研究进展。在此基础上,分析了卫星气候数据集建设和应用中存在的主要问题,展望了卫星气候数据集发展,同时对我国卫星气候数据集建设提出具体建议。
|
| [25] |
用陆地卫星TM6数据演算地表温度的单窗算法 [J].https://doi.org/10.1142/S0252959901000401 URL [本文引用: 1] 摘要
陆地卫星TM数据(TM6)热波段表示地表热辐射和地表温度变 化.长期以来,从TM6数据中演算地表温度通常是通过所谓大气校正法.这一方法需要估计大气热辐射和大气对地表热辐射传导的影响,计算过程很复杂,误差也 较大,在实际中应用不多.根据地表热辐射传导方程,推导出一个简单易行并且精度较高的演算方法,把大气和地表的影响直接包括在演算公式中.该算法需要用地 表辐射率、大气透射率和大气平均温度3个参数进行地表温度的演算.验证表明,该方法的地表温度演算较高.当参数估计没有误差时,该方法的地表温度演算精度 达到<0.4℃, 在参数估计有适度误差时,演算精度仍达<1.1℃.因该方法适用于仅有一个热波段的遥感数据,故称为单窗算法.
Mono-window algorithm for retrieving land surface temperature from Landsat TM 6 Data [J].https://doi.org/10.1142/S0252959901000401 URL [本文引用: 1] 摘要
陆地卫星TM数据(TM6)热波段表示地表热辐射和地表温度变 化.长期以来,从TM6数据中演算地表温度通常是通过所谓大气校正法.这一方法需要估计大气热辐射和大气对地表热辐射传导的影响,计算过程很复杂,误差也 较大,在实际中应用不多.根据地表热辐射传导方程,推导出一个简单易行并且精度较高的演算方法,把大气和地表的影响直接包括在演算公式中.该算法需要用地 表辐射率、大气透射率和大气平均温度3个参数进行地表温度的演算.验证表明,该方法的地表温度演算较高.当参数估计没有误差时,该方法的地表温度演算精度 达到<0.4℃, 在参数估计有适度误差时,演算精度仍达<1.1℃.因该方法适用于仅有一个热波段的遥感数据,故称为单窗算法.
|
| [26] |
单窗算法的大气参数估计方法 [J].https://doi.org/10.3969/j.issn.1001-070X.2003.02.010 URL [本文引用: 1] 摘要
根据地表热辐射传导方程,提出了一个简单可行且精度较高的专门用于从TM6数据中演算地表温度的方法———单窗算法。这一算法把大气和地表状态对地表热传导的影响直接包括在演算公式中。该方法需要两个大气参数进行地表温度的演算,即大气平均作用温度和大气透射率。本文论述这两个大气参数的估计方法:根据大气水分含量或地表附近空气湿度来估计大气透射率;通过分析标准大气剖面资料,尤其是大气水分和气温随高程的变化规律,根据地表温度推算大气平均作用温度。
Estimating of the essential atmospheric parameters of Mono-window algorithm for land surface temperature retrieval from Landsat TM6 [J].https://doi.org/10.3969/j.issn.1001-070X.2003.02.010 URL [本文引用: 1] 摘要
根据地表热辐射传导方程,提出了一个简单可行且精度较高的专门用于从TM6数据中演算地表温度的方法———单窗算法。这一算法把大气和地表状态对地表热传导的影响直接包括在演算公式中。该方法需要两个大气参数进行地表温度的演算,即大气平均作用温度和大气透射率。本文论述这两个大气参数的估计方法:根据大气水分含量或地表附近空气湿度来估计大气透射率;通过分析标准大气剖面资料,尤其是大气水分和气温随高程的变化规律,根据地表温度推算大气平均作用温度。
|
| [27] |
Analysis of the impact of Land use/Land cover change on land surface temperature with remote sensing [J].https://doi.org/10.1016/j.proenv.2010.10.062 URL [本文引用: 1] 摘要
Nowadays, more than 40% of the population lives in Chinese cities. The rapid urbanization process brought about many ecoenvironmental problems, such as the drastic change of land use and development of urban heat island. Three Landsat TM and ETM+ images data of Beijing acquired on April 9, 1995 and April 30, 2000 were selected to this research. The land surface temperature (LST) and land use and land cover (LULC) classes were retrieved and extracted. The temperature-vegetation index (TVX) space was constructed to investigate the influence of land changes over LST. The result showed that the land use change was an important driver for LST increase, the temporal trajectory of pixels in the TVX space migrated from the dense-vegetationlow temperature condition to the sparse vegetation-high temperature condition.
|
| [28] |
上海市城市化进程中热环境响应的空间评价 [J].
利用Landsat TM/ETM+遥感数据解译与反演得到上海市1997~2009年的土地利用/覆盖类型图及热岛强度分布图,并分析其演变趋势,引入温度-植被指数 (TVX)并采用TVX空间法定量研究了以建设用地扩张、生态用地减少为特点的城市化过程引起的热环境效应.研究表明,1997~2009年,上海市人口 呈现从中心城至郊区的流动趋势;热岛强度分布与城市化建设密切相关,呈现“葫芦串-葡萄串-摊大饼型”的蔓延模式;以牺牲生态用地为代价的建设用地扩张造 成研究区域地表温度的上升及植被覆盖度的下降,其中林地减少所引起的热环境效应最大.研究可为城市规划决策过程中不同城市化空间的拓展情景提供其可能的环 境响应结果,从而完善气候变化适应性对策,推进城市生态系统的可持续发展.
An assessment of spatial thermal environmental response to rapid urbanization of Shanghai [J].
利用Landsat TM/ETM+遥感数据解译与反演得到上海市1997~2009年的土地利用/覆盖类型图及热岛强度分布图,并分析其演变趋势,引入温度-植被指数 (TVX)并采用TVX空间法定量研究了以建设用地扩张、生态用地减少为特点的城市化过程引起的热环境效应.研究表明,1997~2009年,上海市人口 呈现从中心城至郊区的流动趋势;热岛强度分布与城市化建设密切相关,呈现“葫芦串-葡萄串-摊大饼型”的蔓延模式;以牺牲生态用地为代价的建设用地扩张造 成研究区域地表温度的上升及植被覆盖度的下降,其中林地减少所引起的热环境效应最大.研究可为城市规划决策过程中不同城市化空间的拓展情景提供其可能的环 境响应结果,从而完善气候变化适应性对策,推进城市生态系统的可持续发展.
|

/
| 〈 |
|
〉 |