刘稼丰 , 焦利民, 董婷, 许刚, 张博恩, 杨璐迪
武汉大学资源与环境科学学院, 湖北 武汉 430079
Liu Jiafeng, Jiao Limin, Dong Ting, Xu Gang, Zhang Bo’en, Yang Ludi
中图分类号: K909
文献标识码: A
文章编号: 1000-0690(2018)11-1741-09
收稿日期: 2017-12-8
修回日期: 2018-03-8
网络出版日期: 2018-11-20
版权声明: 2018 《地理科学》编辑部 本文是开放获取期刊文献,在以下情况下可以自由使用:学术研究、学术交流、科研教学等,但不允许用于商业目的.
基金资助:
作者简介:
作者简介:刘稼丰(1992-),男,河南平顶山人,博士研究生,主要从事城市扩张研究。E-mail:liujiafeng@whu.edu.cn
展开
摘要
提出多阶邻接度指数(Multi-order Adjacency Index, MAI),应用多阶缓冲区完善对新旧斑块间空间关系的识别,从而更为详细地揭示城市扩张过程特征。MAI的延伸公式可供自下而上从宏观分析城市整体的扩张程度及空间变化过程。选取武汉市作为研究区,基于4期遥感影像(1995、2000、2005和2010年)划分3个时段应用MAI分析武汉市城市景观格局的演变特征。结果表明,MAI能够详细地反映出新增城市斑块在空间上有更加离散的分布趋势,新增斑块的扩张程度逐渐加深,建成区的边界不断向外延展。比较MAI与LEI(Landscape Expansion Index, LEI)的特征差异,指出MAI能够更加详尽地反映新旧斑块间的空间位置关系。
关键词:
Abstract
Landscape index is an effective approach to capture the information for landscape pattern. In urban expansion, the spatial relationship of newly grown urban patches to existing urban areas reflects the properties of urban expansion evolution. However, existing metrics cannot comprehensively express the spatial distributions of all new patches relative to old patches, lacking quantitative reflection of spatial relationship gradient of outlying new patches to old patches. We propose a new landscape metric, multi-order adjacency Index (MAI), to depict urban expansion degree by adjacency degree based on distance between new and old patches and boundary-sharing rate. The two characteristics of MAI are shown as follows: 1) The value of MAI is continuous for reflecting the gradient of expansion degree of new patches. 2) MAI has clear physical meaning for representing actual distance between new and old patches, and the landscape expansion types are then redefined by MAI. Meanwhile, the two variants of MAI, mean multi-order adjacency Index (MMAI) and area-weighted mean multi-order adjacency Index (AWMMAI), are designed to capture information for the dynamic process of urban expansion from a bottom-up view. Based on four period’s remote sensing images (1995, 2000, 2005 and 2010) of Wuhan, we applied MAI for characterizing the change of landscape pattern. The following results were obtained: 1) The variation trend of the number for each expansion type show a tendency to decrease first and then increase except distant leap type that present a dramatic increasing trend; 2) The spatial pattern of Wuhan was more compact in the beginning, and became more and more dispersed along with urban expansion; 3) The result of MMAI indicate average expansion degree increased in the dynamic process of urban expansion, and the change trend of AWMMAI shows that the global spatial pattern of Wuhan city is dispersed in a general trend, but has a direction towards the compact development during 2005-2010. By comparing MAI and other dynamic metrics of urban expansion, we found that MAI can provide information more precisely than others in reflecting the gradient spatial relationship. At the same time, MAI improved the recognition of landscape expansion type and made up for the lack of quantitatively distinguishing the urban patches with larger urban expansion degree by the existing measurement methods. MAI also inquired into the spatial pattern change characteristics of urban landscape expansion in a deeper level. MAI provides a better perspective to understand the hidden mechanism of the spatial characteristics of urban expansion. Future research will include analysis and verification of the growth of the outlying seed regions. The simulation model of urban expansion by using MAI could be discussed for predicting the farther urban expansion. MAI is also expected to be a practical measurement to generalize in other cities or scales for better understanding urban expansion dynamics and analyzing problems of urban spatial pattern.
Keywords:
城市化进程必然伴随着城市在空间上的扩张,刻画和理解城市扩张造成的景观格局演变具有重要意义[1,2]。部分城市无序的扩张已导致城市景观不合理蔓延(urban sprawl),造成土地资源的低密度利用和浪费等一系列问题[3,4,5]。城市形态朝着紧凑的方向发展是对抗城市蔓延的有效手段,如何定量化测度城市扩张过程引起广泛关注[6,7,8,9]。景观斑块在空间上的分布与配置构成景观格局[10],从斑块层面用景观格局指数对城市扩张的空间特征进行测度,可自下而上揭示城市的扩张过程,为深层次理解城市扩张机制提供帮助。
传统的景观格局指数仅刻画静态的空间分布模式,不包含空间变化过程信息,在分析景观的动态变化时,大部分景观格局指数只侧重于对景观格局几何特征的简单对比分析和描述,例如,对于新增城市用地斑块,计算斑块特征的空间指数能够反映某一时点斑块本身的数量、形状等信息,但不能反映该斑块相对于历史数据表现出来的动态变化特征[11,12]。
城市扩张是典型的景观动态变化过程,对其特征和结构的分析必然应考虑时空效应[13,14]。同时也应兼顾城市扩张过程特性,即原有城市建设用地性质一般不发生改变,城市景观格局的改变主要受新增斑块位置的影响。目前能刻画城市扩张动态过程的空间指数还非常有限,一般通过定量化描述新增斑块与原有斑块之间的空间位置关系揭示城市景观格局动态变化特征。文献[15]使用新旧斑块间边界共享比率定义指数
根据上述指数的定义,与原有斑块没有共享边界或缓冲区重叠的新增斑块的指数值将被无差别计算为0。实际上,新增斑块出现的空间位置并不一定与原有斑块相接或相邻,特别是在扩张活动剧烈的城市,大量新增斑块偏离原有斑块出现,同时,彼此在空间分布上存在显著差异。由于上述指数只对新增斑块做一个缓冲区,并且这些指数的鲁棒性(robustness)受到缓冲区距离的限制,通常在测度时选择较小的缓冲区距离,致使与原有斑块没有共享边界或缓冲区重叠的新增斑块数量过剩,均被统一赋值为0。这种结果将极大地掩盖斑块空间扩张特征的差异性,导致城市景观格局的动态演变过程不能被精确刻画。
本次研究提出多阶邻接度指数(Multi-order Adjacency Index, MAI),用于提升对城市扩张过程的刻画。MAI能够详细展示新旧斑块间空间关系,定量化反映新增斑块空间扩张特征的差异性。通过对MAI的特性进行探讨,景观扩张类型被进一步划分,同时,结合2种自下而上的区域均值算法,相较于历史数据所表现出的城市扩张过程特征能够被更精确地捕获。本文研究基于多时相遥感影像,以武汉市1995~2010年间的城市扩张为例验证MAI,识别武汉市各个时段城市扩张的模式,并定量化地分析武汉市扩张过程的动态变化。最后,文中比较了MAI与LEI的特征差异,指出MAI能够更加详尽地反映新旧斑块间空间关系。
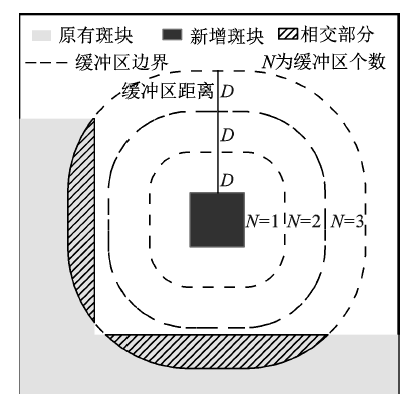
多阶邻接度指数基于新旧斑块间空间关系的邻接程度,设定缓冲区距离为
式中,
图1展示一个新增斑块的MAI值计算过程,图中明显看出,新增斑块距离原有斑块有一定距离。假设缓冲区距离
图1 多阶邻接度指数计算实例
Fig.1 An example of an Multi-order Adjacency Index (MAI) calculation
MAI的数值具有明确的物理意义。根据MAI的定义,第
缓冲区距离
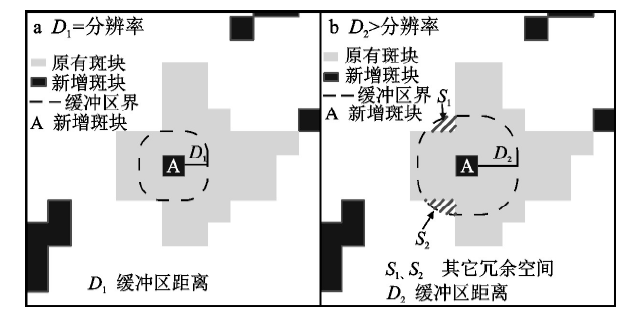
在实际的应用过程中,数据基本来源于遥感影像的解译,呈现栅格结构,2个不相连的斑块之间最短的距离等于遥感影像的分辨率。因此,缓冲区距离小于分辨率时,由于原始数据的条件限制,新增斑块的第一个缓冲区没有任何实际作用与意义,只会导致所有新增斑块的扩张程度被高估。但是,当缓冲区距离大于分辨率时,扩张程度较低斑块的值则会被高估。例如,新增斑块A在图像上被表示为由原有斑块包围的一个像元,图2a表示,当缓冲区距离
将景观在扩张的过程中表现出的空间分布差异性归纳为不同的空间扩张类型,可为刻画景观扩张模式提供依据。Gottmann等认为单个城市的空间扩张可以分为集聚型的蔓延式、连片式、分片式,和扩散型的轴向式、飞地式[18]。Forman从景观生态学的角度,指出城市扩张从景观上可以分为单核式、边缘式、多核式、廊道式、散步式5种[19]。Liu则依据LEI将景观扩张模式的类型主要分为内填式、边缘式和跳跃式3类[16]。
然而,原有的跳跃式斑块在空间分布上存在着显著差异,将其进一步细分有助于理解新旧斑块间空间关系的渐变性。基于MAI的扩张类型划分保留内填式扩张与边缘式扩张,将跳跃式扩张类型进一步划分为4类:邻近式、相间式、分离式以及蔓延式,凸显扩张模式的渐变性。
内填式扩张被定义为新增斑块填补了城市建设用地的空隙,即
表1 基于MAI的扩张类型属性
Table 1 Attribution of expansion type based on MAI
| 扩张类型 | 内填式 | 边缘式 | 邻近式 | 相间式 | 分离式 | 蔓延式 |
|---|---|---|---|---|---|---|
| N | 1 | 1 | 2 | 3 | 4 | [5,+∞) |
| 距离范围 | [0,D) | [0,D) | [D,2D) | [2D,3D) | [3D,4D) | ≥4D |
| MAI 值域范围 | [0, 0.5) | [0.5, 1) | [1, 2) | [2, 3) | [3, 4) | [4, +∞) |
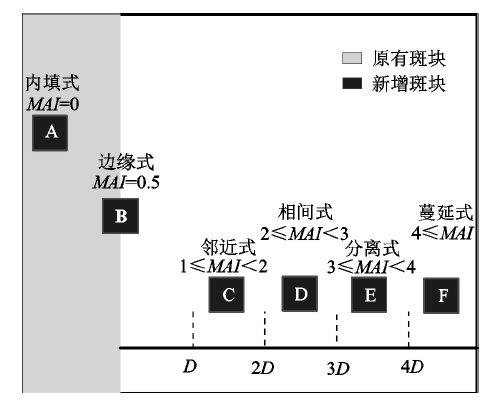
图3展示了MAI对6种扩张类型的区分,缓冲区距离为D。斑块A和B与原有斑块相接,但A内嵌于原斑块,代表内填式扩张;B仅有一半嵌入原斑块,代表边缘式扩张;C~F都需做多个缓冲区才能与原斑块相交,C、D、E、F的缓冲区个数分别为2、3、4、5,C~F分别对应邻近式扩张,相间式扩张、分离式扩张以及蔓延式扩张,反映出扩张程度的渐变性。
MAI计算结果是单个新增斑块扩张程度的微观反映,而景观格局的演变是由所有新增斑块综合作用的结果,因此,本次研究中采用基于MAI的MMAI(mean multi-order adjacency index)和AWMMAI(area-weighted mean muti-order adjacency index)的算法,用于自下而上反映城市整体区域的宏观扩张过程。
MMAI即平均多阶邻接度指数是指所有新增斑块MAI值的平均值,公式如下所示:
式中,
AWMMAI是指面积加权平均多阶邻接度指数,公式如下:
式中,ai是这一新增斑块的面积;A为所有新增斑块面积的总和。如果城市扩张整体趋向于紧凑,则AWMMAI值越小;如果城市扩张趋向于离散,AWMMAI值越大。
本文以湖北省武汉都市区1995~2000年城市扩张为例,验证多阶邻接度指数的可行性,研究区范围总共3 113.4 km2。本文获取了1995年10月5日和2000年11月7日Landsat系列TM遥感影像数据,以及2005年9月11日和2010年9月17日的ETM+遥感影像,在ENVI 5.0的支持下进行监督分类,提取城市建设用地。为保障解译的精确性,使用最大似然法将土地类型分为4类(建设用地,水体,绿地和其它),每个类型至少选取50个训练区。同时,利用转换分离度(transformed divergence, TD)来评估训练样本,确保样本之间可分离性良好(
由解译结果可得,3个时间段的新增斑块总数分别为8 294、7 517和16 517个,2005~2010时段明显高于前2个时段,表明1995~2010年间,尤其是2005~2010年间,武汉市的景观发生了极大的变化,大量的农田和林地等非城市用地转变为城市用地。由于所使用遥感影像的分辨率均为30 m,因此,本次研究所使用的MAI缓冲区距离为30 m。
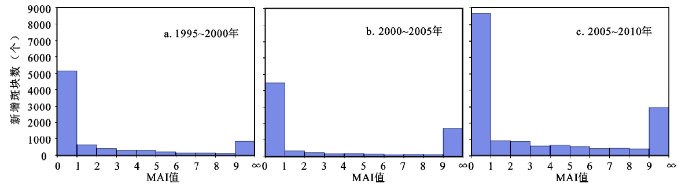
利用ArcGIS10.2中内嵌的Python编程环境编写脚本,分别计算3个时段(1995~2000、2000~2005、2005~2010年)新增斑块的MAI值。MAI值分布直方图如图5所示,3个时段中MAI值的分布均是连续的,在图上可继续延伸MAI值在
为更深层次揭示武汉市城市景观格局的动态变化特征,3个时段内基于MAI的6种城市扩张类型的数量与比例如表2所示。6种扩张类型斑块数量变化展现一定规律,大部分扩张类型的斑块数量变化趋势基本与整个研究期间新增斑块总数变化趋势一致,均为先减小后增大。蔓延式扩张斑块数量呈明显递增态势,特别是相对于2000~2005年,2005~2010年增加135%,说明武汉市城市用地朝着逐渐蔓延的方式发展,城市形态向离散演变。
表2 各扩张类型所占数量与比例
Table 2 The number and rate of each expansion type
| 扩张类型 | MAI 值域范围 | 1995~2000年 | 2000~2005年 | 2005~2010年 | |||||
|---|---|---|---|---|---|---|---|---|---|
| 数量(个) | 比例(%) | 数量(个) | 比例(%) | 数量(个) | 比例(%) | ||||
| 内填式 | [0, 0.5) | 2964 | 36 | 2384 | 32 | 4132 | 25 | ||
| 边缘式 | [0.5, 1) | 2192 | 26 | 2082 | 28 | 4528 | 27 | ||
| 邻近式 | [1, 2) | 638 | 8 | 334 | 4 | 907 | 6 | ||
| 相间式 | [2, 3) | 407 | 5 | 230 | 3 | 869 | 5 | ||
| 分离式 | [3, 4) | 305 | 4 | 149 | 2 | 586 | 4 | ||
| 蔓延式 | [4, ∞) | 1788 | 21 | 2338 | 31 | 5495 | 33 | ||
各扩张类型新增斑块的数量所占整体新增斑块数量的比例代表城市扩张的特征,值得注意的是,虽然内填式扩张新增斑块的数量呈现波动式上升,但占全部新增斑块的比例逐渐减少,3期整体降幅约为30%;边缘式新增斑块的比例平均稳定在27%左右,2000~2005年间略有上升;蔓延式新增斑块所占比例依次增加,整体增幅约为57%;邻近式、相间式和分离式新增斑块所占比例变化趋势与数量变化趋势基本保持一致。上述情况说明,研究初期内填式扩张类型的新增斑块所占比重最大,然后持续下降,相反,蔓延式扩张类型占比连续上升,表明1995~2010年间武汉市城市空间扩张结构由相对紧凑的扩张类型趋向于以蔓延式为主的离散扩张;边缘式扩张类型一直占重要地位,是主要的扩张类型,变化趋势相对稳定,表明依靠原有建设用地增长是城市扩张结构较为稳定的组成部分;在不同时段,邻近式、相间式与分离式扩张类型发生的概率易受城市整体扩张活动强度的影响,而在相同时段,它们各自所占比例呈现依次递减的规律,反映出城市扩张在空间上的渐变性,即呈现出与原有建设用地关系越弱的位置,新增斑块出现的频率越少。
新增斑块单元与原有斑块的距离从另一方面反映城市扩张过程的特征。对3个时间段内所有新增斑块的
从上述分析可以得出,武汉市在城市扩张过程中建成区内部出现新增建设用地的情境减少,靠近建成区周边的区域一直是新增建设用地选址的首要目标,新增的城市斑块在空间上有更加离散的分布趋势,城市斑块扩张程度逐渐加深,整个建成区的边界不断向外延展。
为分析武汉市城市形态整体扩张趋势,我们运用MMAI和AWMMAI对3个时期内所有的新增斑块进行计算。3个时间段内的MMAI呈现先增加后减小,总体曲折增加的趋势,特别是在1995~2000和2000~2005年2个时段,MMAI由3.62增长至7.6,增幅达到109.94%,2005~2010年间则略微下降,为5.48。1995~2010年间MMAI总体上升51.38%,这表明斑块的整体扩张程度变化趋势在逐渐增大。AWMMAI在1995~2000、2000~2005、2005~2010年为1.41、4.58、2.26,变化呈曲折式上升,先大幅度增加,增幅为224.82%,后又下降41.58%,1995~2010年间AWMMAI总体上升50.66%,说明武汉市的城市景观格局越来越趋于离散。
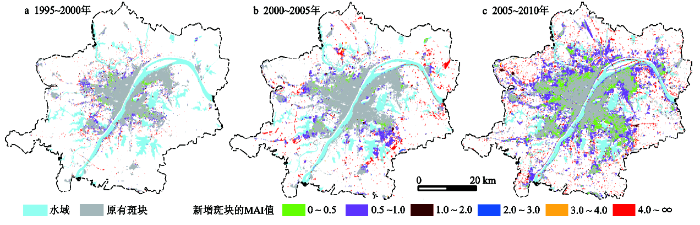
MMAI普遍高于AWMMAI,AWMMAI上升幅度不如MMAI明显,说明紧凑的新增斑块在面积上大于离散的新增斑块,非跳跃式扩张(MAI<1)的斑块对城市空间形态的影响始终占据主导地位。如图6所示,基于MAI对扩张类型进行划分(表1),尽管用不同颜色展示扩张程度由小到大的新增斑块,但内填式(MAI∈[0, 0.5))与边缘式(MAI∈[0.5, 1))斑块在图上占据了大部分空间位置,相对而言,其它扩张程度较大类型的斑块不明显,特别是邻近式(MAI∈[1, 2)),在3个时段几乎很难辨识。这是由于研究区内各扩张类型所占面积导致,总体面积较大的扩张类型在图上表示明显,对城市空间形态变化影响显著,AWMMAI通过对斑块扩张程度进行面积加权平均,能定量地反映这种变化。然而,总体面积较小的扩张类型不应被忽视,因为它们也是构成城市扩张本质特征的一部分,例如,在武汉市1995~2000年间,扩张程度较大的斑块呈零星和不相连的方式出现,表现出非集约节约扩张特征,代表非精明增长的扩张方式,对评价城市扩张过程同样十分重要。因此,MMAI通过对某一时段所有斑块的扩张程度进行统计,能综合反映城市扩张的方式。由此可以验证,MMAI应被用于衡量城市扩张的程度,注重体现城市扩张的模式,而AWMMAI则应被用于描述城市形态的演变过程,两者各有侧重,且从结果来看,均符合实际情况。应注意的是,根据MAI的物理意义,邻近式在图上不明显恰恰说明与原有斑块相距30~60 m的斑块不多且不成规模,是武汉市这个时期内的一项扩张特征,其它研究区可能有截然不同结果。
图6 3个时段内MAI值的空间分布
Fig.6 The spatial distribution of MAI’s values in three periods
综上所述,3个时段内武汉市新增建设用地主要依附于建成区发展,但整个城市空间形态随着城市扩张活动的日益增强而趋向离散。武汉市1995~2010年间的城市用地朝着无序蔓延的方向演变,整体城市扩张过程没有达到集约节约利用的要求,以后应控制偏远地区零星建设用地的增长,促进非建设用地向建设用地的合理转变,更加切实地保护土地资源。
LEI(Landscape Expansion Index)已被广泛应用至城市扩张的研究中[20,21,22,23,24],可被看作描述景观扩张过程的指数中的代表。MAI和LEI同为利用缓冲区来测度多时点下景观格局扩张动态变化的空间指数,但与MAI相反,LEI值越小代表扩张程度越高。根据LEI的定义,LEI对距原有斑块超过缓冲区距离的新增斑块都赋予0值,且统称为跳跃式扩张类型。然而,如图3所示,新增斑块C~F与原有斑块的距离均超过了缓冲区距离
以武汉市1995~2010年间城市扩张为实例对此进行验证。假设LEI的缓冲区距离同为30 m,则参考表2,LEI值为0的新增斑块个数依次为3 138、3 051和7 857,比例约为38%,41%和48%,呈显著递增趋势。即LEI没有对数量与比例均占统治地位的偏远斑块扩张特征进行区分,MAI对此进行弥补和提升。实际中,剧烈的城市扩张过程必然导致大量偏远斑块的出现,不可忽视它们与原有斑块间空间关系的差异性对精确衡量城市景观格局演变的深刻影响。
此外,结合LEI和MAI对内填式和边缘式扩张类型的定义,可知LEI与MAI对内填式和边缘式扩张类型的识别是相同的。以武汉硚口区局部为例,基于2005~2010时段数据可视化比较MAI和LEI在的扩张类型识别如图7所示。传统跳跃式斑块被进一步区分,而LEI值在(0, 50]和(50, 100]与MAI值在[0.5, 1)和[0, 0.5)的斑块相同。
图7 研究区LEI和MAI在区分扩张类型的比较
Fig.7 Comparison of MAI and Landscape Expansion Index (LEI) in identifying expansion types
其它基于边界共享率的动态景观扩张指标(例如:指数
景观格局指数已被广泛应用于刻画城市空间扩张,但是目前缺少能够精确描述城市扩张过程连续渐变性质的空间指标,设计满足以全局城市景观数据为计算对象的景观扩张分析指标对于景观格局过程分析十分必要。本文提出MAI,详细地定量反映出新旧斑块间空间关系,更深层次地探究景观扩张程度,完善对景观扩张类型的识别,弥补现有测度方法对扩张程度较大的景观单元无法定量区分的不足,更清晰揭示城市景观扩张的变化特征。
MAI有以下优点:① MAI的值域是连续的,并可以反映斑块间的空间分布的渐变性,值越大意味着新增斑块的扩张程度越高;② 通过应用多阶缓冲区,MAI具有明确的物理意义,可以在一定程度上反映新旧斑块边界的最短距离;③ 基于MAI可识别景观扩张类型,并将原有的跳跃式扩张类型细分为邻近式,相间式,分离式和蔓延式,更清晰地在数值和可视化上反映出跳跃式斑块扩张程度的连续渐变性;④ MMAI和AWMMAI能够从自下而上的方式来代表全局城市扩张的动态过程。
运用MAI对武汉市3个时段(1995~2000年、2000~2005年、2005~2010年)城市扩张程度进行分析,得到以下结果:① 对景观扩张类型的辨识表明,新增城市斑块在空间上有更加离散的分布趋势,新增斑块扩张程度逐渐加深;② 分析缓冲区个数
The authors have declared that no competing interests exist.
| [1] |
1977~2008年延吉市城市景观格局演变 [J].
The evolvement and driving forces of urban landscape pattern in Yanji City in the past three decades were explored based on the theory of landscape ecology and the technology of remote sensing and GIS, using the multi-source interpreted data of topographic maps in 1977 and 1986, Landsat TM images in 1992 and 2001, and ALOS image in 2008. The indices chosen are the structure of urban landscape, the average area of patches, patch density, fractal dimension, isolation index, landscape diversity and evenness index. Taking GIS as a platform to integrate and analyze data, the driving forces are summarized together with the development of Yanji City. The results show that, the landscape pattern in Yanji City changed greatly from 1977 to 2008. The area of cultivated land and built-up land increased, while grassland and woodland decreased. The urban landscape diversity, landscape fractal dimension and evenness index were all increased. The reason of urban landscape pattern change is mainly by human activity. The growth of population and economy together with industrialization and urbanization were main forces for urban landscape pattern evolvement in Yanji City. The results can provide scientific evidence for ecological landscape design and urban development planning in other regions.
Evolvement of urban landscape pattern in Yanji City in 1977-2008 .
The evolvement and driving forces of urban landscape pattern in Yanji City in the past three decades were explored based on the theory of landscape ecology and the technology of remote sensing and GIS, using the multi-source interpreted data of topographic maps in 1977 and 1986, Landsat TM images in 1992 and 2001, and ALOS image in 2008. The indices chosen are the structure of urban landscape, the average area of patches, patch density, fractal dimension, isolation index, landscape diversity and evenness index. Taking GIS as a platform to integrate and analyze data, the driving forces are summarized together with the development of Yanji City. The results show that, the landscape pattern in Yanji City changed greatly from 1977 to 2008. The area of cultivated land and built-up land increased, while grassland and woodland decreased. The urban landscape diversity, landscape fractal dimension and evenness index were all increased. The reason of urban landscape pattern change is mainly by human activity. The growth of population and economy together with industrialization and urbanization were main forces for urban landscape pattern evolvement in Yanji City. The results can provide scientific evidence for ecological landscape design and urban development planning in other regions.
|
| [2] |
基于图谱特征的中国典型城市空间结构演变分析 [J].
基于地学信息图谱的方法论,选取中国典型经济快速发展的城市,对中国典型城市空间结构演变的现状进行分析。结合不同时期城市空间结构的图谱,探索城市化与城市空间结构演变的影响因素。通过对城市空间结构特征的理解和测度来把握城市空间结构的演变,总结在城市化背景下城市空间结构演变的时空规律,为城市未来健康、协调、有序发展提供服务。研究结果表明: ①城市空间结构是城市的自然环境、经济、土地利用和城市交通等各种要素在空间组织分布形式和相互作用的过程。②城市化过程中人口大量向城市转移,对城市空间结构演变的影响总体呈扩增的趋势。③地形、河流港湾、人口和经济发展等是影响城市空间结构主要的因素。④良好的城市交通网络结构是城市得以正常运转的前提,城市经济快速发展离不开高效的交通网络系统;在城市交通的空间结构的扩展特征上显现出多种发展结构,如同心圆带状结构、扇形结构等。⑤ 在地形、水系等自然条件一定的情况下,城市的空间结构是由土地利用与城市交通网络在城市空间地域上相互制约和相互协调形成的。
The evolution of spatial structure of typical cities in China on the basis of graph spectral features .
基于地学信息图谱的方法论,选取中国典型经济快速发展的城市,对中国典型城市空间结构演变的现状进行分析。结合不同时期城市空间结构的图谱,探索城市化与城市空间结构演变的影响因素。通过对城市空间结构特征的理解和测度来把握城市空间结构的演变,总结在城市化背景下城市空间结构演变的时空规律,为城市未来健康、协调、有序发展提供服务。研究结果表明: ①城市空间结构是城市的自然环境、经济、土地利用和城市交通等各种要素在空间组织分布形式和相互作用的过程。②城市化过程中人口大量向城市转移,对城市空间结构演变的影响总体呈扩增的趋势。③地形、河流港湾、人口和经济发展等是影响城市空间结构主要的因素。④良好的城市交通网络结构是城市得以正常运转的前提,城市经济快速发展离不开高效的交通网络系统;在城市交通的空间结构的扩展特征上显现出多种发展结构,如同心圆带状结构、扇形结构等。⑤ 在地形、水系等自然条件一定的情况下,城市的空间结构是由土地利用与城市交通网络在城市空间地域上相互制约和相互协调形成的。
|
| [3] |
The dimensions of global urban expansion: Estimates and Projections for all countries, 2000-2050 [J].https://doi.org/10.1016/j.progress.2011.04.001 URL [本文引用: 1] 摘要
Our study of the expansion of a representative sample of 30 cities showed that 28 of them expanded more than 16-fold during the twentieth century. More generally, cities are now expanding at twice their population growth rates, on average, and now cover almost 0.5% of the planet's land area. We created a new dataset comprising the universe of all 3646 named metropolitan agglomerations and cities that had populations in excess of 100,000 in the year 2000, their populations in that year, and their built-up area identified in the in 2000 to 770,00002km in 2030 and to 1,200,00002km in 2050. Containing this expansion is likely to fail. Minimal preparations for accommodating it – realistic projection of urban land needs, the extension of metropolitan boundaries, acquiring the rights-of-way for an arterial road grid that can carry infrastructure and public transport, and the selective protection of open space from incursion by formal and informal land development – are now in order.
|
| [4] |
The evolution of urban sprawl: Evidence of spatial heterogeneity and increasing land fragmentation [J].https://doi.org/10.1073/pnas.0705527105 URL [本文引用: 1] |
| [5] |
Are european cities becoming dispersed? A comparative analysis of 15 european urban areas [J].https://doi.org/10.1016/j.landurbplan.2005.02.003 URL [本文引用: 1] |
| [6] |
Quantifying the degree-of-freedom, degree-of-sprawl, and degree-of-goodness of urban growth from remote sensing data [J].https://doi.org/10.1016/j.apgeog.2009.08.001 URL [本文引用: 1] 摘要
Urban growth is a spatial and demographic process and refers to the increased importance of towns and cities as a concentration of population within a particular economy and society. Analysis of urban growth by using the historical and present data is an essentially performed operation in the urban geographic studies and for future planning. Urban growth can be mapped, measured and modelled by using remote sensing data and GIS techniques along with several statistical measures. In this study three temporal satellite images of 15 years interval (1975, 1990 and 2005) have been classified to determine the urban extent and growth of Kolkata-Howrah (West Bengal, India) in eight different directions within a circular region. Pearson's chi-square test and Shannon's entropy method have been applied to calculate the degree-of-freedom and degree-of-sprawl towards the analysis of urban growth. A new measure, degree-of-goodness, has also been proposed for the analysis of urban growth. The result shows that the city of Kolkata-Howrah has a high degree-of-freedom, high sprawl, and a negative goodness in urban growth. Apart from the derived results, this study also shows the potentials of remote sensing data and effectiveness of demonstrated/proposed models in urban geographic studies.
|
| [7] |
Development of a geospatial model to quantify, describe and map urban growth [J].https://doi.org/10.1016/S0034-4257(03)00074-9 URL [本文引用: 1] 摘要
In the United States, there is widespread concern about understanding and curbing urban sprawl, which has been cited for its negative impacts on natural resources, economic health, and community character. There is not, however, a universally accepted definition of urban sprawl. It has been described using quantitative measures, qualitative terms, attitudinal explanations, and landscape patterns. To help local, regional and state land use planners better understand and address the issues attributed to sprawl, researchers at NASA's Northeast Regional Earth Science Applications Center (RESAC) at The University of Connecticut have developed an urban growth model. The model, which is based on land cover derived from remotely sensed satellite imagery, determines the geographic extent, patterns, and classes of urban growth over time. Input data to the urban growth model consist of two dates of satellite-derived land cover data that are converted, based on user-defined reclassification options, to just three classes: developed, non-developed, and water. The model identifies three classes of undeveloped land as well as developed land for both dates based on neighborhood information. These two images are used to create a change map that provides more detail than a traditional change analysis by utilizing the classes of non-developed land and including contextual information. The change map becomes the input for the urban growth analysis where five classes of growth are identified: infill, expansion, isolated, linear branch, and clustered branch. The output urban growth map is a powerful visual and quantitative assessment of the kinds of urban growth that have occurred across a landscape. Urban growth further can be characterized using a temporal sequence of urban growth maps to illustrate urban growth dynamics. Beyond analysis, the ability of remote sensing-based information to show changes to a community's landscape, at different geographic scales and over time, is a new and unique resource for local land use decision makers as they plan the future of their communities.
|
| [8] |
Measuring urban sprawl and its drivers in large Chinese cities: The case of Hangzhou [J].https://doi.org/10.1016/j.landusepol.2012.07.018 URL [本文引用: 1] 摘要
This paper examines features and driving forces of urban sprawl in Hangzhou from 1995 to 2005 by using urban expansion classification, density analysis, spatial metrics, and geospatial analysis. We classified Hangzhou's urban development into three types: infilling, edge, and leapfrog growth, and used a leapfrog development index to indicate the extent of this type of urban expansion. We defined a sprawl index that takes both urban land expansion and population density into account to measure the magnitude of sprawl at the street-town level. Further, we employed landscape metrics to describe the change of spatial pattern of Hangzhou's urban expansion. To assess the inconsistency between actual urban expansion and planning, we compared the current urban land use with the latest urban land planning. Based on our findings, we identified features of urban sprawl of Chinese cities that are distinct from those identified in cities of western countries and discussed the role of critical policies that have affected urban sprawl in Hangzhou.
|
| [9] |
长株潭城市群核心区城镇景观空间扩张过程定量分析 [J].https://doi.org/10.1007/s11783-011-0280-z URL Magsci [本文引用: 1] 摘要
城镇扩张是城镇化过程最直接的表现,定量研究与揭示城镇空间扩张模式,对理解区域城镇化过程及城镇空间规划具有重要的意义。利用景观扩张指数定量研究了长株潭城市群核心区1993~2006 年城镇景观空间演化过程,揭示其城镇景观空间扩张规律。结果表明:① 研究时段内,城镇用地发展经过了凌乱分散的初级发展阶段后正趋向局部紧凑和区域布局合理;② 1993~2006 年间,长株潭城市群核心区城镇景观扩张主要是以边缘式增长为主,但是不同的时期,景观扩张表现出相异的空间扩张模式:1993~1996 年间,景观扩张方式主要是以边缘式和飞地式为主,这一阶段长株潭城市群核心区处于快速城镇化过程的初级阶段;1996~1998 年城镇化过程加快,这一阶段的城镇发展显得凌乱而分散,飞地式扩张明显;1998~2001 年处于快速城镇化发展的扩散阶段,以边缘式扩张为主;2001~2006 年间,处于快速城镇化的聚合阶段,城镇发展主要以边缘式和填充式为主;③ 长株潭城市群核心区在1993~2006 年间,其平均斑块扩张指数和面积加权平均斑块扩张指数都呈上升趋势,表明城镇景观扩张更趋于紧凑。
Jin Wenping et al. Quantitative analysis of the urban expansion models in Changsha-Zhuzhou-Xiangtan metroplan areas .https://doi.org/10.1007/s11783-011-0280-z URL Magsci [本文引用: 1] 摘要
城镇扩张是城镇化过程最直接的表现,定量研究与揭示城镇空间扩张模式,对理解区域城镇化过程及城镇空间规划具有重要的意义。利用景观扩张指数定量研究了长株潭城市群核心区1993~2006 年城镇景观空间演化过程,揭示其城镇景观空间扩张规律。结果表明:① 研究时段内,城镇用地发展经过了凌乱分散的初级发展阶段后正趋向局部紧凑和区域布局合理;② 1993~2006 年间,长株潭城市群核心区城镇景观扩张主要是以边缘式增长为主,但是不同的时期,景观扩张表现出相异的空间扩张模式:1993~1996 年间,景观扩张方式主要是以边缘式和飞地式为主,这一阶段长株潭城市群核心区处于快速城镇化过程的初级阶段;1996~1998 年城镇化过程加快,这一阶段的城镇发展显得凌乱而分散,飞地式扩张明显;1998~2001 年处于快速城镇化发展的扩散阶段,以边缘式扩张为主;2001~2006 年间,处于快速城镇化的聚合阶段,城镇发展主要以边缘式和填充式为主;③ 长株潭城市群核心区在1993~2006 年间,其平均斑块扩张指数和面积加权平均斑块扩张指数都呈上升趋势,表明城镇景观扩张更趋于紧凑。
|
| [10] |
Indices of landscape pattern [J].https://doi.org/10.1007/BF00162741 URL [本文引用: 1] |
| [11] |
Use and misuse of landscape índices [J].https://doi.org/10.1023/B:LAND.0000030441.15628.d6 URL [本文引用: 1] |
| [12] |
Spatial pattern analysis program for quantifying landscape structure [R]. |
| [13] |
The dynamics of global urban expansion [R]. |
| [14] |
Urban structure and growth [J].https://doi.org/10.1111/roes.2007.74.issue-2 URL [本文引用: 1] |
| [15] |
The spatiotemporal dynamics of rapid urban growth in the nanjing metropolitan region of China [J].https://doi.org/10.1007/s10980-007-9079-5 URL [本文引用: 1] 摘要
To better understand the spatio-temporal dynamics of the urban landscape of the Nanjing metropolitan region, China, we conducted a series of spatial analyses using remotely sensed data of 1979, 1988, 1998, 2000 and 2003. The results showed that the urban area as well as the growth rate increased significantly. Three urban growth types were distinguished: infilling, edge-expansion and spontaneous growth. The pattern of urban growth can be described as a ‘diffusion–coalescence’ phase transition. Although edge-expansion was the most common growth type, the spontaneous growth took a greater proportion in area and patch number than the infilling growth at the early stage, but its dominance decreased as urbanization proceeded from the diffusion phase to the coalescence phase. Hot-zones of urban growth and the distribution pattern of newly urbanized areas in different periods were studied with a buffering analysis. More than 80% of the growth area occurred within a zone of 1.402km wide outwards from the pre-growth urban fringes. The spatial distribution of newly urbanized areas in each period showed a uniform negative exponential decline relative to the distance from the edge of the urban patches. There existed an outward wave-like shifting of urban growth hot-zones, but the distance-growth area curves varied at different stages of urban growth. While a double-peaked pattern usually occurred in the diffusion phase, a single-peaked pattern was common in the coalescence phase.
|
| [16] |
A new landscape index for quantifying urban expansion using multi-temporal remotely sensed data [J].https://doi.org/10.1007/s10980-010-9454-5 URL [本文引用: 3] 摘要
Landscape metrics or indices have been commonly used for quantifying landscape patterns. However, most of these indices are generally focused on simple analysis and description of the...
|
| [17] |
Multi-order landscape expansion index: Characterizing urban expansion dynamics [J].https://doi.org/10.1016/j.landurbplan.2014.10.023 URL [本文引用: 2] 摘要
Most of the landscape metrics used in urban expansion studies are capable of reflecting the spatial characteristics for individual time points, but are not efficient to capture the integrated information from time series data. A few spatial metrics, for example, Landscape Expansion Index (LEI), are calculated based on two-time-point data. These metrics are insufficient for the analysis of urban expansion dynamics based on multi-temporal data. In this study, we propose an improved spatial metric, Multi-order Landscape Expansion Index (MLEI), to measure the expansion degree of newly grown urban patches by considering their relationships with old patches and their spatial context in the process of urban expansion. A case study is conducted in Wuhan, a fast-growing metropolis in central China, based on remote sensing images from three time points (2000, 2005 and 2010). The MLEI map in 2010 clearly shows the areas that have experienced expansive growth. The greatest difference between MLEI and LEI occurs where outlying clusters are formed gradually through time. Some spatial analysis methods are applied on the MLEI map in 2010 to delineate outlying urban clusters in urban expansion. The map of urban clusters clearly shows the spatial heterogenicity of urban expansion and the most expansive areas in Wuhan. This study suggests that MLEI is capable to capture multi-temporal information, and can be used to characterize the spatial structure of urban expansion dynamics.
|
| [18] |
中国城市扩张态势与驱动机理研究学派综述 [J].https://doi.org/10.11820/dlkxjz.2013.05.006 URL Magsci [本文引用: 1] 摘要
作为世界上最大的发展中国家,随着城市扩张问题的日益凸显,中国城市扩张研究也逐渐成为学术界关注的焦点.本文首先对国内外关于中国城市扩张速度与规模、模式与类型,以及城市空间结构演变的研究进行系统归纳;然后,在此基础上分别从经济学派、制度学派和经验学派的角度对中国城市扩张的驱动机理进行总结,并简要评述各学派研究的特点及局限性.笔者认为,中国的城市扩张具有明显的阶段性、区域性及等级性,即处于不同发展阶段不同区域的不同等级的城市表现出不同的扩张态势,其相应的扩张机理也不同.因此,关于中国城市扩张的后续研究应加强现阶段及长时间尺度研究,选取更具普适性案例,采用更加全面数据和综合的方法,注重不同学派视角的综合,对中国城市扩张进行更加全面与科学的研究.
Patterns, functions and underlying mechanisms of urban land expansion in Nanjing .https://doi.org/10.11820/dlkxjz.2013.05.006 URL Magsci [本文引用: 1] 摘要
作为世界上最大的发展中国家,随着城市扩张问题的日益凸显,中国城市扩张研究也逐渐成为学术界关注的焦点.本文首先对国内外关于中国城市扩张速度与规模、模式与类型,以及城市空间结构演变的研究进行系统归纳;然后,在此基础上分别从经济学派、制度学派和经验学派的角度对中国城市扩张的驱动机理进行总结,并简要评述各学派研究的特点及局限性.笔者认为,中国的城市扩张具有明显的阶段性、区域性及等级性,即处于不同发展阶段不同区域的不同等级的城市表现出不同的扩张态势,其相应的扩张机理也不同.因此,关于中国城市扩张的后续研究应加强现阶段及长时间尺度研究,选取更具普适性案例,采用更加全面数据和综合的方法,注重不同学派视角的综合,对中国城市扩张进行更加全面与科学的研究.
|
| [19] |
|
| [20] |
城市产业结构优化的纵向测度与横向诊断模型及应用——以北京市为例 [J].https://doi.org/10.11821/yj2010020015 URL [本文引用: 1] 摘要
优化、高效的城市产业结构是城市经济社会全面发展的必备条件。本文基于数据包络分析模型构建包括10个投入指标、4个产出指标的城市产业结构优化纵向测度指标体系,基于因子分析模型构建由1个目标层、4个标准层和16个指标层构成的城市产业结构优化横向诊断指标体系,并以北京市为例进行实证分析,旨在为城市产业结构优化升级、经济发展方式转变提供科学指导。研究表明:①改革开放30年来,北京市产业结构优化程度一直处于较高水平,仅1991、2004年出现资源过度投入而规模收益递减现象,1987、1995、1996年出现资源有效利用不足而规模收益递增现象;②产业效率、产业效益、产业科技、产业优势是影响北京市各区县产业结构优化程度的主要因子;③由于产业效率水平高且对产业结构优化的贡献大,北京市中心城区和近郊区的整体产业结构优化程度明显高于远郊区县;④北京市各区县在产业效率、产业效益、产业科技、产业优势等分项指标各具优劣,应通过差异化发展促进各区县乃至城市的产业结构优化升级。
Spatio-temporal assessment models and their application to urban industrial restructuring: A case study of Beijing City .https://doi.org/10.11821/yj2010020015 URL [本文引用: 1] 摘要
优化、高效的城市产业结构是城市经济社会全面发展的必备条件。本文基于数据包络分析模型构建包括10个投入指标、4个产出指标的城市产业结构优化纵向测度指标体系,基于因子分析模型构建由1个目标层、4个标准层和16个指标层构成的城市产业结构优化横向诊断指标体系,并以北京市为例进行实证分析,旨在为城市产业结构优化升级、经济发展方式转变提供科学指导。研究表明:①改革开放30年来,北京市产业结构优化程度一直处于较高水平,仅1991、2004年出现资源过度投入而规模收益递减现象,1987、1995、1996年出现资源有效利用不足而规模收益递增现象;②产业效率、产业效益、产业科技、产业优势是影响北京市各区县产业结构优化程度的主要因子;③由于产业效率水平高且对产业结构优化的贡献大,北京市中心城区和近郊区的整体产业结构优化程度明显高于远郊区县;④北京市各区县在产业效率、产业效益、产业科技、产业优势等分项指标各具优劣,应通过差异化发展促进各区县乃至城市的产业结构优化升级。
|
| [21] |
近30年来苏锡常城市增长形态过程与聚散规律 [J].
基于苏锡常地区多时相遥感数据,采用缓冲区分析方法和象限分位分析方法,并结合景观格局指数,定量比较苏州、无锡、常州城市建设用地近30 a来扩展过程,研究城市空间分散-集中的规律性,揭示城市增长空间模式特征。结果表明:1979~2006年间苏锡常城镇用地面积扩展巨大,3市扩展强度指数随圈层半径变化轨迹高度一致,扩展强度峰值约10 a向外推移2 km;苏锡常城镇扩展形态均呈分散-集中交替变化,但研究中未观测到完整周期;城市外部轮廊变化差异明显,以开发区为代表的政府干预行为主导城市扩展方向。苏州城市用地扩展主要集中在东片工业园区和南部城区,无锡城市用地各向扩展相对均衡,常州城市用地扩展主要集中在北部高新技术产业区及城东工业区。
Diffusion and aggregate process of urban pattern in Suzhou,Wuxi and Changzhou Cities over the recent 30 years .
基于苏锡常地区多时相遥感数据,采用缓冲区分析方法和象限分位分析方法,并结合景观格局指数,定量比较苏州、无锡、常州城市建设用地近30 a来扩展过程,研究城市空间分散-集中的规律性,揭示城市增长空间模式特征。结果表明:1979~2006年间苏锡常城镇用地面积扩展巨大,3市扩展强度指数随圈层半径变化轨迹高度一致,扩展强度峰值约10 a向外推移2 km;苏锡常城镇扩展形态均呈分散-集中交替变化,但研究中未观测到完整周期;城市外部轮廊变化差异明显,以开发区为代表的政府干预行为主导城市扩展方向。苏州城市用地扩展主要集中在东片工业园区和南部城区,无锡城市用地各向扩展相对均衡,常州城市用地扩展主要集中在北部高新技术产业区及城东工业区。
|
| [22] |
快速城市化进程中城市扩张对景观格局分异特征的影响 [J].https://doi.org/10.3969/j.issn.1674-5906.2011.01.002 URL [本文引用: 1] 摘要
在中国快速城市化背景下,大部分研究仅是单一的利用景观指数分析城市景观格局,往往只侧重于对景观斑块或格局的几何特征进行简单分析和描述,忽略了城市扩张与城乡景观格局动态变化过程之间的内部联系,研究城市扩张与城乡景观格局动态变化过程之间的内部联系对揭示城市化规律有着重要意义。文章以江苏省昆山市(县)范围为研究对象,基于全市1985—2008年间多期TM影像图,在采用遥感与地理信息系统相结合的技术方法获取昆山市景观格局动态变化以及相关景观生态学指数分析的基础上,探讨城市扩张对城乡景观格局的影响。结果表明:23年间自然景观类型的面积基本保持不变;人工景观面积显著增涨了4倍。斑块密度、景观斑块数量破碎度指数受人工景观类型影响基本呈上升趋势;斑块密度、景观破碎度、最大斑块、边缘密度等指数与建设用地增长之间存在明显相关性,表明城市扩张是城乡景观格局特征变化的重要驱动力。
Impacts of urban expansion on spatio-temporal variation of landscape patterns during rapid urbanization:A case study of Kunshan City .https://doi.org/10.3969/j.issn.1674-5906.2011.01.002 URL [本文引用: 1] 摘要
在中国快速城市化背景下,大部分研究仅是单一的利用景观指数分析城市景观格局,往往只侧重于对景观斑块或格局的几何特征进行简单分析和描述,忽略了城市扩张与城乡景观格局动态变化过程之间的内部联系,研究城市扩张与城乡景观格局动态变化过程之间的内部联系对揭示城市化规律有着重要意义。文章以江苏省昆山市(县)范围为研究对象,基于全市1985—2008年间多期TM影像图,在采用遥感与地理信息系统相结合的技术方法获取昆山市景观格局动态变化以及相关景观生态学指数分析的基础上,探讨城市扩张对城乡景观格局的影响。结果表明:23年间自然景观类型的面积基本保持不变;人工景观面积显著增涨了4倍。斑块密度、景观斑块数量破碎度指数受人工景观类型影响基本呈上升趋势;斑块密度、景观破碎度、最大斑块、边缘密度等指数与建设用地增长之间存在明显相关性,表明城市扩张是城乡景观格局特征变化的重要驱动力。
|
| [23] |
南京市区建设用地扩张模式、功能演化与机理 [J].https://doi.org/10.11821/dlyj201410010 URL [本文引用: 1] 摘要
以南京市区不同时段遥感影像为基础,在综合凸壳方法与公共边方法基础上,通过矩阵分析对1985-2007年南京市区建设用地扩张模式进行划分,探讨不同扩张模式的空间结构特征.结果表明:①1985年以来,南京市区建设用地扩张迅速.其中,填充扩张由主城区逐渐向外推移,飞地扩张分散在远离主城区的开发区、工业园及大学城内,蔓延扩张则介于二者之间,多表现为前期扩张的继续发展.②功能上,填充扩张由居住主导向居住与工业混合转变;蔓延扩张由居住与工业混合向工业主导转变;飞地扩张一直以工业主导,并伴随科教的区域性集中.③驱动机理,填充与蔓延扩张属于收益驱动型,飞地扩张更多地受成本制约.随着城市空间向外拓展,建设用地扩张的成本约束作用均逐渐加强;而城市建设用地中工业用地比重的增加,又使三种扩张模式的收益驱动作用加强.
Patterns, functions and underlying mechanisms of urban land expansion in Nanjing .https://doi.org/10.11821/dlyj201410010 URL [本文引用: 1] 摘要
以南京市区不同时段遥感影像为基础,在综合凸壳方法与公共边方法基础上,通过矩阵分析对1985-2007年南京市区建设用地扩张模式进行划分,探讨不同扩张模式的空间结构特征.结果表明:①1985年以来,南京市区建设用地扩张迅速.其中,填充扩张由主城区逐渐向外推移,飞地扩张分散在远离主城区的开发区、工业园及大学城内,蔓延扩张则介于二者之间,多表现为前期扩张的继续发展.②功能上,填充扩张由居住主导向居住与工业混合转变;蔓延扩张由居住与工业混合向工业主导转变;飞地扩张一直以工业主导,并伴随科教的区域性集中.③驱动机理,填充与蔓延扩张属于收益驱动型,飞地扩张更多地受成本制约.随着城市空间向外拓展,建设用地扩张的成本约束作用均逐渐加强;而城市建设用地中工业用地比重的增加,又使三种扩张模式的收益驱动作用加强.
|
| [24] |
基于改进景观扩张指数苏锡常地区城镇扩展空间形态变化 [J].
<p>针对目前景观扩张指数计算存在的问题,提出一种改进计算景观扩张指数的方法用于动态分析城镇空间形态变化特征。将景观格局的3 种增长模式:填充式、边缘式和飞地式分别表示为3 种拓扑关系:包含、相交及相离关系,通过判断新增城镇建设用地斑块之间的拓扑关系计算景观格局扩张的各项指数,据此对苏锡常地区1985~2008 年各阶段城镇扩展空间形态变化进行分析。从总体景观扩张模式的变化来看,苏锡常地区建设用地增长方式以边缘式的紧凑增长为主;从增长形态的空间位置来看,各市市区和各镇行政中心的增长形态基本可以归纳为以边缘式增长为主的紧凑增长形态,普通城镇则可能是紧凑增长形态或者蔓延增长形态。计算结果表明,改进的景观扩张指数方法能够动态的反映苏锡常地区城镇用地空间格局形态变化过程。进一步计算反映城镇用地分形特征的盒子维数作对比分析,从计算结果来看,随着时间推移苏锡常地区城镇用地分维数值逐渐增加,从1985 年的1.220 增加到2008 年的1.504,但增长幅度不大,说明城镇空间格局始终处于集中和均衡之间;而景观扩张指数计算结果反映,从1995 年飞地式增长模式的数量和分布开始增加之后,给城镇发展的主导的紧凑模式带来了扰动,这种扩散式的增长导致各城镇扩张的结果在空间形态上出现与总体趋势分异的现象。新建设用地的增长点引起了城镇空间结构的变化,这种发展增加了城镇空间形态的随机性和结构的不稳定性,这个结果可以作为前述盒子维数计算结果的补充,说明景观扩张指数可以解释分形这种形态结果的空间变化过程;并且通过计算景观扩张指数,决策者可以了解城镇扩展空间形态的变化趋势,从而从宏观上控制城镇的无序蔓延。</p>
Urban spatial morphology evolution in Suzhou-Wuxi-Changzhou region based on improved landscape expansion index .
<p>针对目前景观扩张指数计算存在的问题,提出一种改进计算景观扩张指数的方法用于动态分析城镇空间形态变化特征。将景观格局的3 种增长模式:填充式、边缘式和飞地式分别表示为3 种拓扑关系:包含、相交及相离关系,通过判断新增城镇建设用地斑块之间的拓扑关系计算景观格局扩张的各项指数,据此对苏锡常地区1985~2008 年各阶段城镇扩展空间形态变化进行分析。从总体景观扩张模式的变化来看,苏锡常地区建设用地增长方式以边缘式的紧凑增长为主;从增长形态的空间位置来看,各市市区和各镇行政中心的增长形态基本可以归纳为以边缘式增长为主的紧凑增长形态,普通城镇则可能是紧凑增长形态或者蔓延增长形态。计算结果表明,改进的景观扩张指数方法能够动态的反映苏锡常地区城镇用地空间格局形态变化过程。进一步计算反映城镇用地分形特征的盒子维数作对比分析,从计算结果来看,随着时间推移苏锡常地区城镇用地分维数值逐渐增加,从1985 年的1.220 增加到2008 年的1.504,但增长幅度不大,说明城镇空间格局始终处于集中和均衡之间;而景观扩张指数计算结果反映,从1995 年飞地式增长模式的数量和分布开始增加之后,给城镇发展的主导的紧凑模式带来了扰动,这种扩散式的增长导致各城镇扩张的结果在空间形态上出现与总体趋势分异的现象。新建设用地的增长点引起了城镇空间结构的变化,这种发展增加了城镇空间形态的随机性和结构的不稳定性,这个结果可以作为前述盒子维数计算结果的补充,说明景观扩张指数可以解释分形这种形态结果的空间变化过程;并且通过计算景观扩张指数,决策者可以了解城镇扩展空间形态的变化趋势,从而从宏观上控制城镇的无序蔓延。</p>
|

/
| 〈 |
|
〉 |

