
Land Use/Cover Change and Its Eco-environment Effect in the Main Stream of Tarim River
Received date: 2011-03-06
Request revised date: 2011-07-29
Online published: 2012-02-20
Copyright
Combined the integrated technology of ecological quantity analytical method with GIS technology, based on the MSS images in 1973, TM images in 1990 and 2000, CBERS images in 2005 and the land use data of 1983, the changes of land use/cover were analyzed in this paper in the main stream of Tarim River from 1973 to 2005. The results showed that the areas of farmland and residential land increased 25.72×10⁴ hm2, 17.33×10⁴ hm2 and 0.51×10⁴ hm2 while the areas of grassland, forest and wetland decreased 29.10×10⁴ hm2, 8.63×10⁴ hm2 and 5.84×10⁴ hm2 respectively. Land use change underwent a process of obvious change - slow change - obvious change - tremendous change in 1973-1983, 1983-1990, 1990-2000, and 2000-2005. The major patterns of land use change were the conversions of grassland, forest and wetland to farmland, farmland to residential land, and grassland to unused land. The main eco-environmental effects by land use/cover change in the mainstream of Tarim River were as following: Land use/cover change caused water environmental degradation, soil physicochemical properties change, severe degradation of the natural vegetation, soil salinization, land desertification, wetlands area reduction and loss of biodiversity.
ZHAO Rui-feng , JIANG Peng-hui , CHEN Ya-ning , SHI Pei-ji , PAN Jing-hu , ZHAO Hai-li . Land Use/Cover Change and Its Eco-environment Effect in the Main Stream of Tarim River[J]. SCIENTIA GEOGRAPHICA SINICA, 2012 , 32(2) : 244 -250 . DOI: 10.13249/j.cnki.sgs.2012.02.244
Fig.1 Location of the study area in the Tarim River basin图1 研究区位置示意图 |
Fig. 2 Land use/land cover pattern in the main stream of Tarim River in 1973,1983,1990,2000 and 2005图2 1973年、1983年、1990年、2000年和2005年塔里木河干流区年土地利用/覆被空间分布 |
Fig. 3 Area change of land use and dynamic degree of land use types at various stages in the main stream of Tarim River from 1973 to 2005图3 塔里木河干流区1973~2005年不同时期的土地利用变化和土地利用类型动态度 |
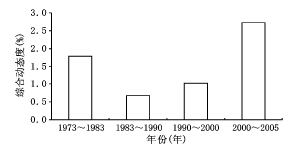
Fig.4 The indices of land use dynamic degree in the main stream of Tarim River from 1973 to 2005图4 塔里木河干流区土地利用类型综合动态度 |
Table 1 Transition matrix of land use in the main stream of Tarim River from 1973 to 2005表1 塔里木河干流区1973~2005年土地利用类型转换矩阵(104 hm2) |
| 1973年 | ||||||||
|---|---|---|---|---|---|---|---|---|
| 1983年 | 耕地 | 林地 | 草地 | 湿地 | 居工地 | 未利用地 | 合计 | |
| 耕地 | 10.62 | 0.63 | 2.03 | 0.13 | 0.15 | 0.06 | 13.62 | |
| 林地 | 1.86 | 27.67 | 39.38 | 1.88 | 0.04 | 6.39 | 77.21 | |
| 草地 | 5.72 | 22.33 | 109.95 | 5.20 | 0.05 | 48.18 | 191.44 | |
| 湿地 | 0.45 | 1.64 | 7.75 | 8.52 | 0.01 | 2.13 | 20.51 | |
| 居工地 | 0 | 0.01 | 0.01 | 0 | 0.37 | 0 | 0.39 | |
| 未利用地 | 0.14 | 3.13 | 33.14 | 0.31 | 0 | 69.55 | 106.27 | |
| 合计 | 18.79 | 55.40 | 192.26 | 16.05 | 0.62 | 126.31 | 409.43 | |
| 1983年 | ||||||||
| 1990年 | 耕地 | 林地 | 草地 | 湿地 | 居工地 | 未利用地 | 合计 | |
| 耕地 | 18.63 | 0.06 | 0.07 | 0.02 | 0.02 | 0 | 18.79 | |
| 林地 | 0.22 | 45.83 | 7.29 | 1.44 | 0 | 0.62 | 55.40 | |
| 草地 | 0.39 | 2.62 | 179.71 | 1.75 | 0 | 7.79 | 192.26 | |
| 湿地 | 0.03 | 0.65 | 3.83 | 11.18 | 0 | 0.35 | 16.05 | |
| 居工地 | 0 | 0 | 0 | 0 | 0.62 | 0 | 0.62 | |
| 未利用地 | 0.03 | 0.11 | 1.31 | 0.80 | 0 | 124.06 | 126.31 | |
| 合计 | 19.30 | 49.28 | 192.21 | 15.19 | 0.64 | 132.83 | 409.43 | |
| 1990年 | ||||||||
| 2000年 | 耕地 | 林地 | 草地 | 湿地 | 居工地 | 未利用地 | 合计 | |
| 耕地 | 17.55 | 0.34 | 1.18 | 0.11 | 0.06 | 0.06 | 19.30 | |
| 林地 | 0.72 | 29.51 | 16.40 | 0.98 | 0 | 1.67 | 49.28 | |
| 草地 | 5.54 | 14.79 | 153.63 | 3.92 | 0.01 | 14.32 | 192.21 | |
| 湿地 | 0.08 | 2.07 | 2.72 | 9.54 | 0 | 0.78 | 15.19 | |
| 居工地 | 0 | 0.01 | 0 | 0 | 0.63 | 0 | 0.64 | |
| 未利用地 | 1.08 | 2.19 | 14.74 | 0.28 | 0 | 114.53 | 132.83 | |
| 合计 | 24.97 | 48.90 | 188.67 | 14.83 | 0.69 | 131.37 | 409.43 | |
| 2000年 | ||||||||
| 2005年 | 耕地 | 林地 | 草地 | 湿地 | 居工地 | 未利用地 | 合计 | |
| 耕地 | 23.63 | 0.37 | 0.55 | 0.20 | 0.17 | 0.06 | 24.97 | |
| 林地 | 3.17 | 31.69 | 11.29 | 1.59 | 0.01 | 1.15 | 48.90 | |
| 草地 | 11.30 | 12.95 | 140.18 | 3.78 | 0.03 | 20.43 | 188.67 | |
| 湿地 | 0.44 | 1.73 | 5.08 | 7.44 | 0 | 0.14 | 14.83 | |
| 居工地 | 0 | 0 | 0 | 0.01 | 0.68 | 0 | 0.69 | |
| 未利用地 | 0.80 | 1.37 | 25.72 | 1.65 | 0 | 101.82 | 131.37 | |
| 合计 | 39.34 | 48.11 | 182.81 | 14.67 | 0.89 | 123.60 | 409.43 | |
Fig. 5 Water resources consumption of Tarim River in different periods图5 塔里木河干流区各时段耗水量 |
The authors have declared that no competing interests exist.
| [1] |
|
| [2] |
|
| [3] |
|
| [4] |
|
| [5] |
|
| [6] |
|
| [7] |
|
| [8] |
|
| [9] |
|
| [10] |
|
| [11] |
|
| [12] |
|
| [13] |
|
| [14] |
|
| [15] |
|
| [16] |
|
| [17] |
|
| [18] |
|
| [19] |
|
| [20] |
|
| [21] |
|
| [22] |
|
/
| 〈 |
|
〉 |


