
Industrial Environmental Efficiency of Costal Economic Belt in Liaoning Province
Received date: 2011-06-21
Request revised date: 2012-02-09
Online published: 2012-03-25
Copyright
Environmental efficiency is an essential element of eco-efficiency because of its important role in the evaluation of the level of regional green development. Taking the heavy industrial base in Northeast China, Liaoning coastal economic belt, as the study area, this article measures its industrial environmental efficiency and identified factors′ significant function on the transformation of environmental efficiency. In this study, the data envelope analysis (DEA) and stochastic frontier analysis (SFA) are employed in the computation of industrial environmental efficiency of Liaoning costal economic belt over the period of 2001-2009. Then, this study builds a multiple linear regression using Tobit model to identify factors that influence industrial environmental efficiency. The results indicate that, in 2001-2009, Liaoning costal industrial environmental efficiency improved from 0.15 to 0.44, but there was still a gap compared with ideal production status. Industrial environmental efficiencies of the 6 cities in this area were quite different. Panjin had the highest industrial environmental efficiency and Dandong the lowest. Dalian had the best output elasticity as its industrial growth was promoted mostly by the increase of labor force, and had the least reliance upon environmental cost. However, the growth of industrial economy in the cities of Dandong, Yingkou and Huludao still had strong dependence on the increase of environmental cost. There were 4 factors acting on environmental efficiency significantly. They were proportion of heavy industry, capital-labor ratio, proportion of hi-tech industry and citizens′ living standard. The increase of heavy industrial proportion and capitalization reduced industrial environmental efficiency. The development of hi-tech industry also decreased environmental efficiency as it focused on equipment manufacturing and petrochemical industry which produce large amount of waste. Progress of citizens′ living standard increased environmental efficiency for citizens not only demanded more industrial products but also requested better surviving environment. Other factors like ownership, production scale, foreign investment, environmental management did not have significant function. The environmental efficiency did not decrease or increase with the reduction of proportion of nation-owned enterprises or large enterprises. The fast augmentation of foreign investment did not pull up environmental efficiency as expected. As the management of environmental quality did not perform continually, it is not useful in the increase of environmental efficiency. In the future industrial development, in order to raise environmental efficiency, Liaoning coastal economic belt should impair the share of heavy industry, develop the hi-tech industry scientifically without causing more severe environmental problems, introduce foreign investment more prudently without bringing in more pollution and strengthen environmental control.
TONG Lian-jun , SONG Ya-nan , HAN Rui-ling , LI Ming-sheng . Industrial Environmental Efficiency of Costal Economic Belt in Liaoning Province[J]. SCIENTIA GEOGRAPHICA SINICA, 2012 , 32(3) : 294 -300 . DOI: 10.13249/j.cnki.sgs.2012.03.294
Table 1 Candidate models and testing results of SFA表1 SFA备选模型与检验结果 |
| 备选模型设定 | 模型检验 | ||||||
|---|---|---|---|---|---|---|---|
| 条件 | 自变量数 | 参照模型 | 对数似然函数 | LR | 似然比检验 | Gamma | |
| 模型1 | 无 | 20 | - | 20.02 | - | - | 0.002 |
| 模型2 | αjl=0(j≠l),βkm=0(k≠m) | 16 | 1 | 23.94 | -7.88 | 接受 | 0.031 |
| 模型3 | αjl=0(j≠l),βkm=0(k≠m),δj,k=0 | 10 | 2 | 32.46 | -17.05 | 接受 | 0.918 |
| 模型4 | αjl=0,βkm=0, | 11 | 2 | 13.18 | 21.52 | 拒绝 | 0.002 |
| 模型5 | αjl=0,βkm=0,δj,k=0 | 5 | 4 | 0.04 | 26.27 | 拒绝 | 0.205 |
| 模型6 | δj,k=0 | 14 | 1 | 31.31 | -22.56 | 接受 | 0.575 |
| 模型7 | αjl=0(j=l),βkm=0(k=m),δj,k=0 | 9 | 6 | 26.1 | 10.41 | 接受 | 0.547 |
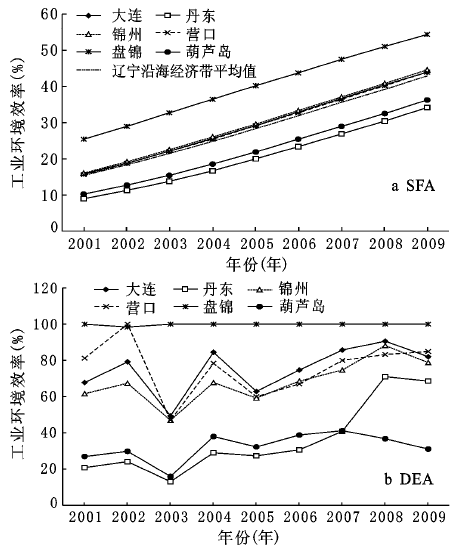
Fig. 1 Industrial environmental efficiency of the 6 cities in Liaoning coastal economic belt图1 辽宁沿海经济带6市工业环境效率 |
Table 2 Output elasticity for each input of the 6 cities in Liaoning coastal economic belt表2 辽宁沿海6市不同投入的产出弹性 |
| 大连 | 丹东 | 锦州 | 营口 | 盘锦 | 葫芦岛 | |
|---|---|---|---|---|---|---|
| 传统投入 | 1.85 | 0.17 | 0.49 | 0.02 | 0.72 | 0.59 |
| 固定资产 | 0.30 | 0.24 | 0.25 | 0.26 | 0.28 | 0.26 |
| 劳动力 | 1.56 | -0.07 | 0.25 | -0.24 | 0.44 | 0.33 |
| 环境投入 | -0.07 | 0.25 | 0.18 | 0.04 | 0.26 | 0.67 |
| 废水 | -0.02 | 0.17 | 0.18 | 0.19 | 0.25 | 0.21 |
| 废气 | 0.10 | 0.24 | 0.17 | 0.10 | 0.25 | 0.15 |
| 固体废弃物 | -0.15 | -0.16 | -0.16 | -0.25 | -0.24 | 0.32 |
The authors have declared that no competing interests exist.
| [1] |
|
| [2] |
|
| [3] |
|
| [4] |
|
| [5] |
|
| [6] |
|
| [7] |
|
| [8] |
|
| [9] |
|
| [10] |
|
| [11] |
|
| [12] |
|
| [13] |
|
| [14] |
|
| [15] |
|
| [16] |
辽宁省统计局.辽宁统计年鉴[M].北京:中国统计出版社,2002~2010.
|
| [17] |
|
| [18] |
|
| [19] |
|
| [20] |
|
| [21] |
|
/
| 〈 |
|
〉 |