
Probabilistic Community-based Typhoon Disaster Risk Assessment: A Case of Fululi Community, Shanghai
Received date: 2011-03-10
Request revised date: 2011-06-03
Online published: 2012-03-25
Copyright
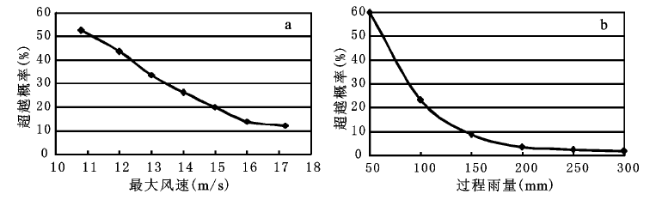
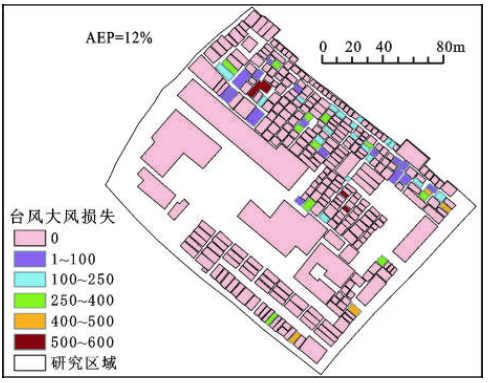
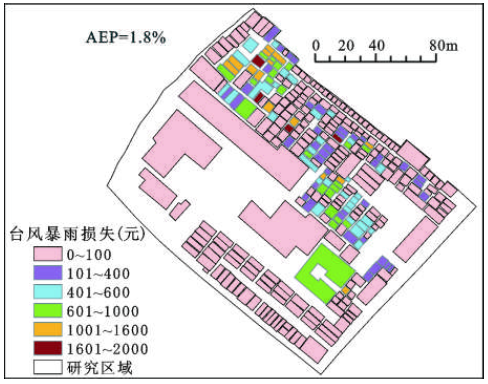
Intense tropic cyclones, one of the major natural hazards prevailing in Shanghai, cause significant social and economic losses almost every year. In this paper, probabilistic community-based risk assessment is carried out, taking Fululi community of Yangpu District, Shanghai, for an example. The annual exceedance probabilities of the maximum wind speed and accumulated rainfall are calculated based on Shanghai tropic cyclone meteorological data in 1949-2008. Combined with the data interpreted from 4 m resolution aerial photograph acquired in 2006, relief altitude difference data measured by leveling, and damage and loss data by tropic cyclones from in situ investigations, questionnaires and interviews in Fululi, the hazards, elements at risk, and risk under specific scenarios are assessed. The result shows: 1) The annual exceedance probability of maximum wind speed 17.2 m/s is 12%. The largest accumulated rainfall during one typhoon process is 306 mm, and its annual exceedance probability is 1.8%. 2) On the scenario of 12% AEP of maximum wind speed, there are 52 (or 15.3%) buildings with losses in Fululi. 34 of the 52 buildings have losses between 0-100 yuan (RMB), 11 buildings have losses between 150- 200 yuan, 4 have loss of 300 yuan, 1 has loss of 500 yuan, and 2 have loss of 600 yuan. 47 of these, covering more than 90%, are residence buildings. There are 7 buildings with strong wind losses larger than 250 yuan, of which 5 belong to old masonry-timber structure and other 2 buildings belong to old brick-masonry structure. 3) On the scenario of accumulated rainfall AEP equal to 1.8%, the deepest inundation depth is 0.61 m in Fululi. There are 115 (or 33.8 %) buildings that have losses by rainstore, and all these buildings are for residence. Of the 115 buildings, 11 have losses between 0-200 RMB yuan; 55 have losses between 200-500 yuan; 31, 500-1 000 yuan; 13, 1000-1500 yuan; and 5, around 2000 yuan. Most of the buildings, covering 77.8 %, with losses larger than 500 yuan are old brick-masonry structure and old masonry-timber structure. According to the investigations, the water depth less than 5 cm causes little damage and loss of the resident properties. When the water depth reaches 15 cm, it will lead to some losses, and if the water depth is larger than 30 cm, it will cause relatively larger losses. Though the strong wind and accumulated rainfall induced losses are not as serious as a big disaster to the residents there, i.e., the risk is acceptable, but it is necessary to make emergency planning to cope with more serious extreme events in future.
Key words: Key Words: typhoon; probabilistic risk; participator GIS; community; Shanghai
WEN Jia-hong , HUANG Hui , CHEN Ke , YE Xin-liang , HU Heng-zhi , HUA Zhen-yang . Probabilistic Community-based Typhoon Disaster Risk Assessment: A Case of Fululi Community, Shanghai[J]. SCIENTIA GEOGRAPHICA SINICA, 2012 , 32(3) : 348 -355 . DOI: 10.13249/j.cnki.sgs.2012.03.348
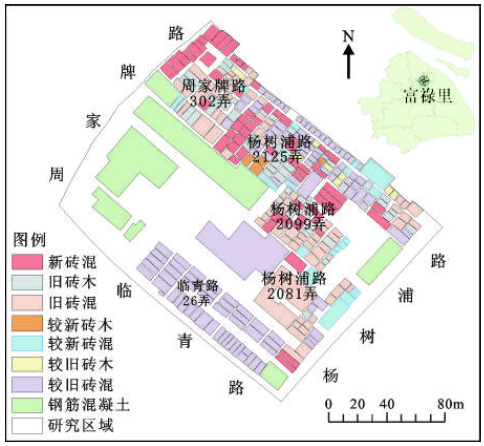
Fig. 1 A sketch map of the study area图1 研究区 |
Fig.2 Relation of annual exceeding probability with the maximum wind speed (a) and the accumulated rainfall (b) of typhoon in Shanghai urban region over the recent 60 year图2 近60 a影响上海市区的台风年最大风速-超越概率(a)和年最大过程雨量-超越概率(b)关系 |
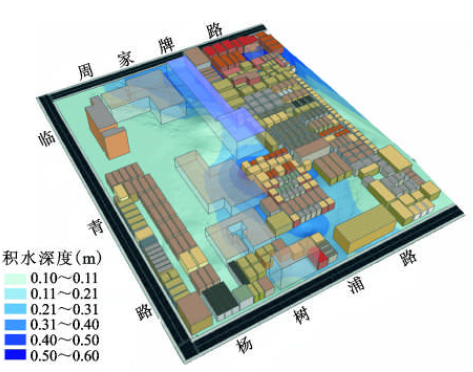
Fig.3 Inundation depth at 1.8% AEP of accumulated rainfall in a typhoon process图3 台风过程雨量在AEP为1.8%情景下的地面积水深度(m) |
Table 1 Building under structure classification表1 按建筑结构分类的建筑物统计表 |
| 建筑结构 | 数量(幢) | 占总数比例(%) |
|---|---|---|
| 新砖混结构 较新砖混结构 较旧砖混结构 旧砖混结构 较新砖木结构 较旧砖木结构 旧砖木结构 钢筋混凝土结构 | 67 21 113 77 4 8 43 7 | 19.7 6.2 33.2 22.7 1.1 2.4 12.7 2.1 |
Table 2 Building step/doorsill heights表2 建筑物台阶/门槛高度统计表 |
| 台阶/门槛高度(m) | 数量(幢) | 占总数比例(%) |
|---|---|---|
| 0 0~0.1 0.1~0.2 0.2~0.3 0.3~0.5 >0.5 | 4 72 124 48 77 15 | 1.1 21.1 36.7 14.1 22.6 4.4 |
Fig.4 Building loss distribution at 12% AEP of the maximum wind speed图4 台风最大风速在AEP为12%情景下的建筑物损失分布 |
Table 3 Inundation depth inside buildings and main distribution areas表3 积水淹入建筑物内深度及主要分布区域 |
| 积水淹入建筑物 内深度(m) | 数量 (幢) | 主要分布区域 |
|---|---|---|
| 0~0.05 0.05~0.1 0.1~0.15 0.15~0.2 0.2~0.3 0.3~0.6 | 24 7 14 32 23 29 | 周家牌路302弄、杨树浦路2 125弄 周家牌路302弄 杨树浦路2 099弄 周家牌路302弄、杨树浦路2 099 弄、杨树浦路2 125弄 杨树浦路2 099弄 周家牌路302弄、杨树浦路2 099弄 |
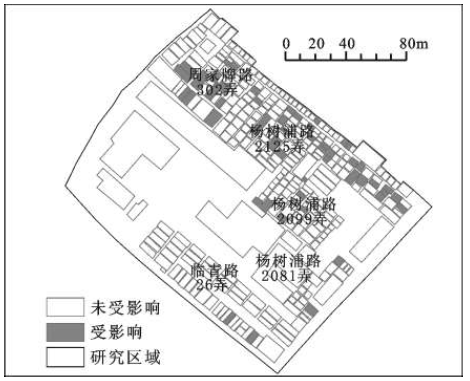
Fig. 5 Disaster risk distribution of strong wind induced by typhoon at 12% AEP of the maximum wind speed图5 AEP为12 %情景下的台风大风灾害风险分布 |
Fig.6 Disaster risk distribution of rainstorm induced by typhoon at 1.8% AEP of the accumulated rainfall图6 AEP为1.8%情景下的台风暴雨灾害风险分布 |
The authors have declared that no competing interests exist.
| [1] |
|
| [2] |
|
| [3] |
|
| [4] |
|
| [5] |
|
| [6] |
|
| [7] |
|
| [8] |
|
| [9] |
|
| [10] |
|
| [11] |
|
| [12] |
|
| [13] |
|
| [14] |
|
| [15] |
|
| 16 |
Return period [DB/CI]accessed December 29, 2009.
|
| [17] |
What is flood recurrence interval? [DB/CI]accessed December29,2009.
|
| [18] |
|
| [19] |
|
| [20] |
|
| [21] |
|
| [22] |
|
| [23] |
|
| [24] |
|
| [25] |
|
| [26] |
国家海洋局. 2005
|
| [27] |
|
| [28] |
|
| [29] |
|
| [30] |
|
| [31] |
|
| [32] |
|
/
| 〈 |
|
〉 |