
The Measurement of Industrial Agglomeration Level of Chinese Mineral Resource
Received date: 2012-01-04
Request revised date: 2012-05-08
Online published: 2012-07-13
Copyright
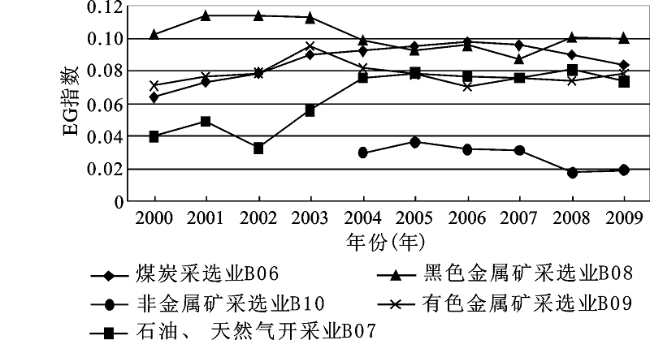
The Ellison-Glaeser (EG) index and the CR5 index were used to give a dynamic calculation and analysis of the industrial agglomeration level of China in the article based on the data of five branches of China′s mineral resources industry, which conclued the coal industry, oil and gas industry, non-metal industry, ferrous metal industry and non-ferrous metal industry from 2000 to 2009. The results showed that during 2001 to 2009, the mineral resources industry on the whole had developed to a relatively high level but at a relatively slow speed. The EG index of the four branches of the mineral resources industry was calculated as above 0.05 in 2009 except for that of the non-metal mineral industry; the five branches′ CR5 index presented an apparent agglomeration, which held at a level of 0.6 in most conditions. The oil and gas industry had the highest average value of 0.657, and the lowest was the non-metal mineral industry, which was only 0.512. On the other hand, from an industrial perspective, the calculation results of the EG index revealed great differences in agglomeration level and uneven developments among the five mineral resources branches. The branch which was heading for the top position of the EG index was the ferrous metal industry with an average value of 0.102 , which was five times as that of the non-metal industry. The coal industry came in at second and the nonferrous metal industry and oil and gas industry were at No.3 and No.4. The last position was held by the non-metal industry with an average value of only 0.028, which was the only mineral resources industry that did not present a high agglomeration level. In addition, there were some differences in the variable range of agglomeration levels among the five mineral resources industries. In contrast, the oil and gas industry had the maximal increase slope of 85.17%, while the non-metal mineral industry′s development was comparatively slow, which had presented an evident decline since 2008. The slow or negative increase slope would make high agglomeration levels hard to sustain. However, the CR5 index showed that the difference among the five branches of the mineral resources industry was relatively small. All five industries presented relatively low or negative increase amplitude; the coal industry was the biggest among the industries at only 4.41%. The reason being that the non-metal mineral enterprises of the first five ones in turnover, enjoyed a geographical agglomeration resulting in the non-metal mineral industry showing a high agglomeration level. This narrowed the differences of agglomeration levels between this and the other branches.
Key words: mineral resources industry; industry agglomeration; EG index
XIE Li , CHEN Ying , LIU Wen-juan . The Measurement of Industrial Agglomeration Level of Chinese Mineral Resource[J]. SCIENTIA GEOGRAPHICA SINICA, 2012 , 32(8) : 965 -970 . DOI: 10.13249/j.cnki.sgs.2012.08.965
Table 1 EG index of five major mineral resources industries in China表1 中国矿产资源五大行业EG指数 |
| 年份(年) | 煤炭采选业 B06 | 石油、天然气 开采业B07 | 黑色金属矿 采选业B08 | 有色金属矿 采选业B09 | 非金属矿 采选业B10 |
|---|---|---|---|---|---|
| 2000 | 0.064 | 0.040 | 0.102 | 0.071 | |
| 2001 | 0.073 | 0.049 | 0.114 | 0.077 | |
| 2002 | 0.079 | 0.033 | 0.114 | 0.079 | |
| 2003 | 0.090 | 0.056 | 0.113 | 0.095 | |
| 2004 | 0.092 | 0.076 | 0.099 | 0.082 | 0.030 |
| 2005 | 0.095 | 0.079 | 0.093 | 0.078 | 0.036 |
| 2006 | 0.098 | 0.077 | 0.096 | 0.070 | 0.032 |
| 2007 | 0.096 | 0.076 | 0.087 | 0.076 | 0.031 |
| 2008 | 0.090 | 0.081 | 0.101 | 0.074 | 0.018 |
| 2009 | 0.084 | 0.074 | 0.100 | 0.078 | 0.019 |
| 平均值 | 0.086 | 0.064 | 0.102 | 0.078 | 0.028 |
| 2000~2009年变化率(%) | 30.70% | 85.17% | -2.26% | 8.73% | -37.33% |
注:由于2001~2004年《中国工业经济统计年鉴》未统计非金属采选业数据,故表中有关数据缺失。 |
Fig.1 Mineral resources industries agglomeration level in 2000-2009 in China图1 2000~2009年中国矿产资源产业空间集聚水平变化 |
Table 2 CR5 index of mineral resources industries表2 矿产资源产业五省市行业集中度 |
| 年份(年) | 煤炭采选业B06 | 石油、天然气 开采业B07 | 黑色金属矿 采选业B08 | 有色金属矿 采选业B09 | 非金属矿 采选业B10 |
|---|---|---|---|---|---|
| 2000 | 0.587 | 0.717 | 0.656 | 0.627 | |
| 2001 | 0.609 | 0.685 | 0.651 | 0.607 | |
| 2002 | 0.626 | 0.663 | 0.634 | 0.606 | |
| 2003 | 0.636 | 0.639 | 0.686 | 0.629 | |
| 2004 | 0.644 | 0.660 | 0.580 | 0.622 | 0.538 |
| 2005 | 0.647 | 0.655 | 0.601 | 0.620 | 0.546 |
| 2006 | 0.657 | 0.650 | 0.625 | 0.565 | 0.513 |
| 2007 | 0.648 | 0.644 | 0.606 | 0.586 | 0.509 |
| 2008 | 0.612 | 0.648 | 0.626 | 0.586 | 0.490 |
| 2009 | 0.613 | 0.612 | 0.646 | 0.630 | 0.479 |
| 平均值 | 0.629 | 0.657 | 0.632 | 0.608 | 0.512 |
| 2000~2009年变化率 | 4.41% | -14.59% | -1.04% | 0.45% | -10.94% |
数据来源:根据2001~2010年《中国工业经济统计年鉴》[28]整理。 |
The authors have declared that no competing interests exist.
| [1] |
|
| [2] |
|
| [3] |
|
| [4] |
|
| [5] |
|
| [6] |
|
| [7] |
|
| [8] |
|
| [9] |
|
| [10] |
|
| [11] |
|
| [12] |
|
| [13] |
|
| [14] |
|
| [15] |
|
| [16] |
|
| [17] |
|
| [18] |
|
| [19] |
|
| [20] |
|
| [21] |
|
| [22] |
|
| [23] |
|
| [24] |
|
| [25] |
|
| [26] |
|
| [27] |
国家统计局.中国统计年鉴[M].北京:中国统计出版社,2001~2010.
|
| [28] |
国家统计局.中国工业经济统计年鉴[M].北京:中国统计出版社,2001~2010.
|
| [29] |
|
| [30] |
|
/
| 〈 |
|
〉 |