
The Response of Ecosystem Services Value to Land Use Change in Keriya Oasis, Northern Slope of Kulun Mountain
Online published: 2012-09-20
Copyright
The effects of land use change on ecosystem services values and functions of Keriya Oasis in 1991-2008 were analyzed based on TM image data in 1991, 2002 and 2008, and using the evaluation methods of terrestrial ecosystem services value of China. Results showed that: 1) The total value of ecosystem services decreased from 1 442.248 million Yuan in 1991 to 1 287.163 million Yuan in 2008, the loss of total ecosystem service value was 10.8%, and net loss of yearly ecosystem service value was about 24.2 Yuan per hectare. The main causes of the decline of total ecosystem service value were the decrease of the total area of wetland and water body; 2) The overall rank order for each ecosystem function based on their contributions to overall value of ecosystem services was that the contribution of waste treatment function is the highest, then the soil formation, biodiversity protection, water supply, climate regulation, gas regulation, food production, the contribution of recreation and culture and raw material is the lowest; 3) The total ecosystem services value was relatively inelastic to the value coefficients, therefore, the estimation in this study area was robust in spite of uncertainties on the value coefficients.
WEI Bin . The Response of Ecosystem Services Value to Land Use Change in Keriya Oasis, Northern Slope of Kulun Mountain[J]. SCIENTIA GEOGRAPHICA SINICA, 2012 , 32(9) : 1148 -1154 . DOI: 10.13249/j.cnki.sgs.2012.09.1148
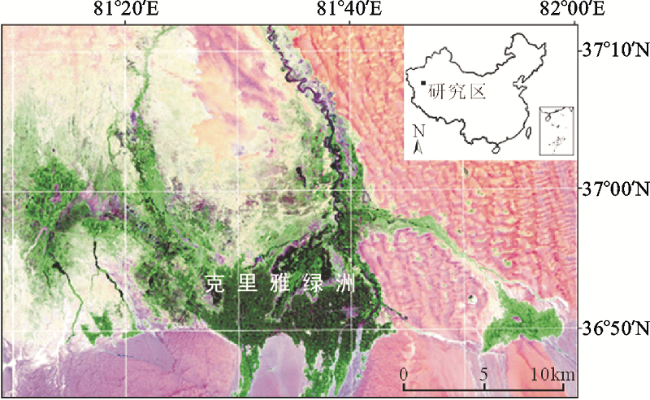
Fig.1 Location of Keriya Oasis图1 克里雅绿洲位置 |
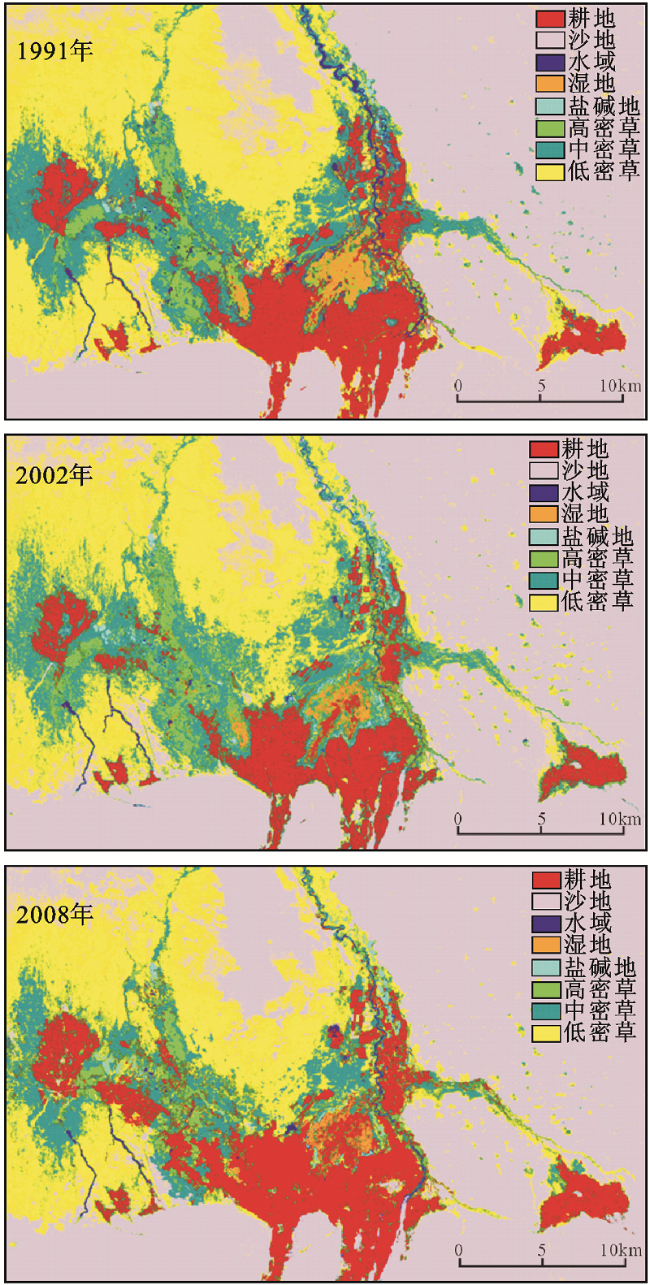
Fig.2 Land use of Keriya Oasis in 1991, 2002 and 2008图2 克里雅绿洲1991、2002与2008年土地利用 |
Table 1 The ecosystem services value of unit area in Keriya Oasis表1 克里雅绿洲生态系统单位面积生态服务价值 |
| 生态服务功能 | 生态服务价值[元/(hm2·a)] | |||||||
|---|---|---|---|---|---|---|---|---|
| 水域 | 湿地 | 沙地 | 盐碱地 | 高密草 | 中密草 | 低密草 | 耕地 | |
| 气体调价 | 0.0 | 1742.6 | 0.0 | 15.0 | 1161.7 | 774.5 | 387.3 | 484.0 |
| 气候调价 | 445.3 | 16554.4 | 0.0 | 0.0 | 1306.9 | 871.3 | 435.7 | 861.6 |
| 水源涵养 | 19749.1 | 15005.4 | 26.5 | 255.0 | 1161.7 | 774.5 | 387.3 | 580.9 |
| 土壤形成 | 9.7 | 1655.4 | 17.7 | 1.1 | 2831.7 | 1887.8 | 943.9 | 1413.4 |
| 废物处理 | 17619.3 | 17599.9 | 8.8 | 360.6 | 1902.3 | 1268.2 | 634.1 | 1587.7 |
| 生物多样性保护 | 2410.6 | 2420.2 | 300.8 | 21.0 | 1582.8 | 1055.2 | 527.6 | 687.3 |
| 食物生产 | 96.8 | 290.4 | 8.8 | 78.2 | 435.6 | 290.4 | 145.2 | 968.1 |
| 原材料 | 9.7 | 67.8 | 0.0 | 7.0 | 72.6 | 48.4 | 24.2 | 96.8 |
| 娱乐休闲 | 4201.5 | 5372.9 | 8.8 | 99.0 | 58.0 | 38.7 | 19.4 | 9.7 |
| 合计 | 44542.0 | 60709.1 | 371.4 | 836.9 | 10513.3 | 7009.0 | 3504.7 | 6689.5 |
Table 2 Land use change of Keriya Oasis in 1991-2008表2 克里雅绿洲1991~ 2008年间土地利用变化 |
| 土地利 用类型 | 1991年 | 2002年 | 2008年 | 1991~2002 | 2002~2008 | 1991~2008 | |||
|---|---|---|---|---|---|---|---|---|---|
| 面积 (hm2) | 比例 (%) | 面积 (hm2) | 比例 (%) | 面积 (hm2) | 比例 (%) | 面积 (hm2) | 面积 (hm2) | 面积 (hm2) | |
| 水域 | 2687 | 0.714 | 1833 | 0.487 | 1786 | 0.474 | -854 | -47 | -901 |
| 湿地 | 4997 | 1.327 | 3122 | 0.829 | 2398 | 0.637 | -1875 | -724 | -2599 |
| 沙地 | 194130 | 51.562 | 191774 | 50.936 | 190616 | 50.629 | -2356 | -1158 | -3514 |
| 盐碱地 | 1670 | 0.443 | 1554 | 0.413 | 1833 | 0.487 | -116 | 279 | 163 |
| 高密草 | 8256 | 2.193 | 9801 | 2.603 | 7925 | 2.105 | 1545 | -1876 | -331 |
| 中密草 | 46598 | 12.377 | 48930 | 12.996 | 48606 | 12.910 | 2332 | -324 | 2008 |
| 低密草 | 81051 | 21.528 | 83893 | 22.282 | 81430 | 21.628 | 2842 | -2463 | 379 |
| 耕地 | 37109 | 9.856 | 35591 | 9.454 | 41904 | 11.130 | -1518 | 6313 | 4795 |
| 合计 | 376498 | 100 | 376498 | 100 | 376498 | 100 | 0 | 0 | 0 |
Table 3 The ecosystem services value of Keriya Oasis in 1991, 2002 and 2008表3 克里雅绿洲1991、2002与2008年生态服务价值 |
| 水域 | 湿地 | 沙地 | 盐碱地 | 高密草 | 中密草 | 低密草 | 耕地 | 合计 | ||
|---|---|---|---|---|---|---|---|---|---|---|
| ESV (万元/a) | 1991 | 11968.4 | 30336.3 | 7210.0 | 139.8 | 8679.8 | 32660.5 | 28405.9 | 24824.1 | 144224.8 |
| 2002 | 8164.5 | 18953.4 | 7122.5 | 130.1 | 10304.1 | 34295.0 | 29402.0 | 23808.6 | 132180.2 | |
| 2008 | 7955.2 | 14558.0 | 7079.5 | 153.4 | 8331.8 | 34067.9 | 28538.8 | 28031.7 | 128716.3 | |
| 1991~2002 | (万元) | -3803.9 | -11382.9 | -87.5 | -9.7 | 1624.3 | 1634.5 | 996.1 | -1015.5 | -12044.6 |
| (%) | -31.8 | -37.5 | -1.2 | -6.9 | 18.7 | 5.0 | 3.5 | -4.1 | -8.4 | |
| 2002~2008 | (万元) | -209.3 | -4395.4 | -43 | 23.3 | -1972.3 | -227.1 | -863.2 | 4223.1 | -3463.9 |
| (%) | -2.6 | -23.2 | -0.6 | 17.9 | -19.14 | -0.7 | -2.9 | 17.7 | -2.6 | |
| 1991~2008 | (万元) | -4013.2 | -15778.3 | -130.5 | 13.6 | -348.0 | 1407.4 | 132.9 | 3207.6 | -15508.5 |
| (%) | -33.5 | -52.0 | -1.8 | 9.7 | -4.0 | 4.3 | 0.5 | 12.9 | -10.8 |
Table 4 The ecosystem service functions of Keriya Oasis in 1991, 2002 and 2008表4 克里雅绿洲1991、2002与2008年生态服务功能 |
| 生态服 务功能 | 1991年 | 2002年 | 2008年 | 综合 等级 | 趋势 | ||||||
|---|---|---|---|---|---|---|---|---|---|---|---|
| ESVf (万元/a) | (%) | 等级 | ESVf (万元/a) | (%) | 等级 | ESVf (万元/a) | (%) | 等级 | |||
| 气体调价 | 10376.6 | 7.2 | 6 | 10446.4 | 7.9 | 6 | 10287.7 | 8.0 | 6 | 6 | ↑ |
| 气候调价 | 20259.6 | 14.0 | 5 | 17515.8 | 13.3 | 5 | 16478.4 | 12.8 | 5 | 5 | ↓ |
| 水源涵养 | 23224.7 | 16.1 | 3 | 19097.4 | 14.4 | 4 | 17950.5 | 13.9 | 4 | 4 | ↓ |
| 土壤形成 | 25203.6 | 17.5 | 2 | 25819.7 | 19.5 | 2 | 25765.1 | 20.0 | 2 | 2 | ↑ |
| 废物处理 | 32271.4 | 22.4 | 1 | 27989.3 | 21.2 | 1 | 27089.5 | 21.1 | 1 | 1 | ↓ |
| 生物多样性保护 | 20750.6 | 14.4 | 4 | 20556.0 | 15.6 | 3 | 20308.1 | 15.8 | 3 | 3 | ↑ |
| 食物生产 | 6837.2 | 4.7 | 7 | 6800.9 | 5.1 | 7 | 7264.8 | 5.7 | 7 | 7 | ↑ |
| 原材料 | 878.5 | 0.6 | 9 | 879.6 | 0.7 | 9 | 914.8 | 0.6 | 9 | 9 | – |
| 娱乐休闲 | 4422.6 | 3.1 | 8 | 3075.2 | 2.3 | 8 | 2657.4 | 2.1 | 8 | 8 | ↓ |
| 合计 | 144224.8 | 100 | – | 132180.3 | 100 | – | 128716.3 | 100 | – | – | – |
Table 5 Change of sensitivity coefficient of ecosystem services value for different land use types表5 不同土地利用类型生态服务价值敏感性指数变化 |
| 价值系数 | 1991年 | 2002年 | 2008年 | |||
|---|---|---|---|---|---|---|
| (%) | CCS | (%) | CCS | (%) | CCS | |
| 水域 VC±50% | 4.15 | 0.08 | 3.09 | 0.06 | 2.60 | 0.05 |
| 湿地VC±50% | 10.52 | 0.21 | 7.17 | 0.14 | 5.16 | 0.10 |
| 沙地VC±50% | 2.50 | 0.05 | 2.69 | 0.05 | 2.26 | 0.05 |
| 盐碱地VC±50% | 0.05 | 0.00 | 0.05 | 0.00 | 0.41 | 0.01 |
| 高密草VC±50% | 3.00 | 0.06 | 3.90 | 0.08 | 2.74 | 0.05 |
| 中密草VC±50% | 11.32 | 0.23 | 12.97 | 0.26 | 12.70 | 0.25 |
| 低密草VC±50% | 9.85 | 0.20 | 11.12 | 0.22 | 10.56 | 0.21 |
| 耕地VC±50% | 8.61 | 0.17 | 9.01 | 0.18 | 10.36 | 0.21 |
The authors have declared that no competing interests exist.
| [1] |
|
| [2] |
|
| [3] |
|
| [4] |
|
| [5] |
|
| [6] |
|
| [7] |
|
| [8] |
|
| [9] |
|
| [10] |
|
| [11] |
|
| [12] |
|
| [13] |
|
| [14] |
|
| [15] |
|
| [16] |
|
| [17] |
|
| [18] |
|
| [19] |
|
| [20] |
|
| [21] |
|
| [22] |
|
| [23] |
|
| [24] |
|
| [25] |
|
| [26] |
满苏尔·沙比提, 陆吐布拉·依明. 新疆南疆地区土地利用变化及其生态效应[J]. 地理科学, 2011, 31(4):440~446.
|
/
| 〈 |
|
〉 |