
Land Use Structure Optimization Research Based on Nitrogenand Phosphorus Output Risky Control in Small Watershed
Received date: 2012-12-18
Request revised date: 2013-02-11
Online published: 2013-09-30
Copyright
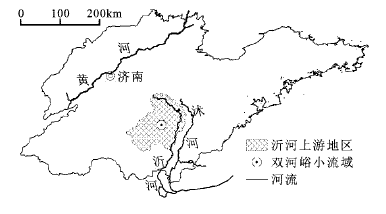
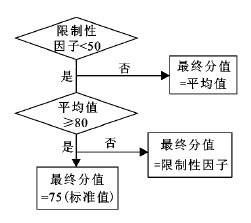
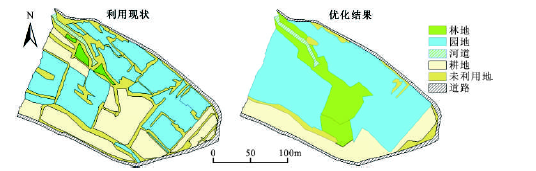
Taking Shuangheyu small watershed, the typical small watershed of the Yimeng mountainous area, as the object of study, the optimal allocation of land use structure in the study area was carried out based on the unit of land patches. Taking the control of the output of agricultural non-point source pollution (Nitrogen and Phosphorus, etc) into consideration, the optimal allocation of land use recognized the increase of economical and environmental benefit as the primary goal. The data was obtained using field in-situ observations district and Real-Time Kinematics(RTK)field measurement device. Land suitability evaluation was carried out through combination of the single-factor evaluation and the comprehensive evaluation method. The optimal allocation of land use structure was carried out through the method of effective coupling of linear programming model with dominant optimization analysis capabilities and GIS equipped with powerful spatial configuration function. The results showed that: the very combining of linear programming model and GIS not only provided the optimal allocation of land use with sound constraint effect in terms of area, but also matched the configuration information with specific spatial location at the same time, which enhanced the scientificalness and visuality of the optimal results. As taking account of the output of N, P non-point source pollutant into the factors considered by the optimal allocation of land use, the configuration results realized the goal of unifying the economic and environmental benefits through establishing multi-objective linear programming model of minimizing output of the non-point source pollution and maximizing the economic effectiveness. The optimization scheme of the Shuangheyu small watershed increased the area of orchard and forest land by 52.3% and 820%, respectively; and reduced the proportion of the area of farmland (cultivated land) by 38.3% and wasteland by 89.3%. The total N and P annual output was reduced by 15.3% and the annual economic efficiency was improved by 41%, among which the orchard, with its overwhelmingly superior area, made the most significant contribution to the increase of economic benefits in the optimization scheme. Land suitability evaluation was conducted through combination of the single-factor evaluation and the comprehensive evaluation method, which was applied in meso and micro-scale systems and made up for the deficiency of a linear programming model. It was turned out that the method was easy to operate and had good availability of data, which guaranteed the reliability of the configuration result. The orchard, with high economic effectiveness, comparatively lower N、P output risk and good flexibility in spatial configuration, was main factor influencing the land use optimal allocation, which should be put priority in optimization scheme. This study could provide scientific evidence for the rational utilization of land resources and lay the foundation for ecological construction of the Yimeng mountainous area.
Key words: the Yimeng mountainous areas; output N and P; landuse; linear programming model; GIS
YU Xing-xiu , LI Jian-hua , LIU Qian-jin , WU Yuan-zhi , SUN Qi-qi , GAO Yan . Land Use Structure Optimization Research Based on Nitrogenand Phosphorus Output Risky Control in Small Watershed[J]. SCIENTIA GEOGRAPHICA SINICA, 2013 , 33(9) : 1111 -1116 . DOI: 10.13249/j.cnki.sgs.2013.09.1111
Fig.1 Location of Shuangheyu small watershed图1 双河峪小流域位置 |
Fig. 2 The logical model of comprehensive evaluation图2 综合评价逻辑模型 |
Table 1 Rainfall characteristics表1 降雨特征 |
| 日 期 | 降雨量 (mm) | 降雨历时 (h) | 最大雨强 ( mm/min) | 平均雨强 ( mm/min) | 降雨型 |
|---|---|---|---|---|---|
| 2011-8-6 | 24.7 | 2.2 | 0.96 | 0.21 | 中雨 |
| 2011-8-11 | 46.2 | 1.7 | 1.27 | 0.46 | 大雨 |
| 2011-8-15 | 6.3 | 0.7 | 0.20 | 0.16 | 小雨 |
| 2011-8-20 | 74.0 | 20.5 | 0.14 | 0.06 | 暴雨 |
| 2011-8-29 | 57.0 | 13.5 | 0.67 | 0.07 | 暴雨 |
| 2011-9-14 | 34.1 | 1.8 | 0.97 | 0.31 | 大雨 |
| 2011-9-18 | 24.5 | 13.0 | 0.06 | 0.03 | 中雨 |
| 2011-9-29 | 25.5 | 10.0 | 0.47 | 0.04 | 大雨 |
Table 2 N and P annual output loads of different land use types表2 不同土地利用N、P年输出总量 |
| 土地利用 | 面积 (m2) | N素负荷 (mg/m2) | P素负荷 (mg/m2) | N、P总负荷 (mg/m2) | N、P输出 总量(g) |
|---|---|---|---|---|---|
| 耕地 | 6890 | 25.63 | 6.13 | 31.76 | 218.83 |
| 园地 | 9991 | 22.82 | 5.52 | 28.34 | 283.15 |
| 林地 | 372 | 17.38 | 4.82 | 22.20 | 8.26 |
| 未利用地 | 5691 | 32.51 | 17.52 | 50.03 | 284.72 |
Table 3 Slope levels score表3 坡度等级赋分 |
| 土地利用 | 坡度等级 | |||||
|---|---|---|---|---|---|---|
| 耕地 (花生) | 指标(°) | 0~2 | 2~6 | 6~15 | 15~25 | >25 |
| 等级 | Ⅰ | Ⅱ | Ⅲ | Ⅳ | Ⅴ | |
| 赋分 | 100 | 95 | 85 | 60 | 25 | |
| 园地 (桃树) | 指标(°) | 0~10 | 10~15 | 15~25 | 25~35 | >35 |
| 等级 | Ⅰ | Ⅱ | Ⅲ | Ⅳ | Ⅴ | |
| 赋分 | 100 | 95 | 85 | 65 | 40 | |
| 林地 (杨树) | 指标(°) | 0~10 | 10~15 | 15~20 | 20~35 | >35 |
| 等级 | Ⅰ | Ⅱ | Ⅲ | Ⅳ | Ⅴ | |
| 赋分 | 100 | 95 | 85 | 60 | 40 | |
| 未利 用地 | 指标(°) | 0~5 | 5~15 | 15~25 | 25~40 | >40 |
| 等级 | Ⅰ | Ⅱ | Ⅲ | Ⅳ | Ⅴ | |
| 赋分 | 100 | 95 | 85 | 60 | 40 | |
Table 4 Irrigation distance levels score表4 灌溉距离等级赋分 |
| 土地利用 | 灌溉距离等级 | |||||
|---|---|---|---|---|---|---|
| 耕地 (花生) | 指标(m) | 0~100 | 100~150 | 150~250 | >250 | - |
| 等级 | Ⅰ | Ⅱ | Ⅲ | Ⅳ | - | |
| 赋分 | 100 | 85 | 60 | 40 | - | |
| 园地 (桃树) | 指标(m) | 0~50 | 50~100 | 100~150 | 150~200 | >200 |
| 等级 | Ⅰ | Ⅱ | Ⅲ | Ⅳ | Ⅴ | |
| 赋分 | 100 | 85 | 60 | 40 | 25 | |
| 林地 (杨树) | 指标(m) | 0~50 | 50~100 | 100~150 | 150~200 | >200 |
| 等级 | Ⅰ | Ⅱ | Ⅲ | Ⅳ | Ⅴ | |
| 赋分 | 100 | 85 | 60 | 40 | 25 | |
| 未利 用地 | 指标(m) | - | - | - | - | - |
| 等级 | - | - | - | - | - | |
| 赋分 | - | - | - | - | - | |
Table 5 Soil depth levels score表5 土壤深度等级赋分 |
| 土地利用 | 土壤深度等级 | |||||
|---|---|---|---|---|---|---|
| 耕地 (花生) | 指标(cm) | 0~10 | 10~15 | 15~25 | 25~35 | >35 |
| 等级 | Ⅰ | Ⅱ | Ⅲ | Ⅳ | Ⅴ | |
| 赋分 | 0 | 40 | 60 | 85 | 100 | |
| 园地 (桃树) | 指标(cm) | 0~30 | 30~50 | 50~70 | 70~90 | >90 |
| 等级 | Ⅰ | Ⅱ | Ⅲ | Ⅳ | Ⅴ | |
| 赋分 | 0 | 40 | 60 | 85 | 100 | |
| 林地 (杨树) | 指标(cm) | 0~25 | 25~50 | 50~75 | 75~100 | >100 |
| 等级 | Ⅰ | Ⅱ | Ⅲ | Ⅳ | Ⅴ | |
| 赋分 | 25 | 40 | 60 | 85 | 100 | |
| 未利用地 | 指标(cm) | 0~5 | 5~10 | >10 | - | - |
| 等级 | Ⅰ | Ⅱ | Ⅲ | - | - | |
| 赋分 | 40 | 60 | 100 | - | - | |
Table 6 Suitability area of different land use types表6 不同土地利用适宜性面积 |
| 适宜性 等级 | 综合评价 分值 | 耕地 (m2) | 园地 (m2) | 林地 (m2) | 未利用地 (m2) |
|---|---|---|---|---|---|
| 高度适宜 | 81~100 | 2046 | 3640 | 3425 | 21803 |
| 中等适宜 | 61~80 | 1744 | 1503 | 2309 | 534 |
| 临界适宜 | 41~60 | 6171 | 15231 | 15164 | 433 |
| 不适宜 | 0~40 | 12983 | 2570 | 2046 | 174 |
Table 7 Model parameters表7 模型输入参数 |
| 模型参数 | X1 (耕地) | X2 (园地) | X3 (林地) | X4 (未利用地) |
|---|---|---|---|---|
| 价值系数[元/(a.m2)] | 4 | 13.50 | 2.30 | 0 |
| N、P输出系数(mg/m2) | 31.76 | 28.34 | 22.20 | 50.03 |
Fig. 3 Comparison between space optimization allocation program and current situation of land use in Shuangheyu small watershed图3 双河峪小流域土地利用优化空间配置方案与现状对比 |
Table 8 Comparison between optimization program and current land use structure表8 优化方案与现状土地利用结构对比 |
| 土地 利用 | 利用现状 | 优化方案 | ||||
|---|---|---|---|---|---|---|
| 面积(m2) | 经济效益(元) | N、P输出(g) | 面积(m2) | 经济效益(元) | N、P输出(g) | |
| 耕地 | 6890 | 27560.0 | 218.83 | 4254 | 17016.0 | 135.71 |
| 园地 | 9991 | 134878.5 | 2831.45 | 15212 | 205362.0 | 431.11 |
| 林地 | 372 | 855.6 | 8.26 | 3418 | 7861.4 | 758.80 |
| 未利用地 | 5691 | 0 | 284.72 | 607 | 0 | 30.37 |
| 总计 | 22944 | 163294.1 | 794.95 | 22944 | 230239.4 | 673.06 |
The authors have declared that no competing interests exist.
| [1] |
|
| [2] |
|
| [3] |
|
| [4] |
|
| [5] |
|
| [6] |
|
| [7] |
|
| [8] |
|
| [9] |
|
| [10] |
|
| [11] |
|
| [12] |
|
| [13] |
|
| [14] |
|
| [15] |
|
| [16] |
|
| [17] |
|
| [18] |
|
| [19] |
|
/
| 〈 |
|
〉 |