
The Evaluation of Urban Forced Movers′ Community Satisfaction —A Case Study of Nanjing
Received date: 2012-12-03
Request revised date: 2013-03-20
Online published: 2013-08-20
Copyright
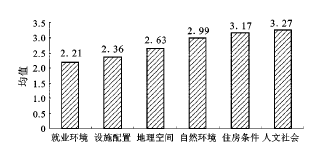
During China's transformation period, many cities are undergoing an essential process of urban renewal and reconstruction orientated by real estate development. While urban renewal and reconstruction are remodeling the inner city's material landscape, they also promote substitutes of borough residents' social stratum. In the circumstance of housing marketization , as a result of limited economic power, large numbers of low-income aborigines are forced and relocated to large-scale settlement district in the suburbs, which brings about profound influences on social and economic development of a city, as well as upon individuals. Therefore the consequential urban socio-spatial issues have become the hotspot of academia. In spite of previous researches exploring solutions from researchers, objective and neutral position, there is still a lack of empirical studies conducted from the self-perception and demands of the under-privileged low-income aborigines. The research of urban forced movers′ community satisfaction sheds light and provides a new perspective for understanding urban renewal′s impacts on low-income groups and how to improve community construction of low-income groups. Based on a case study of eight removal and resettlement communities in Nanjing suburbs, this article finds that urban forced movers′ community satisfaction is constructed by six dimensions: employment environment, facilities allocation, geographic space, natural environment, housing conditions and social environment (in the order of highest evaluation scores to the lowest). Nonetheless, the overall community satisfaction is relatively low, which indicates the low-income residents’ employment and public facilities access after relocation is far from desirable. Community satisfaction variance between different groups is shown significantly, space and time, education level and job stability are proved to be factors influencing community satisfaction. Such conclusions should be given proper consideration in the future for formulating new removal and resettlement modes and reforming and optimizing low-income community construction.
Key words: forced movers; community satisfaction; evaluation; Nanjing
XIA Yong-jiu , ZHU Xi-gang . The Evaluation of Urban Forced Movers′ Community Satisfaction —A Case Study of Nanjing[J]. SCIENTIA GEOGRAPHICA SINICA, 2013 , 33(8) : 918 -925 . DOI: 10.13249/j.cnki.sgs.2013.08.918
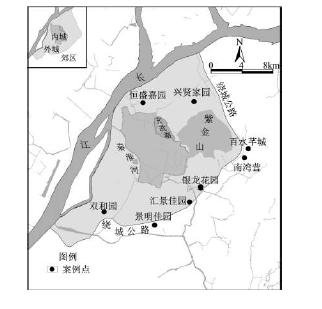
Fig.1 The spatial layout of eight investigated communities图1 8个调查社区空间布局 |
Table 1 The summary of the samples表1 样本基本情况 |
| 基本情况 | 类别 | 比例 | 基本情况 | 类别 | 比例 |
|---|---|---|---|---|---|
| 性别 | 男 | 55.95% | 月收入 | 1000元及以下 | 2.01% |
| 女 | 44.05% | 1001~1500元 | 55.11% | ||
| 年龄 | 30岁及以下 | 9.55% | 1501~2500元 | 42.38% | |
| 31~45岁 | 65.83% | 2501~3000元 | 0.50% | ||
| 46~60岁 | 24.62% | 入住年份 | 1~3 a | 33.00% | |
| 60岁以上 | 0.00% | 4~6 a | 51.76% | ||
| 婚姻 | 已婚 | 92.96% | 6 a以上 | 15.24% | |
| 其他 | 7.04% | 安置方式 | 同区安置 | 34.67% | |
| 文化程度 | 初中及以下 | 36.85% | 跨区安置 | 65.33% | |
| 高中(中专) | 43.72% | 职住分离 | 职住分离 | 51.09% | |
| 大学专科 | 14.57% | 职住同区 | 48.91% | ||
| 大学本科 | 4.86% | 职业 | 一般职员 | 39.87% | |
| 研究生 | 0.00% | 推销员 | 15.41% | ||
| 家庭代数 | 一代 | 4.02% | 保洁员 | 8.54% | |
| 二代 | 60.47% | 服务员 | 6.87% | ||
| 三代 | 35.01% | 技术人员 | 2.35% | ||
| 四代 | 0.50% | 管理人员 | 3.52% | ||
| 工作变动 | 工作变动 | 58.12% | 其他职业 | 23.44% | |
| 工作未变动 | 41.88% |
Table 2 The means and factors loading of community satisfaction (n=597)表2 社区满意度均值与因子载荷(n=597) |
| 满意度评估 (α=0.716) | 因子1 | 因子2 | 因子3 | 因子4 | 因子5 | 因子6 | 均值 | Item-Total 相关系数 |
|---|---|---|---|---|---|---|---|---|
| 就业环境维度 | 2.21 | |||||||
| 就业机会 | 0.800 | 0.145 | 0.032 | 0.092 | -0.015 | 0.130 | 2.35 | 0.514 |
| 就业稳定度 | 0.778 | 0.120 | 0.057 | 0.140 | -0.040 | -0.011 | 2.10 | 0.474 |
| 就业培训 | 0.760 | 0.050 | 0.155 | 0.081 | 0.067 | 0.132 | 2.18 | 0.532 |
| 地理空间维度 | 2.63 | |||||||
| 通勤时间 | 0.179 | 0.895 | 0.013 | 0.047 | 0.055 | -0.030 | 2.48 | 0.503 |
| 通勤费用 | 0.034 | 0.890 | -0.008 | -0.010 | 0.036 | -0.019 | 2.72 | 0.418 |
| 小区位置 | 0.200 | 0.411 | 0.128 | 0.220 | 0.136 | 0.198 | 2.68 | 0.508 |
| 自然环境维度 | 2.99 | |||||||
| 空气质量 | -0.047 | 0.123 | 0.858 | 0.115 | -0.038 | 0.077 | 3.14 | 0.473 |
| 环境卫生 | 0.128 | -0.035 | 0.826 | 0.057 | 0.099 | 0.059 | 2.77 | 0.478 |
| 绿化水平 | 0.289 | -0.015 | 0.588 | -0.046 | 0.246 | -0.212 | 3.07 | 0.416 |
| 人文社会维度 | 3.27 | |||||||
| 邻里互信 | 0.165 | -0.095 | 0.125 | 0.773 | -0.010 | 0.048 | 3.65 | 0.434 |
| 社区认同 | 0.070 | 0.243 | 0.035 | 0.751 | 0.177 | -0.101 | 2.98 | 0.498 |
| 邻里关系 | 0.067 | 0.033 | -0.015 | 0.699 | -0.021 | 0.174 | 3.19 | 0.395 |
| 住房条件维度 | 3.17 | |||||||
| 住房面积 | 0.045 | 0.047 | 0.053 | 0.011 | 0.895 | 0.069 | 3.14 | 0.383 |
| 住房户型 | -0.048 | 0.097 | 0.123 | 0.089 | 0.651 | 0.154 | 3.20 | 0.391 |
| 设施配置维度 | 2.36 | |||||||
| 教育设施 | -0.002 | -0.108 | 0.083 | 0.080 | -0.111 | 0.860 | 2.55 | 0.247 |
| 金融设施 | 0.135 | 0.109 | -0.064 | 0.043 | 0.118 | 0.442 | 1.96 | 0.303 |
| 商业设施 | 0.055 | 0.006 | 0.010 | 0.012 | 0.245 | 0.440 | 2.58 | 0.283 |
Fig.2 Different dimensions′ mean value of community satisfaction图2 社区满意度各维度得分均值 |
Table 3 Differences of community satisfaction between groups表3 社区满意度评估组间差异 |
| 就业环境维度 | 设施配置维度 | 地理空间维度 | 人文社会维度 | ||
|---|---|---|---|---|---|
| 性别 | Mann-W | 42859.500 | 40100.000 | 43065.000 | 41513.000 |
| Z | -0.520 | -1.883 | -0.414 | -1.178 | |
| 近似p值 | 0.603 | 0.060 | 0.679 | 0.239 | |
| 年龄 | Chi-Square | 0.688 | 2.208 | 0.692 | 1.783 |
| df | 2 | 2 | 2 | 2 | |
| 近似p值 | 0.709 | 0.332 | 0.708 | 0.410 | |
| 文化水平 | Chi-Square | 1.356 | 11.435 | 7.674 | 1.556 |
| df | 3 | 3 | 3 | 3 | |
| 近似p值 | 0.716 | 0.010 | 0.050 | 0.669 | |
| 职业 | Chi-Square | 2.359 | 5.600 | 12.624 | 0.622 |
| df | 6 | 6 | 6 | 6 | |
| 近似p值 | 0.884 | 0.469 | 0.059 | 0.996 | |
| 婚姻状况 | Mann-W | 11026.500 | 11216.500 | 11636.000 | 11536.500 |
| Z | -0.598 | -0.419 | -0.018 | -0.112 | |
| 近似p值 | 0.550 | 0.675 | 0.986 | 0.910 | |
| 家庭结构 | Chi-Square | 4.405 | 4.654 | 1.546 | 1.624 |
| df | 3 | 3 | 3 | 3 | |
| 近似p值 | 0.221 | 0.199 | 0.672 | 0.654 | |
| 个人收入 | Chi-Square | 2.812 | 2.337 | 6.891 | 0.056 |
| df | 3 | 3 | 3 | 3 | |
| 近似p值 | 0.422 | 0.505 | 0.075 | 0.997 | |
| 居住年份 | Chi-Square | 6.871 | 8.399 | 27.368 | 13.065 |
| df | 2 | 2 | 2 | 1 | |
| 近似p值 | 0.032 | 0.015 | 0.001 | 0.001 | |
| 工作是否变动 | Mann-W | 39231.000 | 41607.500 | 31851.500 | 38956.500 |
| Z | -2.044 | -0.876 | -5.604 | -2.174 | |
| 近似p值 | 0.041 | 0.381 | 0.001 | 0. 30 | |
| 新旧是否同区 | Mann-W | 39532.500 | 25656.000 | 35611.500 | 37202.000 |
| Z | -0.426 | -7.560 | -2.396 | -1.614 | |
| 近似p值 | 0.670 | 0.001 | 0.017 | 0.107 | |
| 职住是否分离 | Mann-W | 41944.500 | 37165.500 | 29301.000 | 43313.500 |
| Z | -1.259 | -3.604 | -7.309 | -0.591 | |
| 近似p值 | 0.208 | 0.001 | 0.001 | 0.555 |
The authors have declared that no competing interests exist.
| [1] |
|
| [2] |
|
| [3] |
|
| [4] |
|
| [5] |
|
| [6] |
|
| [7] |
|
| [8] |
|
| [9] |
|
| [10] |
|
| [11] |
|
| [12] |
|
| [13] |
|
| [14] |
|
| [15] |
|
| [16] |
|
| [17] |
|
| [18] |
|
| [19] |
|
| [20] |
|
| [21] |
|
| [22] |
|
| [23] |
|
| [24] |
|
| [25] |
|
| [26] |
|
| [27] |
|
| [28] |
|
| [29] |
|
| [30] |
|
| [31] |
|
| [32] |
|
| [33] |
|
| [34] |
|
| [35] |
|
/
| 〈 |
|
〉 |