
Spatio-temporal Analysis of Regional and Provincial Informatization in China
Received date: 2012-05-05
Request revised date: 2012-08-21
Online published: 2013-01-31
Copyright
Information and communication technologies (ICT) is a major symbol of the contemporary world, which is predominated by two interwoven tendencies, namely globalization and informatization. It is now widely accepted that the world is moving fast towards an information age, while ICT is a major channel to such a historical transformation. Indeed, no technological progress in the last several decades can match the advent of ICT in terms of its profound and extensive influences. Since 1994, the development of ICT in China has been incredibly fast, but there has been “digital divide” between provinces. Indeed, there are huge digital-divide worldwide, which would impact economic spatial distribution. It is against such a background that this article takes a close examination on the development of informatization in China and its spatio-temporal pattern. Based on the literature review, principal components analysis and fuzzy analytic hierarchy process, it established ICT development index (IDI) and then calculated IDI and CV value, in order to provide a more comprehensive explanation of ICTs trends and developments. It also tried to gauge and justify the spatial implications of ICTs development, especially the relationship between informatization and economic development, by regression analysis. The findings of this study are follows. First, there are significant regional differences in informatization, and the development of ICT declines gradually from Eastern China to Western China. From 2000 to 2010, the development of ICT in Western China and Central China are much faster than Eastern China and Northeast China, while the regional digital gap is becoming smaller. Secondly, the difference of informatization among provinces is also very remarkable. The provincial spatial pattern of informatization has changed, with lessened digital divide in 2000-2010. Finally, at provincial scale, the spatial distribution of ICT has obviously positive correlation with local GDP development. From 2000 to 2010, with the evolution towards an informatization society, the relationship between informatization and economic development has been more and more related.
SONG Zhou-ying , LIU Wei-dong . Spatio-temporal Analysis of Regional and Provincial Informatization in China[J]. SCIENTIA GEOGRAPHICA SINICA, 2013 , 33(3) : 257 -265 . DOI: 10.13249/j.cnki.sgs.2013.03.257
Table 1 Index of IDI and weighting of indicators表1 信息化发展指数指标体系结构及权重 |
| 总指数 | 分类指数 | 总权重 | 指标 | 权重 |
|---|---|---|---|---|
| 信息化发展指数 | 信息技术设施指数 | 40.6% | 固定电话拥有率(%) | 7.0% |
| 移动电话拥有率(%) | 10.7% | |||
| 计算机拥有率(%) | 10.8% | |||
| 用户互联网平均带宽(bit/s) | 12.1% | |||
| 信息技术应用指数 | 40.1% | 每百居民互联网用户数(户/百) | 13.1% | |
| 每百居民固定宽带用户数(户/百) | 8.1% | |||
| 每百居民移动宽带用户数(户/百) | 10.9% | |||
| 互联网发展速度(%) | 8.0% | |||
| 信息技术技能指数 | 19.3% | 成人识字率(%) | 5.4% | |
| 初中入学率(%) | 7.4% | |||
| 高中入学率(%) | 6.5% |
Fig.1 Development of IDI in China in 2000-2010图1 2000~2010年中国IDI值增长情况 |
Fig.2 The general pattern of ICT development in China in 1990-2010图2 1990~2010年中国信息化发展进程 |
Table 2 IDI of geographic region in 2010表2 2010年中国四大板块信息化发展区域差异 |
| 四大区域 | 2010年IDI值 | 互联网普及率 | 移动电话普及率 | 固定电话普及率 |
|---|---|---|---|---|
| 东部 | 0.759 | 43.82% | 79.62% | 28.24% |
| 中部 | 0.648 | 27.06% | 50.23% | 17.34% |
| 西部 | 0.635 | 27.57% | 56.49% | 16.91% |
| 东北地区 | 0.675 | 35.83% | 65.90% | 25.89% |
Fig.3 Spatial disparity of IDI in China in 2010图3 2010年中国各省区市IDI值空间差异 |
Table 3 IDI of four geographic regions of China in 2000-2010表3 2000~2010年中国四大板块IDI值变化 |
| 2000年 | 2001年 | 2002年 | 2003年 | 2004年 | 2005年 | 2006年 | 2007年 | 2008年 | 2009年 | 2010年 | |
|---|---|---|---|---|---|---|---|---|---|---|---|
| 东部 | 0.532 | 0.559 | 0.593 | 0.621 | 0.639 | 0.665 | 0.688 | 0.706 | 0.719 | 0.735 | 0.759 |
| 中部 | 0.442 | 0.462 | 0.492 | 0.521 | 0.533 | 0.552 | 0.574 | 0.589 | 0.599 | 0.620 | 0.648 |
| 西部 | 0.424 | 0.443 | 0.476 | 0.501 | 0.516 | 0.531 | 0.554 | 0.571 | 0.586 | 0.608 | 0.635 |
| 东北 | 0.484 | 0.507 | 0.551 | 0.571 | 0.585 | 0.599 | 0.612 | 0.630 | 0.636 | 0.653 | 0.675 |
| CV | 0.102 | 0.105 | 0.102 | 0.097 | 0.098 | 0.101 | 0.098 | 0.096 | 0.094 | 0.087 | 0.082 |
Table 4 IDI changes by province in China in 2000-2010表4 中国各省区市2000~2010年IDI值变化 |
| 2000年 | 2001年 | 2002年 | 2003年 | 2004年 | 2005年 | 2006年 | 2007年 | 2008年 | 2009年 | 2010年 | |
|---|---|---|---|---|---|---|---|---|---|---|---|
| 北京 | 0.717 | 0.746 | 0.777 | 0.795 | 0.807 | 0.844 | 0.895 | 0.906 | 0.892 | 0.911 | 0.933 |
| 天津 | 0.574 | 0.594 | 0.609 | 0.649 | 0.670 | 0.688 | 0.708 | 0.719 | 0.737 | 0.756 | 0.785 |
| 河北 | 0.440 | 0.462 | 0.509 | 0.535 | 0.550 | 0.564 | 0.583 | 0.595 | 0.617 | 0.634 | 0.662 |
| 山西 | 0.444 | 0.460 | 0.506 | 0.538 | 0.555 | 0.582 | 0.602 | 0.614 | 0.633 | 0.655 | 0.689 |
| 内蒙古 | 0.466 | 0.461 | 0.490 | 0.515 | 0.535 | 0.558 | 0.579 | 0.602 | 0.608 | 0.63 | 0.655 |
| 辽宁 | 0.509 | 0.530 | 0.578 | 0.597 | 0.609 | 0.625 | 0.635 | 0.657 | 0.670 | 0.692 | 0.716 |
| 吉林 | 0.477 | 0.497 | 0.543 | 0.56 | 0.575 | 0.591 | 0.608 | 0.626 | 0.623 | 0.63 | 0.659 |
| 黑龙江 | 0.466 | 0.494 | 0.533 | 0.556 | 0.571 | 0.582 | 0.594 | 0.608 | 0.616 | 0.636 | 0.649 |
| 上海 | 0.656 | 0.683 | 0.724 | 0.744 | 0.758 | 0.78 | 0.817 | 0.837 | 0.844 | 0.852 | 0.874 |
| 江苏 | 0.492 | 0.525 | 0.555 | 0.58 | 0.601 | 0.633 | 0.656 | 0.687 | 0.700 | 0.722 | 0.747 |
| 浙江 | 0.522 | 0.550 | 0.583 | 0.614 | 0.639 | 0.678 | 0.696 | 0.721 | 0.735 | 0.748 | 0.769 |
| 安徽 | 0.425 | 0.444 | 0.460 | 0.503 | 0.515 | 0.530 | 0.555 | 0.568 | 0.581 | 0.602 | 0.629 |
| 福建 | 0.506 | 0.530 | 0.560 | 0.593 | 0.606 | 0.628 | 0.649 | 0.668 | 0.691 | 0.707 | 0.732 |
| 江西 | 0.446 | 0.463 | 0.492 | 0.522 | 0.525 | 0.541 | 0.565 | 0.585 | 0.589 | 0.606 | 0.633 |
| 山东 | 0.464 | 0.484 | 0.532 | 0.558 | 0.576 | 0.593 | 0.607 | 0.62 | 0.64 | 0.657 | 0.692 |
| 河南 | 0.416 | 0.447 | 0.472 | 0.495 | 0.512 | 0.53 | 0.552 | 0.573 | 0.58 | 0.601 | 0.628 |
| 湖北 | 0.458 | 0.486 | 0.521 | 0.544 | 0.558 | 0.574 | 0.595 | 0.605 | 0.615 | 0.638 | 0.666 |
| 湖南 | 0.46 | 0.473 | 0.503 | 0.526 | 0.535 | 0.555 | 0.572 | 0.59 | 0.596 | 0.618 | 0.645 |
| 广东 | 0.526 | 0.551 | 0.59 | 0.625 | 0.652 | 0.683 | 0.691 | 0.72 | 0.73 | 0.736 | 0.751 |
| 广西 | 0.434 | 0.461 | 0.479 | 0.506 | 0.526 | 0.549 | 0.562 | 0.573 | 0.585 | 0.606 | 0.627 |
| 海南 | 0.425 | 0.467 | 0.486 | 0.512 | 0.534 | 0.557 | 0.576 | 0.586 | 0.607 | 0.622 | 0.64 |
| 重庆 | 0.458 | 0.471 | 0.515 | 0.544 | 0.556 | 0.583 | 0.608 | 0.62 | 0.633 | 0.645 | 0.671 |
| 四川 | 0.449 | 0.477 | 0.501 | 0.528 | 0.537 | 0.549 | 0.569 | 0.579 | 0.588 | 0.613 | 0.635 |
| 贵州 | 0.366 | 0.38 | 0.42 | 0.446 | 0.466 | 0.477 | 0.505 | 0.52 | 0.529 | 0.581 | 0.613 |
| 云南 | 0.4 | 0.417 | 0.44 | 0.467 | 0.495 | 0.508 | 0.522 | 0.527 | 0.552 | 0.577 | 0.607 |
| 西藏 | 0.285 | 0.346 | 0.388 | 0.388 | 0.415 | 0.427 | 0.461 | 0.503 | 0.525 | 0.536 | 0.567 |
| 陕西 | 0.48 | 0.495 | 0.53 | 0.563 | 0.583 | 0.598 | 0.612 | 0.628 | 0.643 | 0.674 | 0.711 |
| 甘肃 | 0.424 | 0.449 | 0.476 | 0.501 | 0.51 | 0.528 | 0.544 | 0.552 | 0.573 | 0.597 | 0.627 |
| 青海 | 0.409 | 0.423 | 0.474 | 0.493 | 0.501 | 0.513 | 0.544 | 0.564 | 0.583 | 0.596 | 0.615 |
| 宁夏 | 0.457 | 0.461 | 0.486 | 0.524 | 0.528 | 0.537 | 0.565 | 0.579 | 0.597 | 0.621 | 0.648 |
| 新疆 | 0.463 | 0.478 | 0.517 | 0.535 | 0.542 | 0.548 | 0.572 | 0.601 | 0.618 | 0.62 | 0.644 |
随着各省区市信息化发展水平的提高,省际信息化水平的排序及其空间格局也有较大变化。首先,2010年与2000年相比,有10个省区市的位序上升,12个省区市下降,9个保持不变。其中,位序上升最大的是山西和河北,分别上升10位和8位;位序下降最大的分别是黑龙江、新疆、内蒙古和吉林,分别下降了6位、6位、5位和5位。其次,信息化发展水平最高的前9位没有大变动,只是内部排序有小变化;而山东省上升3位挤入前十,吉林省下降5位跌出前十。另外,东北地区IDI值排序下降明显,东北三省的IDI值排名全都下降,黑龙江、吉林和辽宁分别下降了6位、5位和2位;东部地区IDI值排序上升明显,东部10省除广东省下降1位外,其他省份全部上升或保持不变;中部地区IDI值排序变化最大,山西、湖北、河南排序分别上升10位、3位、2位,湖南和江西排序下降4位和2位,安徽保持不变。 |
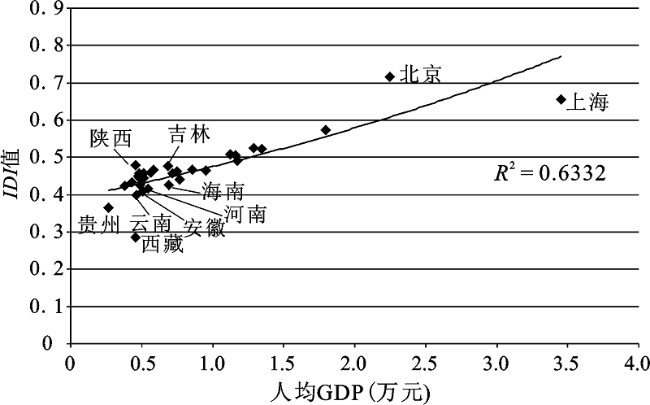
Fig.4 Relation between IDI and GDP per capita in China in 2000图4 2000年中国各省区市IDI值与人均GDP |
Fig.5 Relation between IDI and GDP per capita in China in 2010图5 2010年中国各省区市IDI值与人均GDP |
The authors have declared that no competing interests exist.
| [1] |
|
| [2] |
|
| [3] |
|
| [4] |
|
| [5] |
|
| [6] |
|
| [7] |
|
| [8] |
|
| [9] |
|
| [10] |
|
| [11] |
|
| [12] |
|
| [13] |
|
| [14] |
|
| [15] |
|
| [16] |
|
| [17] |
|
| [18] |
|
| [19] |
|
| [20] |
|
| [21] |
|
| [22] |
|
| [23] |
|
| [24] |
|
| [25] |
|
| [26] |
|
| [27] |
|
| [28] |
|
| [29] |
|
| [30] |
|
| [31] |
|
| [32] |
工业和信息化部信息化推进司,国家统计局统计科学研究所.中国信息化发展指数统计检车年度报告2011[M].北京:中国发展出版社,2011.
|
| [33] |
国家统计局.中国统计年鉴[M].北京:中国统计出版社,2001~2011.
|
| [34] |
北京市统计局.北京统计年鉴[M].北京:中国统计出版社,2001~2011.
|
| [35] |
天津市统计局.天津统计年鉴[M].北京:中国统计出版社,2001~2011.
|
| [36] |
河北省统计局.河北统计年鉴[M].北京:中国统计出版社,2001~2011.
|
| [37] |
黑龙江省统计局.黑龙江统计年鉴[M].北京:中国统计出版社,2001~2011.
|
| [38] |
吉林省统计局.吉林统计年鉴[M].北京:中国统计出版社,2001~2011.
|
| [39] |
辽宁省统计局.辽宁统计年鉴[M].北京:中国统计出版社,2001~2011.
|
| [40] |
内蒙古自治区统计局.内蒙古统计年鉴[M].北京:中国统计出版社,2001~2011.
|
| [41] |
上海市统计局.上海统计年鉴[M].北京:中国统计出版社,2001~2011.
|
| [42] |
山东省统计局.山东统计年鉴[M].北京:中国统计出版社,2001~2011.
|
| [43] |
江苏省统计局.江苏统计年鉴[M].北京:中国统计出版社,2001~2011.
|
| [44] |
浙江省统计局.浙江统计年鉴[M].北京:中国统计出版社,2001~2011.
|
| [45] |
福建省统计局.福建统计年鉴[M].北京:中国统计出版社,2001~2011.
|
| [46] |
广东省统计局.广东统计年鉴[M].北京:中国统计出版社,2001~2011.
|
| [47] |
广西自治区统计局.广西统计年鉴[M].北京:中国统计出版社,2001~2011.
|
| [48] |
山西省统计局.山西统计年鉴[M].北京:中国统计出版社,2001~2011.
|
| [49] |
河南省统计局.河南统计年鉴[M].北京:中国统计出版社,2001~2011.
|
| [50] |
安徽省统计局.安徽统计年鉴[M].北京:中国统计出版社,2001~2011.
|
| [51] |
湖北省统计局.湖北统计年鉴[M].北京:中国统计出版社,2001~2011.
|
| [52] |
湖南省统计局.湖南统计年鉴[M].北京:中国统计出版社,2001~2011.
|
| [53] |
江西省统计局.江西统计年鉴[M].北京:中国统计出版社,2001~2011.
|
| [54] |
陕西省统计局.陕西统计年鉴[M].北京:中国统计出版社,2001~2011.
|
| [55] |
青海省统计局.青海统计年鉴[M].北京:中国统计出版社,2001~2011.
|
| [56] |
宁夏自治区统计局.宁夏统计年鉴[M].北京:中国统计出版社,2001~2011.
|
| [57] |
新疆自治区统计局.新疆统计年鉴[M].北京:中国统计出版社,2001~2011.
|
| [58] |
西藏自治区统计局.西藏统计年鉴[M].北京:中国统计出版社,2001~2011.
|
| [59] |
云南省统计局.云南统计年鉴[M].北京:中国统计出版社,2001~2011.
|
| [60] |
贵州省统计局.贵州统计年鉴[M].北京:中国统计出版社,2001~2011.
|
| [61] |
四川省统计局.四川统计年鉴[M].北京:中国统计出版社,2001~2011.
|
| [62] |
重庆市统计局.重庆统计年鉴[M].北京:中国统计出版社,2001~2011.
|
| [63] |
海南省统计局.海南统计年鉴[M].北京:中国统计出版社,2001~2011.
|
| [64] |
国家统计局.中国信息统计年鉴[M].北京:中国统计出版社,2001~2010.
|
| [65] |
中国互联网络信息中心.中国互联网络发展状况统计报告[R/OL].1997~2011,
|
/
| 〈 |
|
〉 |


