
The Spatial Difference of Residents′ Commuting Satisfaction in Beijing Based on Their Social Characteristics
Received date: 2012-06-04
Request revised date: 2012-10-25
Online published: 2013-01-31
Copyright
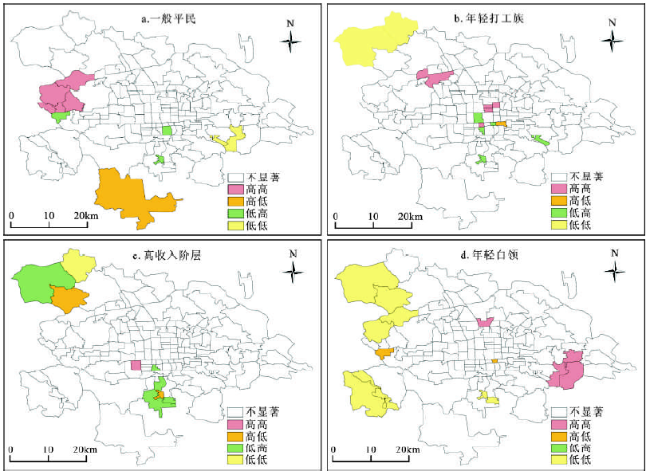
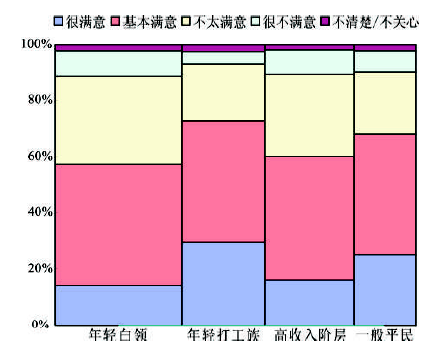
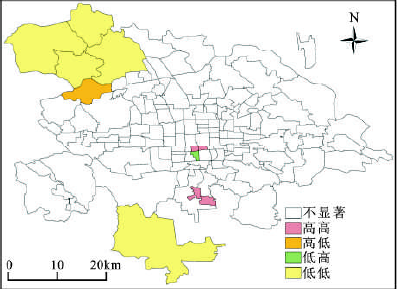
With the reform and opening up, China experienced a rapid growth during the past 30 years. At the same time, the urbanization level increased to nearly 50% at 2010. The transformation in China had provided a great opportunity for theoretical work on the urban study. The urban spatial structure had undergone tremendous change with housing reform too. The traffic problems such as longtime commute, traffic congestion and air pollutions that accompanied with the home-work separation are paid more attention now. Beijing, as the capital of China, is also faced these challenges. In this article, an empirical analysis focused on the difference of residents′ commuting satisfaction in Beijing was done based on the large-scale survey data both in 2005 and 2010. The survey focused on the commute behaviors and the social-economic characteristics of the people worked in Beijing. We find out that the people can be divided into 4 groups by using Principal Component Analysis based on their socio-economic characteristics. The 4 groups are civilians in general, young migrant workers, high-income group and young white-collar workers. And then the spatial distribution of the 4 groups was tested by using Moran′s I. The results show that there are significant spatial autocorrelation in distribution of civilians in general and young white-collar workers. But the distribution of young migrant workers and high-income group are more random than spatial cluster. The hot spots of the cluster of the groups were found by LISA. General civilians mainly gather in western suburbs and young migrant workers mainly in urban central area or nearby Zhongguancun; high-income group also gather in urban center while young white-collars cluster are located in northern area of the city and the area near the East Fifth Ring Road. The difference of the commuting satisfaction among these groups is tested too. The results show that compared with 2005, the residents commute satisfaction has declined in Beijing in 2010. One reason may be the commuting time increased from 38.0 min to 43.6 min at the same time. The commuting satisfaction of civilians in general and young migrant workers is relatively higher while high-income group and young white-collar workers had lower satisfaction. The result shows that there is significant spatial difference of the residents’ commuting satisfaction too. The hot spot with higher satisfaction clustered in the center area of the city, and the cool spot with lower satisfaction clustered in the suburbs area of the city. The spatial distribution of the groups can help to understand the pattern of the residents’ commuting satisfaction.
MENG Bin , ZHAN Dong-sheng , HAO Li-rong . The Spatial Difference of Residents′ Commuting Satisfaction in Beijing Based on Their Social Characteristics[J]. SCIENTIA GEOGRAPHICA SINICA, 2013 , 33(4) : 410 -417 . DOI: 10.13249/j.cnki.sgs.2013.04.410
Table 1 The characteristics of the samples表1 样本属性构成 |
| 属性 | 样本数(个) | 比例(%) | 属性 | 样本数(个) | 比例(%) | ||
|---|---|---|---|---|---|---|---|
| 年龄 | 30岁以下 | 2695 | 63.2 | 家庭构成 | 单身独住 | 1658 | 39.0 |
| 30~39岁 | 1048 | 24.6 | 单身和父母同住 | 736 | 17.3 | ||
| 40~49岁 | 383 | 9.0 | 夫妻独住 | 817 | 19.2 | ||
| 50~59岁 | 124 | 2.9 | 夫妻和父母同住 | 135 | 3.2 | ||
| 60岁以上 | 15 | 0.4 | 夫妻携子女 | 621 | 14.6 | ||
| 学历 | 初中及以下 | 270 | 6.3 | 三代以上同住 | 144 | 3.4 | |
| 高中 | 712 | 16.7 | 其它 | 142 | 3.3 | ||
| 大专 | 1219 | 28.6 | 交通方式 | 步行 | 454 | 10.7 | |
| 本科 | 1661 | 39.0 | 自行车 | 301 | 7.1 | ||
| 研究生 | 393 | 9.2 | 电动车/摩托车 | 105 | 2.5 | ||
| 家庭月收入 | 3000元以下 | 909 | 22.0 | 公交车 | 1606 | 37.7 | |
| 3000~4999元 | 1180 | 28.6 | 地铁/轻轨 | 1003 | 23.6 | ||
| 5000~9999元 | 1183 | 28.7 | 单位班车 | 135 | 3.2 | ||
| 1~1.5万元 | 444 | 10.8 | 出租车 | 88 | 2.1 | ||
| 1.5~2万元 | 218 | 5.3 | 私家车 | 566 | 13.3 | ||
| 2万元以上 | 191 | 4.6 |
Table 2 Principle cmponent analysis on the characteristics of socio-economic status表2 居民社会属性特征的主成分分析 |
| F1经济 知识水平 | F2家庭 负担压力 | ||
|---|---|---|---|
| 主成分 | 特征值 | 1.705 | 1.290 |
| 贡献率 | 34.095 | 25.801 | |
| 累计贡献率 | 34.095 | 59.896 | |
| 旋转后因子载荷 | X1年龄 | -0.003 | 0.800 |
| X2学历 | 0.763 | -0.246 | |
| X3家庭月总收入 | 0.715 | 0.344 | |
| X4家庭规模 | 0.082 | 0.755 | |
| X5交通方式 | 0.705 | 0.091 |
Table 3 The characteristics of socio-economic status of different groups表3 不同人群的社会属性特征 |
| 年龄 | 学历 | 家庭规模 | 家庭月总收入 | 交通方式 | |
|---|---|---|---|---|---|
| 一般平民 | 30~49岁 | 高中、大专 | 3人为主、包括一些5人 | 3000~9999元 | 公交车为主,其次步行、自行车 |
| 年轻打工族 | 30岁以下 | 高中、大专 | 1人为主 | 3000元以下 | 公交车为主,其次步行、自行车 |
| 高收入阶层 | 30~40岁 | 本科 | 3人为主 | 5000~15000元 | 私家车为主、其次地铁 |
| 年轻白领 | 30岁以下 | 本科 | 1人为主 | 3000~9999元 | 公交车、地铁 |
Table 4 Global spatial autocorrelation of different groups表4 不同人群的全局自相关检验 |
| Moran’s I | Z值 | P值 | |
|---|---|---|---|
| 一般平民 | 0.11 | 2.28 | 0.02 |
| 年轻打工族 | 0.06 | 1.30 | 0.19 |
| 高收入阶层 | -0.07 | -1.19 | 0.23 |
| 年轻白领 | 0.11 | 2.36 | 0.02 |
Fig.1 Local spatial autocorrelation of distribution in different groups图1 不同人群分布的局域空间自相关格局 |
Fig.2 The composing feature of commuting satisfaction of different groups图2 不同人群及其通勤满意度构成特点 |
Fig.3 Local spatial autocorrelation of the scores of commuting satisfaction at streets图3 街道通勤满意度的局域空间自相关格局 |
The authors have declared that no competing interests exist.
| [1] |
|
| [2] |
|
| [3] |
|
| [4] |
|
| [5] |
|
| [6] |
|
| [7] |
|
| [8] |
|
| [9] |
|
| [10] |
|
| [11] |
|
| [12] |
|
| [13] |
|
| [14] |
|
| [15] |
|
| [16] |
|
| [17] |
|
| [18] |
|
| [19] |
|
| [20] |
|
| [21] |
|
| [22] |
|
| [23] |
|
| [24] |
|
| [25] |
|
| [26] |
|
| [27] |
|
| [28] |
|
/
| 〈 |
|
〉 |