
The Spatial Choice of The Employment Transference of the Rural Labors: A Case Study of Hefei City
Received date: 2012-05-11
Request revised date: 2012-12-14
Online published: 2013-04-20
Copyright
The spatial choice of the employment transference of the rural labors is influenced not only by the economic utility factors but also by the individual subjective cognition. This article, from the microcosmic perspective of rural labor force, discusses the process of this spatial decision and its internal relationship and reveals its spatial decision-making mechanism through the path analysis of transferring employment motivation, environment cognition and decision methods. The spatial choice process of rural labor’s employment transference is divided into three stages: motive produce, environmental cognitive and decision-making forms. The case study of Hefei City shows: the motives of the rural labor force’s employment have been transferred from seeking pure income to pursuing comprehensive development. The rural labor forces think that Hefei is a city with fast economic development, good education and science and technology development and good transportation business facilities, close to their homes, and its environment is easy to adapt to, but its most labor intensity is big, and the income is low. The initiative of rural labor’s employment transference decision has surpassed the passivity. This study creates a causal relationship model among employment motives, environment cognition and the way of decision to better help understand the psychological process of the rural labor’s decisions of employment transference. The case study shows: firstly, the clearer the rural labor’s transferring employment motivation, the clearer their cognition of the significant positive influence on the environment, which improves the rural labor force’s expectations to transfer their employment and to resident in the city and helps them make better employment transference; secondly, while other influences of environmental cognition on decision-making method are not significant, the distance of employment has significant positive impact on decision-making, and the image of employment place has negative influence on decision-making, which shows that the decision’s initiative is influenced more directly by such factors as distance and image; and therefore, to improve the construction of the city where rural labor force have crowded in and to improve the urban employment image will help effectively transfer the rural labor force. The main disadvantages of this study are: the concepts and effective measurement about the environment cognition and decision mode still need more theoretical support and future’s further proof, and the only one-way causal relationship from motivation to environment cognitive and to decision has been validated while other relationships still need to be further validated.
Key words: rural labor force; employment transference; spatial choice; Hefei City
ZHAO Chun-yu , SU Qin , LI Fei , TIAN Yan-zheng . The Spatial Choice of The Employment Transference of the Rural Labors: A Case Study of Hefei City[J]. SCIENTIA GEOGRAPHICA SINICA, 2013 , 33(4) : 418 -426 . DOI: 10.13249/j.cnki.sgs.2013.04.418
Table 1 The sample’s industry distribution and the demographic characteristics表1 调查样本的行业分布及其社会人口统计特征 |
| 建筑业人数 | 制造业人数 | 酒店餐饮业人数 | 其它人数 | ||
|---|---|---|---|---|---|
| 性别 | 男 | 68(26.2) | 47(18.1) | 25(9.6) | 14(5.4) |
| 女 | 7(2.7) | 29(11.2) | 46(17.7) | 24(9.2) | |
| 年龄 | ≤30 | 20(8.5) | 55(23.3) | 62(26.3) | 12(5.1) |
| 31~45 | 33(14.0) | 17(7.2) | 4(1.7) | 14(5.9) | |
| >45 | 12(5.1) | 2(0.8) | 0(0) | 5(2.1) | |
| 教育 | 小学及以下 | 9(3.6) | 0(0) | 0(0) | 10(4.0) |
| 初中 | 35(14.2) | 28(11.3) | 13(5.3) | 12(4.9) | |
| 高中(中专) | 16(6.5) | 30(12.1) | 36(14.6) | 13(5.3) | |
| 专科及以上 | 8(3.2) | 17(6.9) | 19(7.7) | 1(4.0) | |
| 婚姻 | 已婚 | 49(21.0) | 37(15.9) | 12(5.2) | 31(13.3) |
| 未婚 | 11(4.7) | 35(15.0) | 53(22.7) | 5(2.1) | |
| 来源地 | 合肥市 | 9(3.6) | 44(17.7) | 17(6.9) | 9(3.6) |
| 安徽省 (除合肥市) | 26(10.5) | 21(8.5) | 46(18.5) | 13(5.2) | |
| 外省 | 39(15.7) | 9(3.6) | 6(2.4) | 9(3.6) |
注:括号中百分比为某属性人数占该属性实际应答总数的比重,单位为%。 |
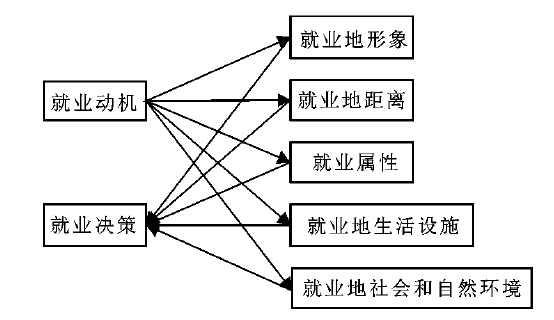
Fig. 1 The structure equation model of the spatial choice for rural labour’s transfer employment图1 农村劳动力转移就业空间决策路径模型构建 |
Table 2 Varimax factor analysis of rural labour’s transfer employment motivation, decision method and environment cognition表2 农村劳动力转移就业动机、决策方式与环境认知正交旋转因子分析 |
| 感知因子 | 均值 | 因子 载荷 | 特征根 | 解释方 差比例 | 感知因子 | 均值 | 因子 载荷 | 特征根 | 解释方 差比例 | ||
|---|---|---|---|---|---|---|---|---|---|---|---|
| 就业 动机 | 生存动机 务农收入低 进城务工收入高 农村太穷 农村没有致富机会 | 3.468 3.665 3.669 3.065 3.473 | 0.761 0.801 0.771 0.682 | 2.612 | 23.744% | 决策方式 | 被动决策 和老乡亲戚一起出来 在家收入低,出来试试 对外界情况不熟 失业时呆在家,等待工作 | 3.183 3.269 3.115 3.427 2.919 | 0.713 0.829 0.664 0.651 | 2.402 | 26.684% |
| 发展动机 学技术、长见识 城市就业机会多 为子女考虑 提高社会地位 想在城市生活 | 3.806 3.962 3.977 3.935 3.539 3.619 | 0.687 0.692 0.660 0.721 0.672 | 2.522 | 22.929% | 主动决策 家里收入低,必须出来 形成较固定的就业模式 对外环境熟悉后找工作 考虑了打工成本及收益 失业了呆在原就业地 | 3.371 3.354 3.454 3.327 3.546 3.173 | 0.531 0.714 0.758 0.756 0.549 | 2.337 | 25.970% | ||
| 精神动机 在家没事干 农村精神生活匮乏 | 3.027 2.904 3.150 | 0.784 0.710 | 1.481 | 13.459% | |||||||
| 就业地 形象 | A1:城市功能 经济发展速度快 商业发达 文化底蕴 自然环境好 科教发达 | 3.547 3.712 3.596 3.392 3.473 3.562 | 0.570 0.818 0.635 0.568 0.800 | 2.490 | 31.130% | 就业属性 | C1:劳动强度 工作时间较短 劳动强度不是很大 心理压力比较小 | 2.924 2.846 2.962 2.965 | 0.746 0.810 0.800 | 2.288 | 19.063% |
| A2:城市规模 对合肥各区熟悉 城市规模较大 省会城市 | 3.356 3.388 3.688 2.992 | 0.759 0.662 0.698 | 2.108 | 26.354% | C2:风险与保障 劳务纠纷能较好解决 签订了劳务合同 打工机会多,风险小 对就业机会充分了解 | 3.382 3.150 3.608 3.427 3.342 | 0.674 0.683 0.766 0.662 | 2.173 | 18.107% | ||
| 就业地 距离 | B1:社会联系 家乡在此打工的人多 与家乡社会联系多 这里有很多亲戚朋友 家乡人相互生活照应 | 3.278 3.254 3.338 3.215 3.304 | 0.866 0.605 0.826 0.852 | 2.646 | 33.073% | C3:劳动技能 对劳动技能要求较高 可以学到技术(技能) 容易获得就业培训 | 3.422 3.573 3.465 3.227 | 0.790 0.826 0.619 | 1.886 | 15.719% | |
| B2:交通距离 交通便利 交通成本低 离家近,可照顾家庭 离家近,想在此定居 | 3.646 3.962 3.658 3.531 3.435 | 0.805 0.814 0.718 0.630 | 2.423 | 30.287% | C4:劳动收入 收入比较高 如果其它城市有更好的工作,会离开 | 3.081 2.712 3.450 | 0.729 0.828 | 1.353 | 11.278% | ||
| 就业地 生活 设施 | D1:公共服务 医疗条件较好 社区服务较好 教育设施与水平较好 良好的公共交通设施 良好的商业设施 | 3.384 3.327 3.223 3.331 3.531 3.508 | 0.726 0.699 0.743 0.828 0.775 | 3.094 | 30.941% | 就业地社 会和自然 环境 | E1:自然环境 对当地气候很了解 完全适应当地气候 对当地饮食很了解 接受当地饮食习惯 对当地生态环境了解 | 3.577 3.400 3.696 3.646 3.773 3.373 | 0.594 0.755 0.803 0.750 0.584 | 2.872 | 28.725% |
| D2:房屋供应 很多单位提供公寓 能够租到满意的房屋 商品房房价可以接受 | 2.937 3.354 2.985 2.473 | 0.755 0.755 0.690 | 2.099 | 20.991% | E2:文化环境 对当地风俗很了解 接受就业地风俗习惯 了解当地的文化活动 经常和当地居民聊天等 考虑过和当地人交往 | 3.344 3.362 3.688 3.312 3.000 3.358 | 0.607 0.437 0.694 0.821 0.573 | 2.455 | 24.550% | ||
| D3:居留倾向 倾向郊区(县)买(租)房 比较关心当地房价 | 3.279 3.108 3.450 | 0.819 0.623 | 1.202 | 12.022% |
Table 3 Results of CFA for Overal Measurement Model表3 验证性因子分析整体测量模型结果 |
| 潜在变量 | 观测变量 | 完全标准化负荷 | 个体变量信度(SMC) | 误差方差 | t值 | AVE | CR |
|---|---|---|---|---|---|---|---|
| 就业地距离 | 交通距离 | 0.529 | 0.280 | 0.720 | - | 0.454 | 0.616 |
| 社会联系 | 0.793 | 0.629 | 0.371 | 7.298 | |||
| 就业地形象 | 城市规模 | 0.742 | 0.551 | 0.449 | - | 0.520 | 0.684 |
| 城市功能 | 0.699 | 0.489 | 0.511 | 9.972 | |||
| 就业地生活设施 | 居留倾向 | 0.298 | 0.088 | 0.911 | - | 0.401 | 0.633 |
| 房屋供应 | 0.585 | 0.300 | 0.658 | 4.378 | |||
| 公共服务 | 0.879 | 0.773 | 0.227 | 4.589 | |||
| 就业地社会和 自然环境 | 社会环境 | 0.793 | 0.629 | 0.371 | - | 0.587 | 0.739 |
| 自然环境 | 0.739 | 0.546 | 0.454 | 8.887 | |||
| 就业属性 | 劳动保险 | 0.667 | 0.445 | 0.555 | - | 0.414 | 0.678 |
| 劳动强度 | 0.589 | 0.347 | 0.653 | 7.554 | |||
| 劳动技能 | 0.670 | 0.449 | 0.551 | 7.872 | |||
| 就业动机 | 精神动机 | 0.564 | 0.318 | 0.682 | - | 0.388 | 0.652 |
| 发展动机 | 0.563 | 0.317 | 0.683 | 6.328 | |||
| 生存动机 | 0.727 | 0.529 | 0.471 | 6.956 | |||
| 就业决策 | 主动决策 | 0.753 | 0.567 | 0.433 | - | 0.496 | 0.661 |
| 被动决策 | 0.652 | 0.425 | 0.575 | 8.211 |
注:t值为临界比值,为参数估计值与估计值标准误的比值,t值大于2.58,说明参数估计值达到0.01显著水平。 |
Table 4 The goodness of fit between hypothetical structural equation and revised structure equation表4 初始假设模型与修正模型拟合度比较 |
| 拟合指标 | 绝对拟合指标 | 增值拟合指标 | 精简拟合指标 | ||||||
|---|---|---|---|---|---|---|---|---|---|
| χ2/df | GFI | RMSEA | AGFI | NFI | CFI | IFI | AIC | CAIC | |
| 理想数值 | 1~3 | ≥0.9 | <0.1 | ≥0.9 | ≥0.9 | ≥0.9 | ≥0.9 | 越小越好 | 越小越好 |
| 初始模型 | 3.609 | 0.851 | 0.100 | 0.785 | 0.750 | 0.801 | 0.806 | 476.528 | 690.880 |
| 修正模型 | 2.175 | 0.919 | 0.067 | 0.869 | 0.866 | 0.921 | 0.923 | 322.423 | 591.503 |
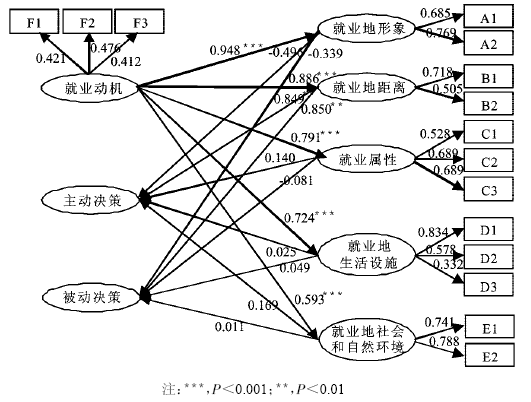
Fig.2 Parameter estimation of structural equation model of the spatial choice for rural labour’s transfer employment图2 农村劳动力转移就业空间决策的路径模型参数估计 |
The authors have declared that no competing interests exist.
| [1] |
|
| [2] |
|
| [3] |
|
| [4] |
|
| [5] |
|
| [6] |
|
| [7] |
James T Fawcett. Migration psychology: new behavioral models[J]. Population & Environment, 1985-1986,8(1-2):5-14.
|
| [8] |
|
| [9] |
|
| [10] |
|
| [11] |
|
| [12] |
|
| [13] |
|
| [14] |
沃姆斯利D J, 刘易斯G J 刘易斯G J行为地理学导论[M]. 王兴中,郑国强,李贵才译.西安:陕西人民出版社,1988.
|
| [15] |
|
| [16] |
|
| [17] |
|
| [18] |
|
| [19] |
合肥日报:合肥农村劳动力转移就业超百万[N/OL].
|
| [20] |
|
/
| 〈 |
|
〉 |