
Spatial Structure Impacts of High Speed Rail on Domestic Tourism Market in China
Received date: 2012-09-10
Request revised date: 2013-01-20
Online published: 2013-06-26
Copyright
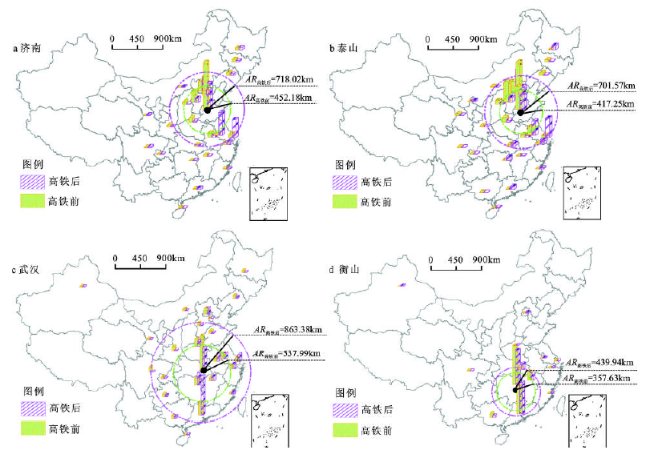
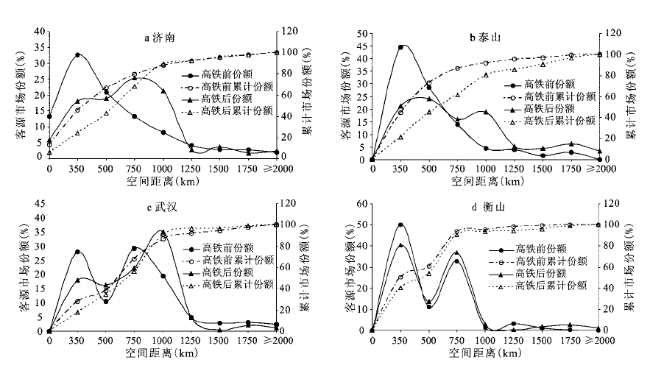
Transportation infrastructure is an indispensable prerequisite for developing tourism resources and constructing resorts, every new breakthrough in traffic technology allows the tourists to travel at a faster speed to a remoter destination. High speed rail (HSR) is a significant symbol of the worldwide “transportation revolution”, producing the remarkable effect of “space compression”. The “space compression” effect of HSR plays a significant role on the tourists’ travel space, thereby affecting the spatial structure of tourist source markets. On the basis of the case, Jinan, Taishan on Beijing-Shanghai HSR, and Wuhan, Hengshan on Wuhan-Guangzhou High speed rail, this article proves the impacts on the spatial structure of domestic source market by HSR from the point of attraction of spatial extent, spatial use curves of resorts, and spatial attractiveness of destination to source region, and concludes the new regularities of the tourist behaviors and spatial distribution of tourists in the age of HSR, laying the “cornerstone” for further study on the HSR’s impacts on the spatial pattern of regional tourism. The results show that: 1) the attractiveness radius of Jinan, Taishan, Wuhan, and Hengshan’s tourist market has been extended after the open of HSR. Therefore the number of source markets which may make large impacts on destination has increased, in particular, the number of major source markets that more significantly impact on the destinations, and the market share by remarkable margin. 2) The share of short-range source market has decreased obviously, while the medium, specifically the distance between 750 and 1 000 km, and long-range source market share have increased to different degrees. The 60% spatial extent of tourist markets have shown a trend of a significant expansion. 3) The “space compression” effect of HSR has improved the growth of attractiveness to tourist market, and the more remote of the distance, the more remarkable of the changes. The variability of attractiveness values and tourist demand have shown a significant correlation relationship. The change rate of spatial attractiveness value of destinations to tourist source and the change of tourist market demand are remarkably correlative, i.e. the more change of attractiveness, the more change of tourist market demand. It can also be seen that the effect of space compression produced by HSR exerts a significant accelerating function in the improvement of the attractiveness of destinations to tourist source markets, correspondingly promoting the significant growth of tourist market demand.
Key words: high speed rail; tourism market; space compression
WANG De-gen . Spatial Structure Impacts of High Speed Rail on Domestic Tourism Market in China[J]. SCIENTIA GEOGRAPHICA SINICA, 2013 , 33(7) : 797 -805 . DOI: 10.13249/j.cnki.sgs.2013.07.797
Fig.1 The distribution of tourist market and its attractiveness radius before, and after the open of high speed rail图1 高铁前后旅游地客源市场空间分布及吸引半径变化 |
Fig.2 The changes of tour spatial use curve before, and after the open of high speed rail图2 高铁前后旅游地空间使用曲线变化 |
Table 1 The changes in spatial attractiveness of Jinan and Taishan to main source market of Beijing-Shanghai high speed rail表1 济南和泰山对京沪线主要客源地的空间吸引力值变化 |
| 客源地 | 济 南 | 泰 山 | |||
|---|---|---|---|---|---|
| 建高铁前 | 建高铁后 | 建高铁前 | 建高铁后 | ||
| 济 南 | - | - | 8.0347 | 8.3953 | |
| 北 京 | 2.4275 | 10.0848 | 0.9822 | 7.1011 | |
| 天 津 | 6.1703 | 13.4980 | 2.7705 | 10.4340 | |
| 南 京 | 0.0143 | 0.6697 | 0.0750 | 1.3354 | |
| 无 锡 | 0.0005 | 0.1359 | 0.0013 | 0.1998 | |
| 苏 州 | 0.0003 | 0.1337 | 0.0009 | 0.1982 | |
| 上 海 | 0.0001 | 0.1866 | 0.0004 | 0.2827 | |
Table 2 The spatial attractiveness of Wuhan and Hengshan to main source market of Wuhan-Guangzhou high speed rail表2 武汉和衡山对武广线主要客源地的空间吸引力值变化 |
| 客源地 | 武 汉 | 衡 山 | |||||||
|---|---|---|---|---|---|---|---|---|---|
| 高铁前 | 高铁后 | 高铁前 | 高铁后 | ||||||
| 1999 | 2003 | 2011 | 2000 | 2004 | 2011 | ||||
| 武 汉 | - | - | - | 0.1442 | 0.1968 | 4.4568 | |||
| 长 沙 | 1.4756 | 1.2259 | 8.6006 | 4.5325 | 3.9819 | 12.8707 | |||
| 广 州 | 0.0004 | 0.0003 | 0.2628 | 0.0574 | 0.0733 | 2.0809 | |||
注:武汉1999年数据和衡山2004年数据分别来自参考文献[28]和[29]整理获得。 |
The authors have declared that no competing interests exist.
| [1] |
|
| [2] |
|
| [3] |
|
| [4] |
|
| [5] |
|
| [6] |
|
| [7] |
|
| [8] |
|
| [9] |
|
| [10] |
|
| [11] |
|
| [12] |
|
| [13] |
|
| [14] |
|
| [15] |
|
| [16] |
|
| [17] |
|
| [18] |
|
| [19] |
|
| [20] |
|
| [21] |
|
| [22] |
|
| [23] |
|
| [24] |
|
| [25] |
|
| [26] |
|
| [27] |
|
| [28] |
|
| [29] |
|
/
| 〈 |
|
〉 |