
Urban Spatial Structure Optimization of Zhoukou City
Received date: 2012-07-20
Request revised date: 2013-03-05
Online published: 2013-11-07
Copyright
The key to make scientific decision and to promote soundly and rapidly regional economic and social development is to optimize the urban spatial structure. Based on social and economic data of Zhoukou City, Hehan Province, from 1995 to 2010 and technical analysis such as town construction land area and urban population growth strength index, this article states the present urban development of Zhoukou City: low level of regional urbanization, under-developed urban center, equilibrium development of town layout and integrated urban built-up area of Zhoukou City and Shangshui County. Then, the study deeply analyses the mechanism of urban spatial structure evolution and the trend of center polarized and fan-shaped wild goose queue type circle-layer network evolution orientated by transport and led by characteristic industrial clusters. Finally, it puts forwards related countermeasures: to scientifically plan the regional urban system, to essentially boost the unity of Zhoukou City and Shangshui County, to rapidly form the characteristic industrial clusters, to orderly promote the circulation of rural land, to advance the coordinated development of urbanization, industrialization and agricultural modernization and to enhance the construction of ecological towns in order to optimize Zhoukou urban spatial structure.
Key words: Zhoukou City; urban spatial structure; growth pole; compound city
GUO Rong-chao , SONG Shuang-hua , XIA Bao-lin , FENG Yong-jie . Urban Spatial Structure Optimization of Zhoukou City[J]. SCIENTIA GEOGRAPHICA SINICA, 2013 , 33(11) : 1347 -1353 . DOI: 10.13249/j.cnki.sgs.2013.011.1347
Table 1 Economic and social comparison of Zhoukou City with other cities in Henan Province表1 周口市与河南其他省辖市经济社会发展比较 |
| 年份 | 项目 | 郑州 | 开封 | 洛阳 | 平顶山 | 安阳 | 鹤壁 | 新乡 | 焦作 | 濮阳 |
|---|---|---|---|---|---|---|---|---|---|---|
| 2010年 | 城镇化水平(%) | 63.6 | 36.0 | 44.3 | 41.4 | 38.6 | 48.0 | 41.1 | 47.1 | 31.5 |
| 建成区面积(km2) | 342.7 | 95.1 | 180.5 | 71.0 | 76.0 | 50.9 | 97.1 | 94.0 | 50.2 | |
| 人均GDP(万元) | 4.76 | 1.98 | 3.58 | 2.67 | 2.53 | 2.85 | 2.12 | 3.58 | 2.18 | |
| 2000年 | 城镇化水平(%) | 54.7 | 24.1 | 32.8 | 39.3 | 21.9 | 44.3 | 25.7 | 42.6 | 20.42 |
| 建成区面积(km2) | 133.0 | 67.0 | 104.0 | 46.0 | 45.0 | 34.0 | 60.0 | 52.0 | 27.0 | |
| 人均GDP(万元) | 1.17 | 0.49 | 0.68 | 0.57 | 0.50 | 0.61 | 0.53 | 0.70 | 0.59 | |
| 年份 | 项目 | 许昌 | 漯河 | 南阳 | 三门峡 | 商丘 | 信阳 | 周口 | 驻马店 | 济源 |
| 2010年 | 城镇化水平(%) | 39.1 | 39.2 | 33.0 | 44.3 | 29.8 | 34.4 | 29.7 | 29.8 | 49.4 |
| 建成区面积(km2) | 80.0 | 60.0 | 92.0 | 30.0 | 60.0 | 68.0 | 51.0 | 52.9 | 32.0 | |
| 人均GDP(万元) | 3.05 | 2.70 | 1.91 | 3.92 | 1.51 | 1.69 | 1.29 | 1.41 | 4.05 | |
| 2000年 | 城镇化水平(%) | 19.2 | 28.9 | 16.4 | 37.8 | 14.7 | 16.9 | 11.0 | 11.7 | 38.2 |
| 建成区面积(km2) | 25.0 | 26.0 | 37.0 | 22.2 | 36.0 | 32.0 | 18.0 | 22.0 | 22.0 | |
| 人均GDP(万元) | 0.66 | 0.67 | 0.50 | 0.78 | 0.36 | 0.34 | 0.33 | 0.35 | 0.93 |
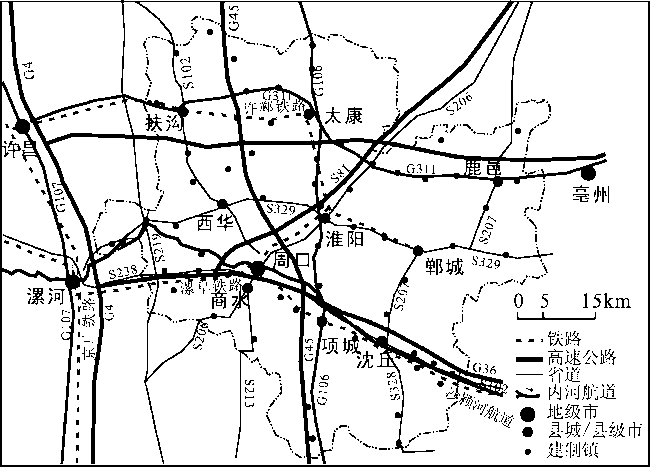
Fig.1 The urban space distribution in Zhoukou图1 周口市域城镇空间分布现状 |
Table 2 Population growth and built-up area expanded strength index of Zhoukou City (central districts and counties)表2 周口市域城镇(县城以上)人口增长及建成区面积扩展强度指数 |
| 年份 | 项目 | 中心 城市 | 扶沟 县城 | 西华 县城 | 商水 县城 | 沈丘 县城 | 郸城 县城 | 淮阳 县城 | 太康 县城 | 鹿邑 县城 | 项城 市 |
|---|---|---|---|---|---|---|---|---|---|---|---|
| 2010年 | 城镇人口(万人) | 56.20 | 11.70 | 11.00 | 21.10 | 18.07 | 22.45 | 22.00 | 22.15 | 28.70 | 29.82 |
| 建成区面积(km2) | 51.00 | 13.60 | 14.00 | 19.80 | 14.20 | 19.26 | 31.90 | 20.15 | 32.00 | 30.00 | |
| 2005年 | 城镇人口(万人) | 22.80 | 9.82 | 9.13 | 6.82 | 14.00 | 10.80 | 13.46 | 9.31 | 12.20 | 25.00 |
| 建成区面积(km2) | 40.00 | 11.00 | 9.30 | 10.08 | 11.35 | 10.20 | 27.10 | 14.00 | 18.20 | 24.00 | |
| 1995年 | 城镇人口(万人) | 18.90 | 4.96 | 7.01 | 4.78 | 10.10 | 6.81 | 7.25 | 7.14 | 4.60 | 15.00 |
| 建成区面积(km2) | 14.00 | 10.50 | 6.20 | 6.00 | 9.74 | 6.03 | 19.86 | 9.75 | 7.80 | 12.90 | |
| 1995~2005年均增长人口(万人) | 0.39 | 0.49 | 0.21 | 0.20 | 0.39 | 0.40 | 0.62 | 0.22 | 0.76 | 1.00 | |
| 1995~2005年均扩展面积(km2) | 2.60 | 0.05 | 0.31 | 0.41 | 0.16 | 0.42 | 0.72 | 0.42 | 1.04 | 1.11 | |
| 2005~2010年均增长人口(万人) | 6.68 | 0.38 | 0.37 | 2.86 | 0.81 | 2.33 | 1.71 | 2.57 | 3.30 | 0.96 | |
| 2005~2010年均扩展面积(km2) | 2.20 | 0.52 | 0.94 | 1.94 | 0.57 | 1.81 | 0.96 | 1.23 | 2.76 | 1.20 | |
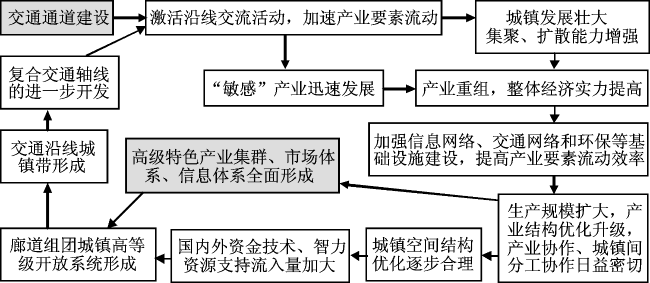
Fig. 2 Traffic constructions and urban spatial structure optimization图2 交通通道建设与城镇空间结构优化 |
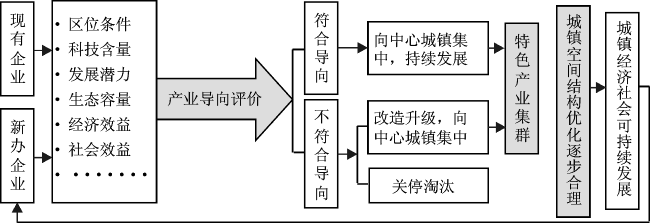
Fig.3 Characteristic industrial clusters and urban spatial structure optimization图3 特色产业集群与城镇空间结构优化 |
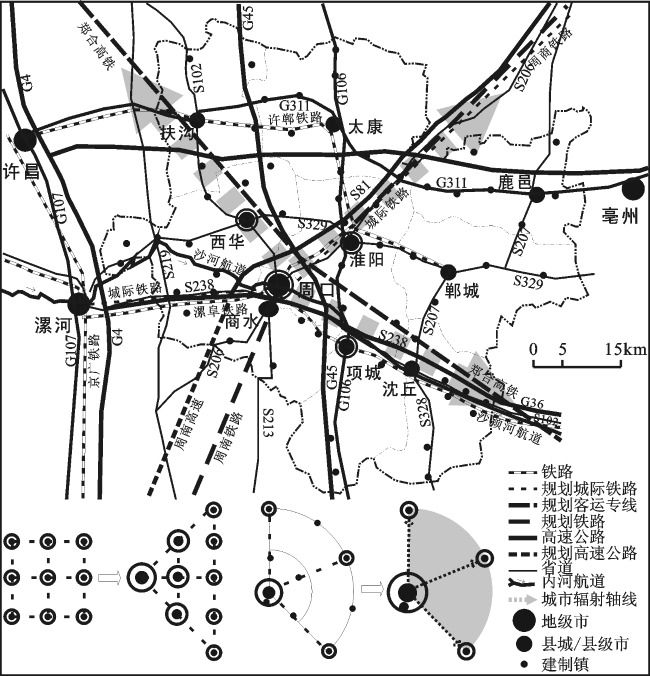
Fig.4 Evolution trends of urban spatial structure in Zhoukou图4 周口市域城镇空间结构演化趋势 |
The authors have declared that no competing interests exist.
| [1] |
|
| [2] |
|
| [3] |
|
| [4] |
|
| [5] |
|
| [6] |
|
| [7] |
|
| [8] |
|
| [9] |
|
| [10] |
|
| [11] |
|
| [12] |
|
| [13] |
|
| [14] |
|
| [15] |
|
| [16] |
|
| [17] |
|
| [18] |
|
| [19] |
|
| [20] |
|
| [21] |
|
| [22] |
|
| [23] |
|
| [24] |
|
| [25] |
|
/
| 〈 |
|
〉 |