
Multidimensional Poverty Measurement and Spatial Distribution Pattern at the Country Scale:A Case Study on Key Country from National Contiguous Special Poverty-stricken Areas
Received date: 2013-03-20
Request revised date: 2013-06-03
Online published: 2013-12-20
Copyright
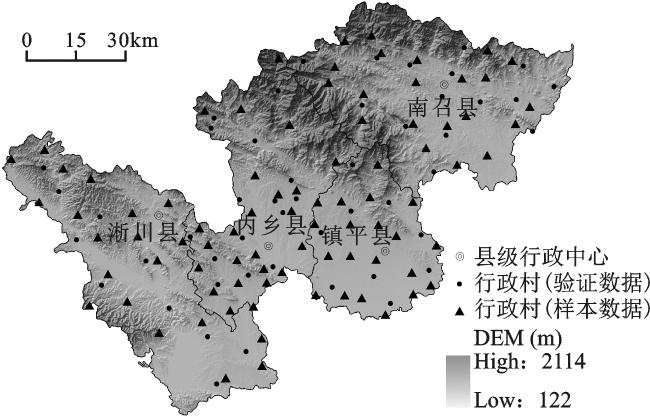
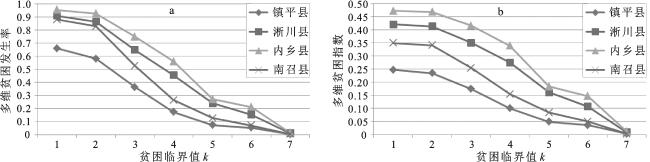
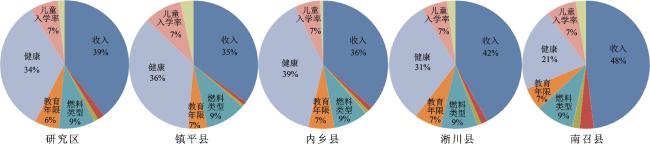
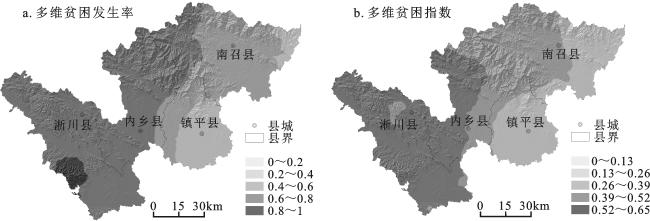
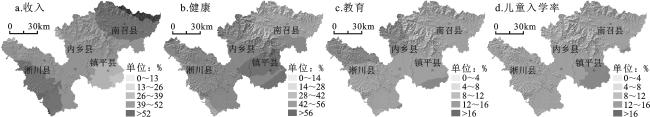
In special poverty-stricken rural areas, the primary problem of poverty alleviation is effective targeting and identifying of the poor and their distribution area. In recent years, researchers around the world focused on grasping the essence of multidimensional poverty and measurement. Based on systematic design of multidimensional poverty identifying indices system and algorithm flow, this article takes key country in Nanyang, Henan Province from national contiguous special poverty-stricken areas as the study area, constructs algorithm based on the “dual cutoff” and "dimension aggregated/decomposition" to measure and analyze the multidimensional poverty of the poor at "county-village"scale,uses Kriging method to interpolate results of multidimensional poverty measurements and systematically analyze spatial distribution pattern of multidimensional poverty at village scale in study area.The result shows: in the study area,the trend of multidimensional poverty headcount ratio and multidimensional poverty index(MPI) is that the value of west is higher than that of the east;the MPI of Neixiang country and Xichuan country is the highest,that of Zhenping country is the lowest.Their primary factors contributing to poverty are income and health,contribution of income index to the poverty appears as strip from "northwest-southeast",healthy problem mainly concentrates around Zhenping country. Their secondary factors contributing to poverty are education,schooling and fuel.Besides,the multidimensional poverty incidence is the highest in mountainous area in Xichuan country,MPI is relatively lower around the center of the country.
WANG Yan-hui , QIAN Le-yi , DUAN Fu-zhou . Multidimensional Poverty Measurement and Spatial Distribution Pattern at the Country Scale:A Case Study on Key Country from National Contiguous Special Poverty-stricken Areas[J]. SCIENTIA GEOGRAPHICA SINICA, 2013 , 33(12) : 1489 -1497 . DOI: 10.13249/j.cnki.sgs.2013.012.1489
Fig.1 Location of the study area and spatial distribution of sampling points图1 研究区地理位置和采样点空间分布 |
Table 1 Distribution of survey data表1 抽样调查数据分布 |
| 县 | 样本数据 | 验证数据 | ||||||
|---|---|---|---|---|---|---|---|---|
| 乡镇(个) | 行政村(个) | 乡镇覆盖率(%) | 行政村覆盖率(%) | 乡镇(个) | 行政村(个) | 乡镇覆盖率(%) | 行政村覆盖率(%) | |
| 内乡 | 15 | 24 | 93.8 | 8.3 | 9 | 15 | 56.3 | 5.2 |
| 镇平 | 17 | 20 | 77.3 | 4.9 | 8 | 9 | 36.4 | 2.2 |
| 淅川 | 10 | 20 | 58.8 | 3.8 | 8 | 10 | 47.1 | 1.9 |
| 南召 | 13 | 24 | 61.9 | 7.1 | 12 | 15 | 57.1 | 4.4 |
| 总计 | 55 | 88 | 72.4 | 5.6 | 37 | 49 | 48.7 | 3.1 |

Table 2 Multidimensional poverty measurement indices of demonstration area表2 贫困人口多维测算指标体系 |
| 维度 | 指标 | 剥夺临界值 | 权重 |
|---|---|---|---|
| 经济福利 | 人均纯收入 | 根据每年的扶贫标准判断,低于标准赋值1,否则为0 | 1/4 |
| 生活水平 | 房屋结构 | 砖木结构以及钢筋混泥土结构属于非贫困,赋值0,否则为1 | 1/20 |
| 饮水情况 | 浅井水、深井水、自来水为安全水,赋值0,否则为1 | 1/20 | |
| 通电情况 | 通电为0,没通电为1 | 1/20 | |
| 资产 | 拥有生活耐用品、交通工具、家用电器数量小于2,赋值1 | 1/20 | |
| 燃料类型 | 以“柴草、秸秆”为燃料的赋值为1,否则为0 | 1/20 | |
| 健康 | 家庭健康 | 在户表中如果有一个成员的身体不健康,赋值为1,否则为0 | 1/4 |
| 教育 | 平均教育年龄 | 所有成员的平均教育年限,如果大于5 a赋值0,否则为1 | 1/8 |
| 儿童入学率 | 至少一名儿童失学,赋值为1 | 1/8 |
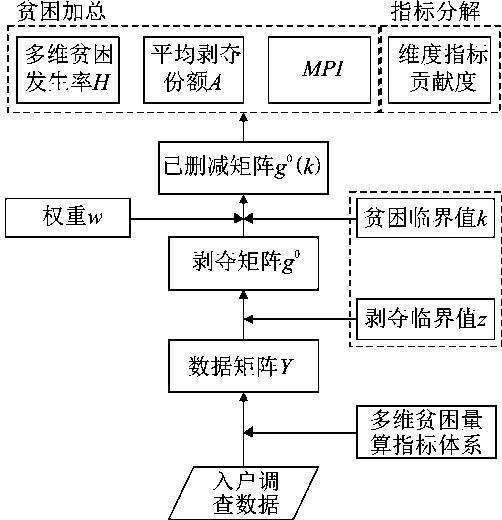
Fig. 2 The basic sketch of Algorithm for Multidimensional poverty measurement图2 多维贫困测算流程 |
Table 3 The Interpretation of Multidimensional poverty measurement variables表3 多维贫困测算变量释义 |
| 变量名 | 释 义 |
|---|---|
| 数据矩阵Y | 数据矩阵Y(n×d)是用来存储农户个体的指标信息。n表示测算个体数量,d表示指标数量。 |
| 剥夺临界值z | 剥夺临界值z(1×d)是测定各指标是否被剥夺的阈值。 |
| 剥夺矩阵g0 | 剥夺矩阵g0(n×d)是用来存储农户个体被剥夺的情况。如果农户在某一指标下是被剥夺的,赋值1,否则,赋值0。 |
| 贫困临界值k | 贫困临界值k表示确定为贫困个体的维度数。其中,0≤k≤d,多维贫困测算k一般取值2到d之间。 |
| 已删减矩阵g0(k) | 已删减矩阵g0(k)是用来存储贫困个体被剥夺的情况。与剥夺矩阵的区别在于已删减矩阵对剥夺矩阵中非贫困个体被剥夺的指标进行了归零处理。 |
| 多维贫困发生率H | 多维贫困发生率H=q/n,其中,q表示多维贫困人口,n表示研究区域总人口。 |
| 平均剥夺份额A | 平均剥夺份额,其中,Ci(k)表示在贫困临界值为K的情况,个体i被剥夺的指标数量;q表示多维贫困人口。 |
| 多维贫困指数MPI | MPI是表示一个地方贫困状况的综合指标,公式为MPI=HA。 |
| 指标贡献度 | 指标贡献度=,其中表示第i指标的权重值;CHi表示第i指标被剥夺的人口率。 |
Table 4 One-dimensional poverty measurement表4 单维度的贫困测算 |
| 县 | 收入 | 房屋结构 | 饮用水 | 通电情况 | 燃料 | 健康 | 教育年限 | 儿童入学率 |
|---|---|---|---|---|---|---|---|---|
| 镇平 | 29.6% | 6.4% | 11.5% | 0.3% | 90.7% | 28.7% | 9.0% | 20.6% |
| 淅川 | 73.5% | 12.0% | 9.7% | 1.5% | 95.3% | 51.7% | 24.8% | 19.7% |
| 南召 | 77.7% | 26.0% | 14.7% | 0.8% | 90.7% | 24.7% | 15.4% | 16.0% |
| 内乡 | 69.1% | 15.4% | 7.3% | 1.1% | 95.2% | 75.2% | 28.1% | 17.8% |
| 总计 | 62.5% | 15.0% | 10.8% | 0.9% | 93.0% | 45.1% | 19.3% | 18.5% |
Table 5 Comparison between result of multidimensional poverty measurement and one-dimension poverty measurement of study area表5 研究区多维贫困测算结果与收入单维度 测算结果比较 |
| k | H | A | MPI | 收入贫困发生率 |
|---|---|---|---|---|
| 1 | 0.867 | 0.445 | 0.386 | 0.625 |
| 2 | 0.820 | 0.461 | 0.378 | 0.625 |
| 3 | 0.595 | 0.527 | 0.314 | 0.625 |
| 4 | 0.387 | 0.600 | 0.232 | 0.625 |
| 5 | 0.187 | 0.674 | 0.126 | 0.625 |
| 6 | 0.133 | 0.701 | 0.093 | 0.625 |
| 7 | 0.009 | 0.817 | 0.007 | 0.625 |
| 8 | 0 | -- | -- | 0.625 |
Fig. 3 Change of multidimensional poverty status with different k图3 不同k值多维贫困状况变化 |
Fig. 4 Contribution of indices to poverty in different scales图4 研究区不同尺度指标对贫困的贡献度 |
Table 6 Accuracy assessment result of spatial interpolation using different semivariogram models表6 不同半变异函数模型空间插值结果的精度评价 |
| 半变异函数模型 | 平均误差 | 均方根误差 | 平均标准误差 | 标准化平均误差 | 标准化均方根误差 | |||||
|---|---|---|---|---|---|---|---|---|---|---|
| H | MPI | H | MPI | H | MPI | H | MPI | H | MPI | |
| Circular | 0.0017 | 0.0011 | 0.2477 | 0.1541 | 0.2599 | 0.1537 | 0.0449 | 0.0126 | 1.0090 | 1.0050 |
| Spherical | 0.0016 | 0.0008 | 0.2479 | 0.1541 | 0.2601 | 0.1540 | 0.0439 | 0.0105 | 1.0090 | 1.0040 |
| Exponential | 0.0011 | 0.0011 | 0.2494 | 0.1547 | 0.2644 | 0.1561 | 0.0406 | 0.0119 | 0.9983 | 0.9938 |
| Gaussion | 0.0016 | 0.0007 | 0.2471 | 0.1537 | 0.2599 | 0.1539 | 0.0420 | 0.0100 | 1.0050 | 1.0030 |
| RQ | 0.0000 | -0.0003 | 0.2479 | 0.1539 | 0.2644 | 0.1558 | 0.0367 | 0.0031 | 1.0070 | 0.9922 |
| Hole Effect | 0.0010 | 0.0002 | 0.2460 | 0.1529 | 0.2548 | 0.1507 | 0.0416 | 0.0064 | 1.0310 | 1.0190 |
| K-Bessel | 0.0015 | 0.0006 | 0.2457 | 0.1532 | 0.2634 | 0.1552 | 0.0373 | 0.0086 | 0.9816 | 0.9903 |
3.2.2 研究区多维贫困状况空间格局分布 |
Table 7 Independent samples T-test表7 独立样本t检验 |
| 指标 | 方差方程的Levene检验 | 均值方程的 t 检验 | ||||
|---|---|---|---|---|---|---|
| F | Sig. | t | df | Sig.(双侧) | ||
| H | 假设方差相等 | 2.571 | 0.112 | -0.427 | 96 | 0.670 |
| 假设方差不相等 | -0.0427 | 89.888 | 0.670 | |||
| MPI | 假设方差相等 | 1.629 | 0.205 | -0.383 | 96 | 0.703 |
| 假设方差不相等 | -0.383 | 89.956 | 0.703 | |||
Fig. 5 Spatial distribution of multidimensional poverty status in study area图5 研究区多维贫困状况空间分布 |
Fig. 6 Spatial distribution of the contribution of different index to poverty图6 不同指标对贫困贡献度空间分布 |
The authors have declared that no competing interests exist.
| [1] |
国家统计局住户调查办公室.中国农村2011贫困监测报告[R].北京:中国统计出版社,2012:11~14.
|
| [2] |
|
| [3] |
|
| [4] |
|
| [5] |
|
| [6] |
|
| [7] |
|
| [8] |
|
| [9] |
|
| [10] |
|
| [11] |
|
| [12] |
|
| [13] |
RavallionMartin.On multidimensional indices of poverty[J].Journal of Economic Inequality,2011,9(2):235-248.
|
| [14] |
|
| [15] |
|
| [16] |
|
| [17] |
|
| [18] |
|
| [19] |
|
| [21] |
|
| [20] |
|
| [22] |
|
| [23] |
|
| [24] |
|
/
| 〈 |
|
〉 |