
Spatial Agglomeration Characteristics of from 3A-class to 5A-class Scenic Spots in China
Received date: 2017-11-14
Request revised date: 2018-02-03
Online published: 2018-11-20
Supported by
National Key Research & Development Project (2017YFC0506401), National Natural Science Fundation of China (41701164)
Copyright
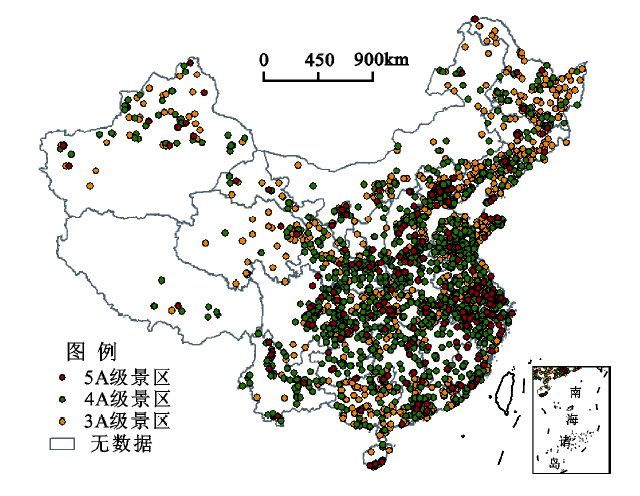
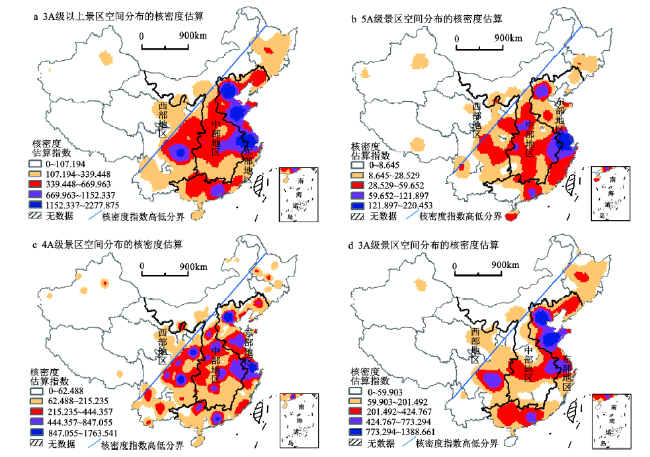
Tourism scenic spots are indicative indicators for the development of China’s tourism industry. Research on spatial distribution of tourism scenic spots has great significance for the optimization of regional tourism development. Based on the data of 3 228 more than 3A-class tourist scenic areas (spots) in China Hongkong, Macou and Taiwan are excluded, using the method of kernel density, average nearest neighbor, spatial analysis and other methods, this article analyze the level, type, the geographical distribution of the scenic spots in China. Research shows that China’s more than 3A-class tourism scenic spots have typical characteristics of type polarizable, regional differentiation and plate agglomeration. There is a great disparity in the density of scenic spots on both sides of the Hu line. There are a lot of scenic spots in half of the country in the Southeast especially in the Beijing Tianjin area, the Pan Yangtze River Delta city group, the Pearl River Delta city group, the Chengdu Chongqing Region, while the northwest and northeastern regions are less distributed. The distribution of tourism attractions in the middle east and western regions is extremely unbalanced. The middle east regions present between cluster and random distribution, while western regions is characterized by significant cluster characteristics. Different levels of tourist attractions show a different distribution structure. The spatial distribution of 5A-class tourist attractions in China is ‘cross-shaped’, including the Beijing Tianjin Hebei region which is centered on Beijing and the Yangtze River Delta, on Shanghai especially in the Yangtze River Delta. The distribution characteristics of China’s 4A-class tourist attractions along the Yangtze River and the Yellow River, are more obvious, which is showing the distribution characteristics of ‘two lines and two pieces’. The distribution of the 3A-class scenic spots in China is characterized by the linear distribution along the coastline and the agglomeration of the Chengdu and Chongqing Region. In addition, the distribution characteristics in different types of scenic spots in the three regions of China show great differences and different characteristics. The distributed diversity are related to the forming factors of scenic spots including historical popularity, quality of tourism resources, geographical environment, level of population economic development, historical and cultural district, traffic conditions and other factors. In the future, the development strategy should be optimized with regional balance, cross district coordination and classification optimization.
Key words: scenic spots; spatial analysis; agglomeration characteristic; China
Li Peng , Yu Hu , Wang Yingjie . Spatial Agglomeration Characteristics of from 3A-class to 5A-class Scenic Spots in China[J]. SCIENTIA GEOGRAPHICA SINICA, 2018 , 38(11) : 1883 -1891 . DOI: 10.13249/j.cnki.sgs.2018.11.016
Table 1 Classification of A-class tourist scenic spots表1 A级旅游景区分类 |
| 主 类 | A自然类景观 | 景区举例 | B人文类景观 | 景区举例 |
|---|---|---|---|---|
| AA山岳类景区 | 黄山、武夷山 | BA遗址遗迹类景区 | 兵马俑、十三陵 | |
| AB岩洞类景区 | 本溪水洞 | BB建筑与工程类景区 | 鸟巢、长城 | |
| AC江河类景区 | 壶口瀑布、三峡 | BC古典园林类景区 | 颐和园、拙政园 | |
| 亚 类 | AD湖泊类景区 | 青海湖、千岛湖 | BD宗教文化类景区 | 五台山、少林寺 |
| AE海滨海岛类景区 | 蜈支洲岛、金石滩 | BE民俗风情类景区 | 巴尔虎民俗景区 | |
| AF特殊地貌类景区 | 石林、张家界 | BF特产饮食类景区 | 王府井 | |
| AG生物景观类景区 | 森林公园、动物园 | BG文化艺术类景区 | 艺术馆、博物馆 | |
| AH气候天象类景区 | 吉林雾凇 | BH城乡风貌类景区 | 上海外滩、乌镇 |
Fig.1 Distribution of A-class tourism scenic spots in China图1 中国A级景区空间分布 |
Table 2 Spatial agglomeration features of tourism scenic spots in the three major areas of China表2 中国三大地区旅游景区空间集聚特征 |
| 景区类型 | R(最邻近指数) 东部地区 中部地区 西部地区 | P (显著度水平) 东部地区 中部地区 西部地区 | 分布状态 东部地区 中部地区 西部地区 | |||||||||
|---|---|---|---|---|---|---|---|---|---|---|---|---|
| 主类 亚类 | 0.8399 | 0.8482 | 0.6108 | 0 | 0 | 0 | 凝聚型 | 凝聚型 | 凝聚型 | |||
| 自然类型景区 | 山岳类 | 1.0236 | 0.8905 | 0.8443 | 0.5311 | 0.0132 | 0.0115 | 随机型 | 凝聚型 | 凝聚型 | ||
| 岩洞类 | 1.2691 | 0.6775 | 0.6034 | 0.0087 | 0.0021 | 0.0013 | 离散型 | 凝聚型 | 凝聚型 | |||
| 江河类 | 1.1302 | 0.9626 | 0.9265 | 0.1588 | 0.6279 | 0.4573 | 随机型 | 随机型 | 凝聚型 | |||
| 湖泊类 | 0.9975 | 0.9117 | 0.8694 | 0.9652 | 0.1912 | 0.0938 | 随机型 | 随机型 | 凝聚型 | |||
| 海滨海岛类 | 0.6605 | 0 | 0 | 0.0002 | 0 | 0 | 凝聚型 | 无 | 无 | |||
| 特殊地貌类 | 1.0181 | 1.0761 | 0.7282 | 0.6978 | 0.1371 | 0 | 随机型 | 随机型 | 凝聚型 | |||
| 生物景观类 | 1.1101 | 1.1052 | 0.9028 | 0.1218 | 0.2545 | 0.2932 | 随机型 | 随机型 | 随机型 | |||
| 气候天象类 | 1.1002 | 0.1859 | 0 | 0.2833 | 0.0276 | 0 | 随机型 | 凝聚型 | 无 | |||
| 人文类型景区 | 遗址遗迹类 | 0.7207 | 0.9423 | 0.5625 | 0 | 0.2391 | 0 | 凝聚型 | 随机型 | 凝聚型 | ||
| 建筑与工程类 | 1.0876 | 0.9625 | 0.5360 | 0.2139 | 0.6713 | 0.0001 | 随机型 | 随机型 | 凝聚型 | |||
| 古典园林类 | 0.4971 | 0.8825 | 2.0737 | 0.0002 | 0.6532 | 0.0004 | 凝聚型 | 随机型 | 离散型 | |||
| 宗教文化类 | 1.1999 | 0.9187 | 0.7817 | 0.0019 | 0.3077 | 0.0024 | 离散型 | 随机型 | 凝聚型 | |||
| 民俗风情类 | 1.1479 | 1.0222 | 0.4916 | 0.0216 | 0.6970 | 0 | 离散型 | 随机型 | 凝聚型 | |||
| 特产饮食类 | 0.7992 | 1.2835 | 0.7012 | 0.0298 | 0.0720 | 0.0325 | 凝聚型 | 离散型 | 凝聚型 | |||
| 文化艺术类 | 0.7947 | 0.7803 | 0.5868 | 0.0002 | 0.0008 | 0 | 凝聚型 | 凝聚型 | 凝聚型 | |||
| 城乡风貌类 | 0.8109 | 0.9991 | 0.5888 | 0 | 0.9826 | 0 | 凝聚型 | 随机型 | 凝聚型 | |||
注:东、中、西部范围见图2。 |
Fig.2 Spatial structure of 3A-5A class tourism scenic spots in China图2 中国3A级以上旅游景区空间分布 |
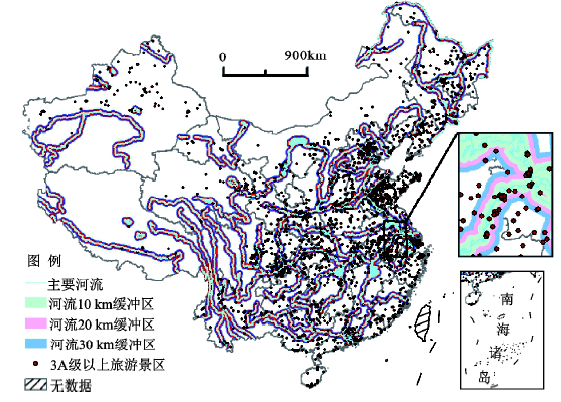
Fig.3 Correlation analysis of major rivers in China图3 河流水系关联 |
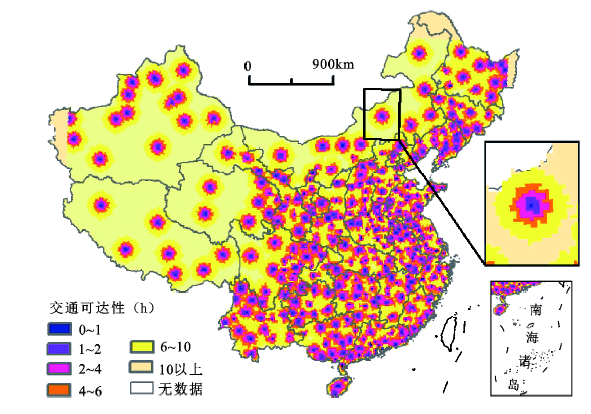
Fig.4 Traffic accessibility analysis of tourist attractions图4 交通可达性 |
The authors have declared that no competing interests exist.
| [1] |
[
|
| [2] |
[
|
| [3] |
[
|
| [4] |
[
|
| [5] |
[
|
| [6] |
[
|
| [7] |
[
|
| [8] |
|
| [9] |
[
|
| [10] |
[
|
| [11] |
|
| [12] |
|
| [13] |
[
|
| [14] |
|
| [15] |
|
| [16] |
|
| [17] |
|
| [18] |
[
|
| [19] |
国家统计局. 2010年第六次全国人口普查主要数据[M]. 北京: 中国统计出版社,2011.
[National Bureau of the People’s Republic of China. Main data of the sixth national census in 2010. Beijing: China Statistics Press,2011.]
|
| [20] |
国家统计局. 中国统计年鉴[M]. 北京: 中国统计出版社,2010-2016.
[National Bureau of the People’s Republic of China.Statistical yearbook of China. Beijing: China Statistics Press,2010-2016.]
|
/
| 〈 |
|
〉 |