
The Mechanism and Effect of Urbanization and Real Estate Investment on Carbon Emissions in China
Received date: 2018-01-08
Request revised date: 2018-05-15
Online published: 2019-04-10
Supported by
National Natural Science Foundation of China (71774142), Humanities and Social Sciences Project of Ministry of Education (17YJAZH022), Key Project of Philosophy and Social Science Research of the Ministry of Education (18JZD033)
Copyright
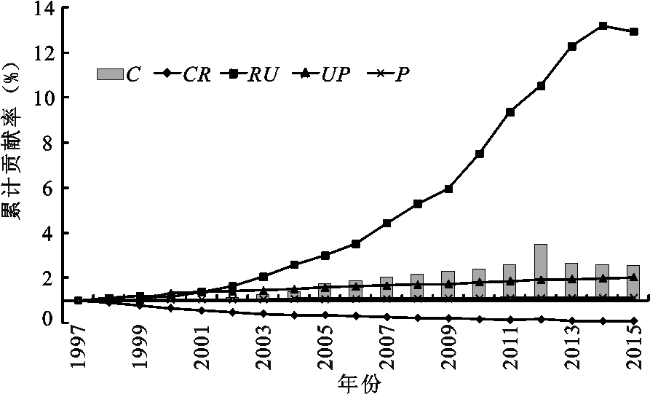
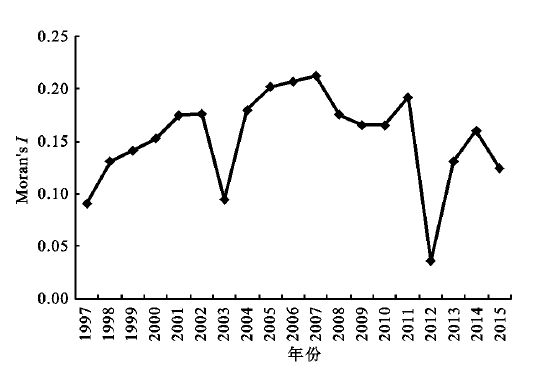
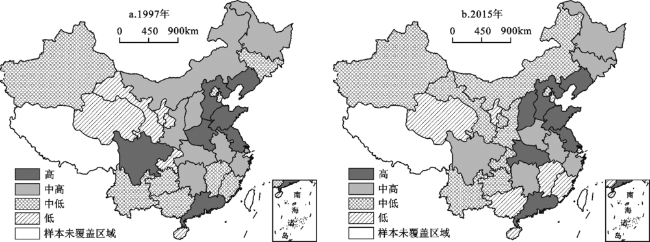
Urbanization and real estate investment are important influencing factors of carbon emission in a region. Therefore, it is necessary to systematically analyze and test the internal impact mechanism of urbanization and real estate investment on carbon emission. Combining the deformation of Kaya identity and LMDI decomposition, this article decomposes the carbon emission changes of 30 provinces in China (due to data limitation, the data of Hong Kong, Macao, Taiwan and Tibet are not included in the study area) from 1997 to 2015. The spatial evolution characteristics of carbon emissions in Chinese provinces are described by Moran’s I index and LISA spatial agglomeration map. This article further uses the spatial panel data model to empirically test the effects of urbanization and real estate investment on carbon emission from both direct impact and spatial spillover effects. The results are as follow: First, from the time trend, China’s carbon emission has maintained a growth trend from 1997 to 2015. From the perspective of the decomposition factors of carbon emission, the carbon emission coefficient of real estate investment is the main driving factor to curb carbon emissions, while the intensity of urban real estate investment, the level of urbanization and the change of total population in the region have positive effects on carbon emission, and the effects are increasing year by year. Second, from the spatial distribution characteristics of carbon emission, there are significant differences for the carbon emission in the provincial-level, and the distribution characteristics are generally expressed as higher carbon emission in the east and lower in the west. The spatial concentration of provinces with less carbon emission has increased, and the regional differences among them have been shrinking. Third, from the regression results of the spatial panel data model, the direct impact of urbanization on carbon emission is significantly negative, but the spatial spillover effect is significantly positive. The direct effect of the intensity of urban real estate investment on carbon emission is positive, but its spillover effect is not significant. The direct effect and spatial spillover effect of the interaction between urbanization and the intensity of urban real estate investment are significantly negative. The direct effect and spatial spillover effect of economic development on carbon emission are significantly positive. The direct impact of government investment on carbon emission is significantly negative, but the spillover effect is not significant. Industrial structure has no significant direct effect on the carbon emission, but its spatial spillover effect is negatively negative. The degree of opening to the outside world has a significant negative direct effect on the carbon emission, but it has a positive effect on the carbon emission in the adjacent areas. With the improvement of the level of urbanization and economic development, there is a significant U-shaped and inverted U-shaped curve relationship between the two and carbon emission, respectively. This article further proposes countermeasures and suggestions to improve regional carbon emission reduction from the perspective of urbanization and real estate policies.
Fan Jianshuang , Zhou Lin . The Mechanism and Effect of Urbanization and Real Estate Investment on Carbon Emissions in China[J]. SCIENTIA GEOGRAPHICA SINICA, 2019 , 39(4) : 644 -653 . DOI: 10.13249/j.cnki.sgs.2019.04.014
Fig. 1 Cumulative contribution rate of the driving factors of carbon emission changes in China in 1997-2015图1 1997~2015年全国碳排放变化驱动因素的累积贡献率 |
Fig. 2 Moran’s I of carbon emission in China in 1997-2015图2 1997~2015年全国碳排放量Moran’s I指数 |
Fig.3 Spatial distribution four-bit bitmap of carbon emissions in 1997 and 2015图3 1997年和2015年碳排放空间分布四分位图 |
Fig.4 LISA spatial agglomeration of carbon emissions in 1997 and 2015图4 1997年和2015年碳排放LISA空间集聚 |
Table 1 Coefficient estimation and residual test for non-spatial panel model表1 非空间面板模型的系数估计和残差检验 |
| 变量名称 | 混合估计模型 | 空间固定 效应模型 | 时间固定 效应模型 | 空间和时间固定效应模型 |
|---|---|---|---|---|
| LM spatial lag | 23.158*** | 20.744*** | 2.201 | 1.873*** |
| LM spatial error | 2.558 | 11.396*** | 0.166 | 2.646*** |
| R-LM spatial lag | 45.160*** | 14.844*** | 4.317** | 1.624*** |
| R-LM spatial error | 24.560*** | 5.497** | 2.282 | 2.398*** |
Table 2 Estimation results of SDM model with the spatial and temporal effects表2 空间和时间效应下的SDM模型估计结果 |
| 变量名称 | 固定效应 模型 | 固定效应模型 (误差修正) | 随机效应 模型 |
|---|---|---|---|
| Wald spatial lag | 60.032*** | 54.029*** | 57.787*** |
| Wald spatial error | 56.403*** | 56.403*** | 55.130*** |
| Hausman | - 12.855 - | ||
注: ***、**和*分别表示在1%、5%、10%水平下显著;“-”表示无此项。 |
Table 3 The direct and spatial spillover effects on carbon emissions of variables表3 各变量对碳排放量的直接影响和空间溢出效应 |
| 变量名称 | 空间和时间固定效应模型 | ||
|---|---|---|---|
| 直接影响 | 空间溢出效应 | 总效应 | |
| lnUP | -0.229**(-2.404) | 1.312**(2.619) | 1.083*(1.991) |
| (lnUP)2 | -0.011**(-2.616) | 0.869*(2.611) | 0.858**(2.476) |
| lnRU | 0.240*(1.794) | 0.325(1.189) | 0.565**(2.128) |
| lnUP×lnRU | -0.157**(-2.123) | -0.315**(-2.627) | -0.471**(-2.606) |
| lny | 0.543***(3.409) | 0.675*(1.704) | 1.218***(2.924) |
| (lny)2 | 0.110***(2.816) | -0.333***(-4.076) | -0.223*(-2.873) |
| lnGI | -0.369***(-3.615) | -0.242(-0.991) | -0.611**(-2.559) |
| lnIS | 0.181(0.641) | -0.908**(-2.418) | -0.726(-1.005) |
| lnTrade | -0.035***(-3.186) | 0.084***(2.996) | 0.049(1.639) |
注:***、**和*分别表示在1%、5%、10%水平下显著。 |
The authors have declared that no competing interests exist.
| [1] |
[
|
| [2] |
[
|
| [3] |
|
| [4] |
[
|
| [5] |
[
|
| [6] |
|
| [7] |
|
| [8] |
[
|
| [9] |
[
|
| [10] |
[
|
| [11] |
[
|
| [12] |
[
|
| [13] |
|
| [14] |
|
| [15] |
|
| [16] |
|
| [17] |
|
| [18] |
[
|
| [19] |
[
|
| [20] |
[
|
| [21] |
[
|
| [22] |
中华人民共和国国家统计局.中国统计年鉴(1998-2016)[M].北京:中国统计出版社,1998-2016.
[National Bureau of Statistics of People's Republic of China. China statistical yearbook (1998-2016). Beijing: China Statistics Press, 1998-2016.]
|
| [23] |
国家统计局能源统计司.中国能源统计年鉴(1998-2016)[M].北京:中国统计出版社,1998-2016.
[Department of Energy Statistics, National Bureau of Statistics. China energy statistical yearbook (1998-2016). Beijing: China Statistics Press, 1998-2016.]
|
| [24] |
国家统计局国民经济综合统计司.新中国60年统计资料汇编(1998-2016)[M].北京:中国统计出版社,1998-2016.
[National Bureau of Statistics, National Bureau of Statistics. China compendium of statistics (1998-2016). Beijing: China Statistics Press, 1998-2016.]
|
| [25] |
[
|
| [26] |
|
/
| 〈 |
|
〉 |
