
Spatial Association of Urban Agglomeration and Its Economic Growth Effect Under the Influence of High-speed Railway
Received date: 2020-10-25
Online published: 2021-05-11
Supported by
Social Science Planning Project of Liaoning Province (L19BJY004), Key Project of Social Science Planning Fund of Liaoning Province (L17AJL004)
Copyright
Taking the urban agglomerations of the Yangtze River Delta, the Pearl River Delta and the middle-south of Liaoning Province as examples, using the relevant data of cities at the prefecture level and above in each urban agglomerations from 2009 to 2018, and with the aid of social network analysis and spatial measurement methods, this paper empirically studies the influence of high-speed railway construction on the spatial correlation pattern and economic growth effect of urban agglomeration. The results show that in terms of spatial association form, through the construction of high-speed railway, the node center of cities under the jurisdiction of each urban group has been improved and the relationship between cities is more closely. However, the ranking sequence of cities in urban groups varies, forming a spatial association sequence structure with different characteristics In the aspect of economic growth effect, high-speed railway construction promotes the coordinated economic development of urban agglomeration, and the higher the economic development level and spatial correlation degree of urban agglomeration, the higher the positive economic growth power of high-speed railway construction; The spatial spillover effects of high speed rail on economic growth in the Pearl River Delta, central and southern Liaoning and Yangtze River Delta Economic Zone were significantly positive and decreased in turn.
Qi Xin , Wang Lijun , Zhang Jiaxing , Wang Feiyue . Spatial Association of Urban Agglomeration and Its Economic Growth Effect Under the Influence of High-speed Railway[J]. SCIENTIA GEOGRAPHICA SINICA, 2021 , 41(3) : 416 -427 . DOI: 10.13249/j.cnki.sgs.2021.03.006
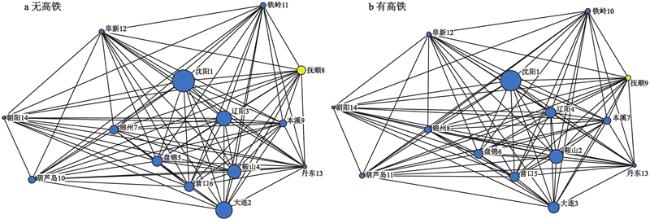
图 1 2018年有高铁作用和无高铁作用的辽中南城市群空间位序结构蓝色圆点表示高铁设站城市及其节点中心度位序,黄色圆点表示高铁未设站城市抚顺、河源、舟山及其节点中心度位序。节点面积越大,表示相应的节点城市在整个城市群网络中的“位序”越靠前,对城市群内其他城市的统领和辐射能力越强。以下图同上 Fig.1 Spatialrank structure map of Liaoning urban agglomeration with (without) high-speed railway in 2018 |
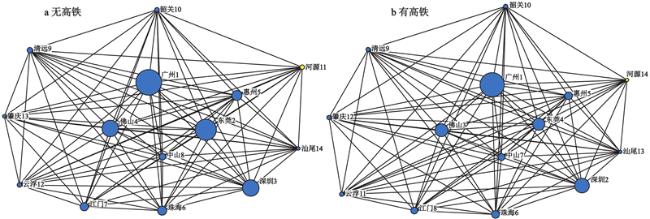
图 2 2018年有高铁作用和无高铁作用的珠三角城市群空间位序结构Fig.2 Spatial rank structure map of the Pearl River Delta Economic Zone with (without) high-speed railway in 2018 |
表 1 高铁建设对辽中南城市群经济增长的影响结果Table 1 Impact of high-speed railway construction on economic growth of central-south Liaoning Urban Agglomeration |
| 城市 | 有无高铁 | 节点中心度 | 财政支出 | 固定资产投资额 | 二产/三产 | 城市化率 |
| 沈阳 | 有 | 0.5629* | 0.4273 | 0.1788 | 0.5181* | 0.7824 |
| 无 | 0.6882*** | 0.1651 | 0.1753 | −0.9515 | ||
| 大连 | 有 | 1.1206** | 0.2991 | 0.2438 | 0.7318*** | 0.8773* |
| 无 | 0.5555*** | 0.5478 | 0.1707 | −0.0671 | ||
| 鞍山 | 有 | −0.1711 | 0.3647 | 0.7258 | 0.4887 | −0.2923 |
| 无 | 0.3481 | 0.7768* | 0.4654 | 0.9650 | ||
| 抚顺 | 有 | −0.4178* | 0.1743 | 0.3578 | 0.2399 | 3.0623 |
| 无 | 0.2847 | 0.5811* | 0.2117 | 2.0217 | ||
| 本溪 | 有 | −0.5665** | 0.4010 | 0.1752 | 0.3380** | 24.4484 *** |
| 无 | 0.8073*** | 0.3437 | 0.3118* | 7.1388 | ||
| 丹东 | 有 | 0.0111 | 0.6564** | 0.3651 | 0.7692** | 1.6549 |
| 无 | 0.6073** | 0.3646 | 0.7412*** | 0.6895 | ||
| 锦州 | 有 | −0.7234** | 0.2071 | 0.7919** | −0.4083 | −7.2990** |
| 无 | 0.1290 | 1.0626*** | −0.5044 | −5.0609 | ||
| 营口 | 有 | 0.0042 | 0.1412 | −1.0755*** | 1.8754*** | 29.1923*** |
| 无 | 0.2007 | −0.9071** | 1.7228*** | 25.9258*** | ||
| 阜新 | 有 | 0.2894 | 0.3791 | 0.8988* | 0.3730 | 0.0298 |
| 无 | 0.2887 | 0.8355* | 0.3560 | 0.0875 | ||
| 辽阳 | 有 | −0.2468 | 0.4429 | 0.4977* | 0.2537 | −0.1228 |
| 无 | 0.3434* | 0.1113** | 0.2036 | 0.0158 | ||
| 盘锦 | 有 | 0.0786 | 0.6750*** | 0.3325 | −0.0382 | −0.5072*** |
| 无 | 0.6811*** | 0.2226 | −0.0284* | −0.5186 | ||
| 铁岭 | 有 | 0.4804*** | 1.7735*** | −0.4511*** | 0.7239*** | −0.8701*** |
| 无 | 0.9527*** | −0.0688 | 0.5892*** | −0.9776 | ||
| 朝阳 | 有 | −0.9274* | −0.0174 | 0.3370 | 0.4083 | 1.8650 |
| 无 | 0.0084 | 0.5584 | 0.3448 | 1.3632 | ||
| 葫芦岛 | 有 | −0.3932 | 0.4642 | 0.1722 | 0.2313 | −0.4306 |
| 无 | 0.5845** | 0.1759 | 0.2659 | −0.4829 |
注:*、 **、 ***分别表示在10%、5%、1%水平下显著;表中空白表示无此项。 |
表 2 高铁建设对珠三角城市群经济增长的影响结果Table 2 Impact of high-speed rail construction on economic growth the Pearl River Delta Economic Zone |
| 城市 | 有无高铁 | 节点中心度 | 财政支出 | 固定资产投资额 | 二产/三产 | 城市化率 |
| 广州 | 有 | 0.0885* | 0.3305 | 0.1060 | −0.3991 | 8.9950** |
| 无 | 0.2540 | 0.0925* | −0.4629 | 8.5656** | ||
| 韶关 | 有 | −0.0714 | 0.7059** | 1.0411*** | 1.8884*** | −1.8424*** |
| 无 | 0.6673** | 0.9758*** | 1.8786*** | −1.4648 | ||
| 深圳 | 有 | 0.6682*** | 0.2481** | 0.0506 | −0.9100** | −53.0080*** |
| 无 | 0.4592*** | −0.0128 | −0.7125 | −18.8254 | ||
| 珠海 | 有 | 0.1999 | 0.7935 | −0.8178 | −0.7816 | 21.9006 |
| 无 | 0.7857 | −0.8692 | −1.0406 | 27.1816* | ||
| 佛山 | 有 | −0.2145 | −0.0206 | 0.7178 | −0.0573 | 9.6517 |
| 无 | 0.0348 | 0.4522 | 0.0279 | 5.8483 | ||
| 江门 | 有 | 0.1918 | 0.1401 | 0.4373 | −0.0021 | 0.2950 |
| 无 | 0.2123 | 0.3916 | −0.0173 | 1.1681 | ||
| 肇庆 | 有 | 0.1809 | 0.5513*** | 0.0259 | −0.0088 | 1.9853* |
| 无 | 0.4361* | 0.0953 | 0.2087 | 2.7561** | ||
| 惠州 | 有 | −0.0719 | −0.0508 | 0.3503 | −0.5927 | 2.7099 |
| 无 | 0.1027 | 0.1577 | −0.4189 | 1.9654 | ||
| 汕尾 | 有 | 0.1384 | −0.0237 | 0.8052 | 0.1686 | 0.0710 |
| 无 | −0.0493 | 0.8828* | 0.4434 | 0.5855 | ||
| 河源 | 有 | 0.2377*** | 0.3803*** | −0.1827 | −0.5951*** | −1.2449** |
| 无 | 0.7373*** | −0.3682* | −0.4230*** | −2.4258*** | ||
| 清远 | 有 | −0.0442 | 0.6939*** | 0.2768** | 0.0454 | 0.1203 |
| 无 | 0.3402*** | 0.0092 | 0.2097** | 3.0034*** | ||
| 东莞 | 有 | −0.0119 | 0.5134*** | 0.6082** | 0.3416 | 0.8851 |
| 无 | 0.5150*** | 0.6573*** | 0.3673* | 0.3953 | ||
| 中山 | 有 | −0.1459 | −0.1202 | 0.7400 | −0.2407 | 8.1746 |
| 无 | −0.1211 | 0.5738 | −0.0908 | 10.6754 | ||
| 云浮 | 有 | −0.0477 | 0.4540*** | 0.5261*** | 0.0803 | 0.2947** |
| 无 | 0.3739 | 0.1257 | 0.2908** | 2.2266 |
注:*、 **、 ***分别表示在10%、5%、1%水平下显著;表中空白表示无此项。 |
表 3 高铁建设对长三角城市群经济增长的影响结果Table 3 Impact of high-speed rail construction on economic growth the Yangtze River Delta Economic Zone |
| 城市 | 有无高铁 | 节点中心度 | 财政支出 | 固定资产投资额 | 二产/三产 | 城市化率 |
| 上海 | 有 | −0.0334 | 0.5887*** | −0.4985 | −0.0917 | 0.7290 |
| 无 | 0.6198*** | −0.4304 | −0.0728 | 0.3741 | ||
| 南京 | 有 | −0.0630 | 0.7960*** | −0.0221 | −0.2823 | 0.1559 |
| 无 | 0.9333*** | −0.0199 | 0.2816 | 0.4986** | ||
| 无锡 | 有 | 0.1402** | 1.5967*** | 1.7089** | 1.9864*** | −1.4007 |
| 无 | 1.6669*** | −0.0092 | 2.0028*** | 1.6126 | ||
| 常州 | 有 | 0.0178 | 0.1802 | 0.5643 | −0.5596 | −0.1098 |
| 无 | 0.1771 | 0.5121 | −0.5921 | −0.0265 | ||
| 苏州 | 有 | −0.0240 | 0.1361 | 0.5099*** | −0.4924 | 0.2223 |
| 无 | 0.1259 | 0.5130*** | −0.4705 | 0.2748 | ||
| 南通 | 有 | 0.0425 | 0.4714 | 1.1478*** | 1.9911** | −12.7258** |
| 无 | 0.4579 | 1.0532*** | 1.9235** | −5.6656* | ||
| 扬州 | 有 | 0.0692 | 0.2719 | 0.9936** | 0.8422 | 0.3821* |
| 无 | 0.1808 | 1.0389* | 0.5467 | 0.2927 | ||
| 镇江 | 有 | −0.0113 | 0.0332 | 1.1769*** | 0.8061*** | −20.4086*** |
| 无 | 0.0336 | 1.2064*** | 0.7860*** | −16.7224*** | ||
| 杭州 | 有 | 0.0867 | 0.8875*** | 0.6834* | 0.4340 | 0.0776 |
| 无 | 0.8559*** | 0.3794 | 0.2998 | 0.1125 | ||
| 宁波 | 有 | 0.0024 | 1.5056*** | −0.6201 | 2.2833*** | −0.6126 |
| 无 | 1.5282 | −0.6971 | 2.2849*** | −0.6080 | ||
| 嘉兴 | 有 | −0.1516* | 2.3648*** | −0.9079 | 4.1336*** | 2.6846*** |
| 无 | 2.6427*** | −1.0260** | 4.4464*** | 3.0628*** | ||
| 湖州 | 有 | −0.1244* | 2.1826*** | 0.4180 | 4.6635*** | 0.3662 |
| 无 | 1.8278*** | 0.7293* | 4.1751*** | 0.6682 | ||
| 绍兴 | 有 | −0.0213 | 0.4670 | 1.0551* | 0.3217 | 0.0254 |
| 无 | 0.4066 | 0.9445** | 0.3092 | 0.0679 | ||
| 舟山 | 有 | 0.0279 | 0.3445 | 0.7463 | −0.0339 | 0.3977 |
| 无 | 0.3467 | 0.6321 | −0.1051 | 0.2619 | ||
| 台州 | 有 | −0.1824** | 1.8447*** | −0.4676 | 3.0579*** | 0.4899** |
| 无 | 1.9864*** | −0.7625* | 3.0112*** | 0.6564 | ||
| 合肥 | 有 | −0.0172 | 0.8729*** | −0.0135 | 0.3784 | −0.0023 |
| 无 | 0.8748*** | −0.0181 | 0.3754 | 0.0048 | ||
| 芜湖 | 有 | 0.0065 | 0.3396 | 0.3358 | −0.2332 | −0.0601 |
| 无 | 0.3432 | 0.3326 | −0.2278 | −0.0609 | ||
| 马鞍山 | 有 | 0.0177 | 0.3991 | 0.5041 | 0.0722 | −0.0952 |
| 无 | 0.3771 | 0.5093 | 0.0712 | −0.1008 | ||
| 铜陵 | 有 | 0.1578** | 0.4109** | 0.3902 | −0.5812** | −0.1150 |
| 无 | 0.3762* | 0.3652 | −0.4304 | 0.0633 | ||
| 安庆 | 有 | −0.1230 | 0.6870** | 0.4733 | 1.8688*** | 0.4674*** |
| 无 | 0.5132 | 0.6447** | 1.7919*** | 0.5285*** | ||
| 滁州 | 有 | 0.0805 | −0.2009 | 0.5720* | −1.6342*** | 0.0123 |
| 无 | −0.2331 | 0.6175* | −1.4957** | 0.0070 | ||
| 池州 | 有 | 0.0779 | 0.2719 | 0.3513 | −0.6798 | 0.4233 |
| 无 | 0.2720 | 0.3492 | −0.6428 | 0.3099 | ||
| 宣城 | 有 | −0.1797** | 0.2737 | 0.7470** | 1.7822*** | 0.8009 |
| 无 | 0.0847 | 0.8779 | 1.5629*** | 1.2119 |
注:*、 **、 ***分别表示在10%、5%、1%水平下显著;表中空白表示无此项。 |
表 4 城市群的空间计量模型选择判定结果Table 4 Selection of spatial econometric models for urban agglomerations |
| 变量 | 长三角 | 珠三角 | 辽中南 | |||||
| 统计值 | P值 | 统计值 | P值 | 统计值 | P值 | |||
| Moran 's I | 0.17 | 0.05 | 0.06 | 0.03 | 0.16 | 0.07 | ||
| LMLAG | 0.14 | 0.74 | 0.02 | 0.88 | 0.10 | 0.74 | ||
| R_LMLAG | 0.52 | 0.47 | 0.60 | 0.43 | 1.54 | 0.21 | ||
| LMERR | 9.60 | 0.00 | 0.74 | 0.38 | 2.81 | 0.09 | ||
| R_LMERR | 10.00 | 0.00 | 1.33 | 0.25 | 4.24 | 0.03 | ||
| Wald_spatial_lag | 18.12 | 0.00 | 9.10 | 0.16 | 4.79 | 0.44 | ||
| LR_spatial_lag | 5.64 | 0.01 | 10.34 | 0.13 | 2.34 | 0.78 | ||
| Wald_spatial_error | 12.86 | 0.02 | 5.83 | 0.32 | 5.15 | 0.39 | ||
| LR_spatial_error | 3.63 | 0.02 | 9.87 | 0.65 | 3.23 | 0.32 | ||
| Hausman | 29.16 | 0.00 | 22.46 | 0.02 | 13.60 | 0.25 | ||
| 效应类型 | 固定效应 | 固定效应 | 随机效应 | |||||
| 适用模型 | 空间杜宾 | 空间误差 | 空间误差 | |||||
表 5 城市群高铁建设影响下的经济增长空间溢出效应Table 5 Spatial spillover effect of economic growth under the influence of high-speed railway construction in urban agglomerations |
| 变量 效应范围 | 珠三角 | 辽中南 | 长三角 | |||||
| 同域 | 溢出 | 同域 | 溢出 | 同域 | 溢出 | |||
| 高铁节点中心度(gt) | 0.02 | 0.35*** | 0.06 | 0.09* | 0.04 | 0.07* | ||
| 财政支出(cz) | 0.32** | 0.45*** | 0.63*** | 0.66*** | 0.33*** | 0.36*** | ||
| 固定资产(gd) | 0.19 | 0.39*** | 0.48*** | 0.39*** | 0.66*** | 0.60*** | ||
| 二三产业比值(esb) | 0.05 | −0.04 | 0.14*** | 0.12** | −0.12 | −0.29*** | ||
| 城市化率(ur) | 0.76 | −0.01 | 0.04 | 0.09* | 0.08*** | 0.04 | ||
| W×gt | −0.07 | |||||||
| W×cz | −0.01 | |||||||
| W×gd | 0.23*** | |||||||
| W×esb | −0.22* | |||||||
| W×ur | 0.09 | |||||||
| W×dep.var | −0.24*** | |||||||
| spat.aut. | −0.22*** | 0.13** | ||||||
| R2 | 0.85 | 0.88 | 0.82 | 0.83 | 0.92 | 0.95 | ||
| log-likelihood | −79.815 | −60.14 | −52.03 | −51.13 | −30.87 | −34.52 | ||
注:*,**,***分别表示在10%、5%、1%水平下显著,表中空白表示辽中南城市群和珠三角城市群不存在间接溢出。 |
| [1] |
王鹏, 李彦. 高铁对城市群经济集聚演化的影响——以中国三大城市群为例[J]. 城市问题, 2018, 274 (5): 62- 72.
Wang Peng, Li Yan. Influence of high-speed railway on economic agglomeration evolution of urban agglomeration: A case study of three major urban agglomerations in China[J]. Urban Problems, 2018, 274 (5): 62- 72.
|
| [2] |
王雨飞, 倪鹏飞. 高速铁路影响下的经济增长溢出与区域空间优化[J]. 中国工业经济, 2016, (2): 21- 36.
Wang Yufei, Ni Pengfei. Economic growth spillover and spatial optimization of high-speed railway[J]. China Industrial Economics, 2016, (2): 21- 36.
|
| [3] |
方大春, 孙明月. 高速铁路对长三角城市群经济发展影响评估——基于 DID 模型的实证研究[J]. 华东经济管理, 2016, 30 (2): 42- 47.
Fang Dachun, Sun Mingyue. An evaluation on the impact of high-speed rail on economic development of city clusters in the Yangtze River Delta — An empirical study based on difference in difference model[J]. East China Economic Management, 2016, 30 (2): 42- 47.
|
| [4] |
董艳梅, 朱英明. 高铁建设能否重塑中国的经济空间布局——基于就业、工资和经济增长的区域异质性视角[J]. 中国工业经济, 2016, (10): 92- 108.
Dong Yanmei, Zhu Yingming. Can high-speed rail construction reshape the layout of China’s economic space——based on the perspective of regional heterogeneity of employment[J]. Wage and Economic Growth. China Industrial Economics, 2016, (10): 92- 108.
|
| [5] |
Jiao Jingjuan, Wang Jiao’e, Zhang Fangni. Roles of accessibility, connectivity and spatial interdependence in realizing the economic impact of high-speed rail: Evidence from China[J]. Transport Policy, 2020, 91 (6): 1- 15.
|
| [6] |
Yang Zhiwei, Li Can, Jiao Jingjuan. On the joint impact of high-speed rail and megalopolis policy on regional economic growth in China[J]. Transport Policy, 2020, 99 (1): 20- 30.
|
| [7] |
张莉,赵英杰,陆玉麒,等. 中国铁路客运流联结的城市时间可达性[J]. 地理科学, 2020, 40 (3): 354- 363.
Zhang Li,Zhao Yingjie,Lu Yuqi et al. Urban time accessibility of railway passenger traffic flow in China[J]. Scientia Geographica Sinica, 2020, 40 (3): 354- 363.
|
| [8] |
Long Fenjie, Zheng Longfei, Song Zhida. High-speed rail and urban expansion: An empirical study using a time series of nighttime light satellite data in China[J]. Journal of Transport Geography, 2018, 72 (10): 106- 118.
|
| [9] |
Yang Xiaolan. The reconfiguration effect of China’s high-speed railway on intercity connection ——A study based on media attention index[J]. Transport Policy, 2020, 95 (1): 47- 56.
|
| [10] |
王姣娥, 焦敬娟, 金凤君. 高速铁路对中国城市空间相互作用强度的影响[J]. 地理学报, 2014, 69 (12): 1833- 1846.
Wang Jiao’e, Jiao Jingjuan, Jin Fengjun. Spatial effects of high-speed rails on interurban economic linkages in China[J]. Acta Geographica Sinica, 2014, 69 (12): 1833- 1846.
|
| [11] |
李阿萌, 肖翔. 高速铁路对长三角地区城市经济联系格局的影响[J]. 现代城市研究, 2014, (9): 110- 116.
Li Ameng, Xiao Xiang. The influence of high-speed railways on urban economical relation in the Yangtze River Delta[J]. Modern Urban Research, 2014, (9): 110- 116.
|
| [12] |
Liu Shuli, Wan Yulai, Zhang Anming. Does China’s high-speed rail development lead to regional disparities? A network perspective[J]. Transportation Research Part A, 2020, 138 (3): 299- 321.
|
| [13] |
Wang Feng, Wei Xianjin, Liu Juan. Impact of high-speed rail on population mobility and urbanisation: A case study on Yangtze River Delta urban agglomeration, China[J]. Transportation Research Part A, 2019, 127 (9): 99- 114.
|
| [14] |
Dong Xiaofang. High-speed railway and urban sectoral employment in China[J]. Transportation Research Part A, 2018, 116 (10): 603- 621.
|
| [15] |
Shi Wenming, Lin Kun Chin, Heather M. Spatial distribution of job opportunities in China: Evidence from the opening of the high-speed rail[J]. Transportation Research Part A, 2020, 133 (3): 138- 147.
|
| [16] |
国家统计局. 中国城市统计年鉴[M]. 北京: 中国统计出版社, 2010—2019.
National Bureau of Statistics. China urban statistical yearbook. Beijing: China Statistics Press, 2019.
|
/
| 〈 |
|
〉 |