
Spatial Agglomeration of Design Creative Talents and Its Driving Factors: Based on the Perspective of Urban Amenities
Received date: 2020-06-16
Revised date: 2020-12-24
Online published: 2021-11-17
Supported by
National Natural Science Foundation of China(42171214)
Major Program of Hangzhou Soft Science(20200834M22)
Copyright
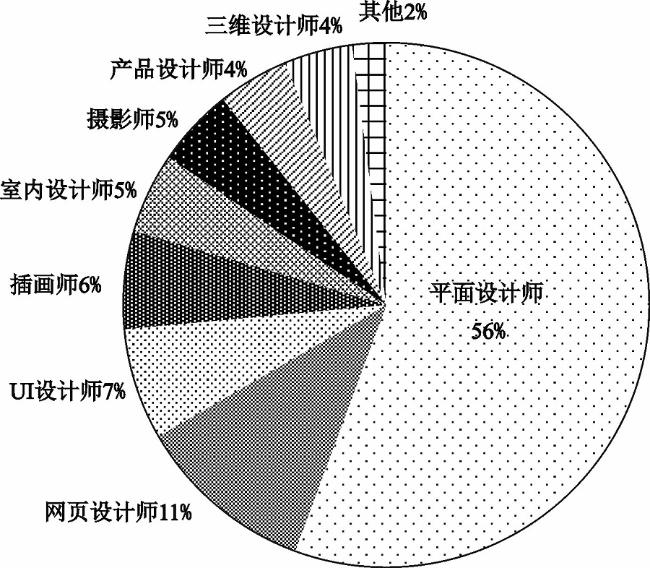
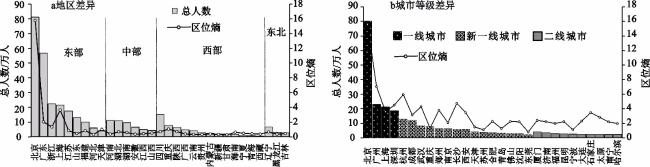
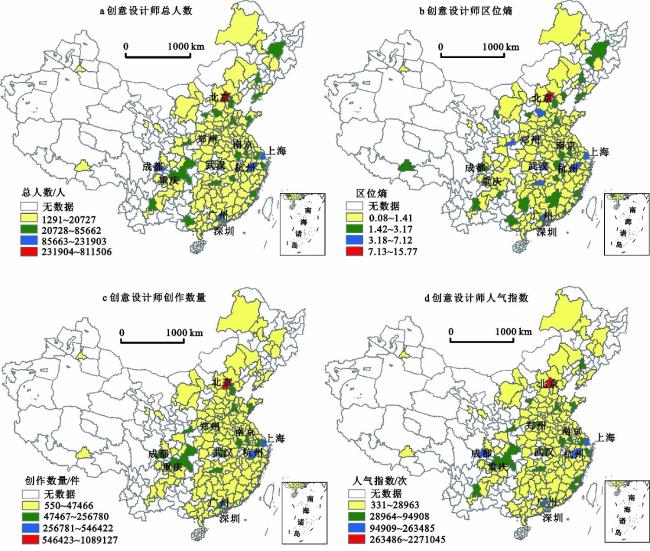
Creative talents are the new dynamics to urban and regional economic development. However, limited attention was paid to the spatial agglomeration mechanism and driving factors of creative talents. Based on the theory of urban amenities, the paper establishes an index system of urban amenities to the spatial agglomeration of creative talents in design sectors in China. An extensive dataset with over 3 million designers registered in the online platform zcool.com was adopted as the sample for this study. It aims to examine the spatiality of China’s creative talents and its association with urban amenities for cultural production. Using the quantitative methods such as location quotient, geographic concentration index, and the negative binomial regression method, we investigate the characteristics and mechanism of the spatial concentration of Chinese creative designers. The results suggest that: First, the distribution of creative designers shows a significant spatial agglomeration. First-tier cities like Beijing are the most dominated, but emerging cities such as Hangzhou, Changsha, Wuhan, and Zhengzhou are also well-performed, even better than some first-tier cities. Second, amenity-based approach has a strong explanatory power in explaining the agglomeration of Chinese design creative talents. The cultural environment, educational environment, and natural environment are the core factors that affect the agglomeration of design creative talents. Third, this study echoes with some conclusions of the creative class theory. Cultural infrastructures, cultural heritages, cultural tourism, high-quality human capital, warm climate, and good air quality were essential to enhance the city’s attractiveness to creative talents. Simultaneously, it is found that scientific research investment has a significant crowding-out effect on the accumulation of creative talents. The amenity factors of the living environment that were emphasized by Western scholars have a limited impact on agglomeration of creative talents. In conclusion, this research adopted a more inclusive urban amenity theory, and proved that urban amenities matter in the process of concertation of creative designers. It also provides a reference for local governments to promote their brain gain policy for creative talents.
Key words: creative talent; creative industry; agglomeration; urban amenities; designers
He Jinliao , Peng Jue , Hu Hao . Spatial Agglomeration of Design Creative Talents and Its Driving Factors: Based on the Perspective of Urban Amenities[J]. SCIENTIA GEOGRAPHICA SINICA, 2021 , 41(9) : 1525 -1535 . DOI: 10.13249/j.cnki.sgs.2021.09.004
表1 设计师城市舒适性指标体系Table 1 Urban amenity index for designers |
| 一级指标 | 二级指标 | 描述 |
| 注:*因为北半球平均气温一月份最低,代表该地区的寒冷程度,该指标在舒适性研究中被普遍采纳[18,28,29]。 | ||
| 自然环境舒适性 | 一月平均气温* | 一月平均气温/℃ |
| 空气质量 | 年PM2.5平均浓度/(μg/m3) | |
| 日照时长 | 全年日照时长/h | |
| 教育环境舒适性 | 大学生数量 | 每万人常住人口中在校大学生数量/人 |
| 受教育程度 | 每万人常住人口中拥有大专及以上学历的人口/人 | |
| 研发投入 | 单位GDP研发投入/元 | |
| 创业环境舒适性 | 商标注册 | 单位GDP商标注册个数/(个/亿元) |
| 上市公司 | 国泰安数据库上市公司数量/个 | |
| 创意产业园区 | 创意产业园区数量/个 | |
| 文化环境舒适性 | 文化遗产 | 全国重点文物保护单位数量/个 |
| 文化基础设施 | 展览馆数量/个 | |
| 文化旅游 | 入境旅游人数占常住人口比重/% | |
| 生活环境舒适性 | 平均房价 | 城市平均房价/(元/m3) |
| 交通便利性 | 人均公共交通客运次数/次 | |
| 人均可支配收入 | 城镇居民人均可支配收入/元 | |
表2 中国设计师集聚负二项回归分析结果Table 2 Negative binomial regression results of creative designers |
| 解释变量 | 模型1(总人数) | 模型2(区位熵) | |||
| 标准化系数 | 标准误 | 标准化系数 | 标准误 | ||
| 注:*、**、***分别表示在10%、5%、1%的置信水平下通过显著性检验。 | |||||
| 一月平均气温 | 0.1799*** | 0.0603 | 0.0958** | 0.0392 | |
| 空气污染 | 0.2893 | 0.0449 | -0.0511* | 0.0305 | |
| 日照时长 | 0.0353 | 0.0531 | 0.0130 | 0.0316 | |
| 大学生数量 | 0.4938*** | 0.0814 | 0.3475*** | 0.0442 | |
| 受教育程度 | -0.0250 | 0.0440 | 0.0004 | 0.0560 | |
| 研发投入 | -0.1014 | 0.0618 | -0.1512*** | 0.0459 | |
| 商标注册 | 0.1078* | 0.0628 | 0.1055** | 0.0451 | |
| 上市公司 | 0.0996 | 0.2004 | 0.0304 | 0.0869 | |
| 创意产业园区 | 0.2093** | 0.2081 | 0.0100 | 0.1023 | |
| 文化遗产 | 0.1245** | 0.0648 | 0.1090*** | 0.0350 | |
| 文化基础设施 | 0.4327*** | 0.2068 | 0.2378*** | 0.0827 | |
| 文化旅游 | 0.1887*** | 0.0795 | 0.1716*** | 0.0431 | |
| 平均房价 | -0.0497 | 0.0879 | -0.0142 | 0.0569 | |
| 交通便利性 | -0.0068 | 0.0785 | -0.0050 | 0.0571 | |
| 人均可支配收入 | 0.2369*** | 0.0672 | -0.0474 | 0.0429 | |
| alpha | 0.2682*** | 0.0338 | 0.1764*** | 0.0207 | |
| [1] |
Florida R L. The rise of the creative class—Revisited[M]. New York, USA: Basic Books, 2012.
|
| [2] |
驻英使馆经商处. 英国创意产业已成为新兴支柱产业 [J/OL]. 2011-04-07. http://gb.mofcom.gov.cn/article/i/201104/20110407499008.shtml.
Economic and Commercial Office of the Chinese Embassy in the UK. British creative industries have become a new pillar industry. 2011-04-07. http://gb.mofcom.gov.cn/article/i/201104/20110407499008.shtml.
|
| [3] |
国家统计局. 2018年全国文化及相关产业增加值占GDP比重为4.48% [J/OL]. 2020-01-21. http://www.stats.gov.cn/tjsj/zxfb/202001/t20200121_1724242.html.
National Bureau of Statistics. In 2018, the added value of national culture and related industries accounted for 4.48% of GDP. 2020-01-21. http://www.stats.gov.cn/tjsj/zxfb/202001/t20200121_1724242.html.
|
| [4] |
褚劲风. 上海创意产业空间集聚的影响因素分析[J]. 经济地理, 2009, 29(1): 102-107+129.
Chu Jingfeng. A study on spatial difference of the creative industrial zones in Shanghai. Economic Geography, 2009, 29(1): 102-107+129.
|
| [5] |
何金廖, 黄贤金, 司月芳. 产业集群的地方嵌入与全球生产网络链接——以上海文化创意产业园区为例[J]. 地理研究, 2018, 37(7): 1447-1459.
He Jinliao, Huang Xianjin, Si Yuefang. Local embeddedness and global production network of industrial clusters: Case study of the cultural. Geographical Research, 2018, 37(7): 1447-1459.
|
| [6] |
马仁锋. 创意产业区演化与大都市空间重构[M]. 杭州: 浙江大学出版社, 2014.
Ma Renfeng. Evolution of the creative industrial districts and spatial restructuring of the metropolitan space. Hangzhou: Zhejiang University Press, 2014.
|
| [7] |
朱华晟, 赵雪平, 吴骏毅, 等. 大学与城市创意产业空间—网络构建——以北京市规划设计业为例[J]. 经济地理, 2013, 33(3): 84-92.
Zhu Huasheng, Zhao Xueping, Wu Junyi et al. Urban creative space and network: A case study of planning & design industry in Beijing. Economic Geography, 2013, 33(3): 84-92.
|
| [8] |
Scott A J. Cultural economy and the creative field of the city[J]. Geografiska Annaler: Series B, Human Geography, 2010, 92B(2): 115-130.
|
| [9] |
林静霞, 何金廖, 黄贤金. 城市舒适性视角下科研人才流动的城市偏好研究[J]. 地域研究与开发, 2020, 39(1): 59-64+88.
Lin Jingxia, He Jinliao, Huang Xianjin. Research on the city preference of the flow of scientific research talents from the perspective of urban amenities. Areal Research and Development, 2020, 39(1): 59-64+88.
|
| [10] |
王若宇, 黄旭, 薛德升, 等. 2005~2015年中国高校科研人才的时空变化及影响因素分析[J]. 地理科学, 2019, 39(8): 1199-1207.
Wang Ruoyu, Huang Xu, Xue Desheng et al. Spatio-temporal change of facaulty members of higher education institute and its influential factors in China in 2005-2015. Scientia Geographica Sinica, 2019, 39(8): 1199-1207.
|
| [11] |
侯纯光, 杜德斌, 刘承良, 等. 全球人才流动网络复杂性的时空演化——基于全球高校留学生流动数据[J]. 地理研究, 2019, 38(8): 1862-1876.
Hou Chunguang, Du Debin, Liu Chengliang et al. Spatiotemporal evolution of global talent mobility network based on the data of international student mobility. Geographical Research, 2019, 38(8): 1862-1876.
|
| [12] |
李涛, 曹小曙, 黄晓燕. 珠江三角洲交通通达性空间格局与人口变化关系[J]. 地理研究, 2012, 31(9): 1661-1672.
Li Tao, Cao Xiaoshu, Huang Xiaoyan. The relationship between spatial structure of accessiblity and population change in Pearl River Delta. Geographical Research, 2012, 31(9): 1661-1672.
|
| [13] |
曹琳剑, 王杰, 王欢欢, 等. 京津冀基础设施建设与人口集聚耦合演进分析——基于推拉理论解析[J]. 地理科学, 2019, 39(8): 1256-1264.
Cao Linjian, Wang Jie, Wang Huanhuan et al. Evolutional analysis of coupling between infrastructure and population agglomeration in Beijing-Tianjin-Hebei Region: An analysis based on push-pull theory. Scientia Geographica Sinica, 2019, 39(8): 1256-1264.
|
| [14] |
温婷, 蔡建明, 杨振山, 等. 国外城市舒适性研究综述与启示[J]. 地理科学进展, 2014, 33(2): 249-258.
Wen Ting, Cai Jianming, Yang Zhenshan et al. Review and enlightenment of overseas urban amenity research. Progress in Geography, 2014, 33(2): 249-258.
|
| [15] |
温婷, 林静, 蔡建明, 等. 城市舒适性: 中国城市竞争力评估的新视角及实证研判[J]. 地理研究, 2016, 35(2): 214-226.
Wen Ting, Lin Jing, Cai Jianming et al. Urban amenity: A new perspective and empirical testimony on China’s city competitiveness assessment. Geographical Research, 2016, 35(2): 214-226.
|
| [16] |
Ullman E L. Amenities as a factor in regional growth[J]. Geographical Review, 1954, 44(1): 119-132.
|
| [17] |
Glaeser E L, Edward L. Glaeser, Review of Richard Florida’s The Rise of the Creative Class[J]. Regional Science and Urban Economics, 2005, 35(5): 593-596.
|
| [18] |
Clark T N, Lloyd R, Wong K K et al. Amenities drive urban growth[J]. Journal of Urban Affairs, 2002, 24(5): 493-515.
|
| [19] |
何金廖, 曾刚. 城市舒适性驱动下的创意产业集聚动力机制——以南京品牌设计产业为例[J]. 经济地理, 2019, 39(3): 134-142+161.
He Jinliao, Zeng Gang. Dynamic mechanism of creative industry agglomeration under the driving of urban amenities: A case study of brand design industry in Nanjing. Economic Geography, 2019, 39(3): 134-142+161.
|
| [20] |
马凌, 李丽梅, 朱竑. 中国城市舒适物评价指标体系构建与实证[J]. 地理学报, 2018, 73(4): 755-770.
Ma Ling, Li Limei, Zhu Hong. The construction of urban amenities index in China: An empirical research based on a statistical anal. Acta Geographica Sinica, 2018, 73(4): 755-770.
|
| [21] |
Florida R, Mellander C. Talent, skills, and urban economies[M]//Dariusz Wójcik. The new Oxford handbook of economic geography. Oxford: Oxford University Press, 2018.
|
| [22] |
齐宏纲, 戚伟, 刘盛和. 粤港澳大湾区人才集聚的演化格局及影响因素[J]. 地理研究, 2020, 39(9): 2000-2014.
Qi Honggang, Qi Wei, Liu Shenghe. Talents concentration in the Guangdong-Hong Kong-Macao Greater Bay Area, China: Evolution pattern and driving factors. Geographical Research, 2020, 39(9): 2000-2014.
|
| [23] |
He J, Huang X. Agglomeration, differentiation and creative milieus: A socioeconomic analysis of location behaviour of creative enterprises in Shanghai[J]. Urban Policy and Research, 2018, 36(1): 79-96.
|
| [24] |
Markusen A. Urban development and the politics of a creative class: Evidence from a study of artists[J]. Environment and Planning A, 2006, 38(10): 1921-1940.
|
| [25] |
周亮, 张亚. 中国顶尖学术型人才空间分布特征及其流动趋势——以中国科学院院士为例[J]. 地理研究, 2019, 38(7): 1749-1763.
Zhou Liang, Zhang Ya. The spatial distribution and flow trends of Chinese top academic talents: Based on the case study of academicians of Chinese Academy of Sciences. Geographical Research, 2019, 38(7): 1749-1763.
|
| [26] |
罗守贵, 王爱民, 高汝熹. 高级人才空间流动因素分析及建立反区域筛选机制的意义[J]. 地理科学, 2009, 29(6): 779-786.
Luo Shougui, Wang Aimin, Gao Ruxi. Analyses of factors of high-level talents’ migration and significance of establishing anti-selection mechanisms among regions. Scientia Geographica Sinica, 2009, 29(6): 779-786.
|
| [27] |
朱华晟著;吴殿廷主编. 创意城市中的创意人群及其流动性[M]//大城市创意产业空间与网络结构: 基于北京和上海的实证研究. 南京: 东南大学出版社, 2015: 168-197.
Zhu Huasheng, Wu Dianting. Creative people and their mobility in Creative Cities. Spatial and network structure of creative industries in big cities: An empirical study based on Beijing and Shanghai. Nanjing: Southeast University Press, 2015: 168-197.
|
| [28] |
Wenting R, Atzema O, Frenken K. Urban amenities and agglomeration economies? The locational behaviour and economic success of Dutch fashion design entrepreneurs[J]. Urban Studies, 2011, 48(7): 1333-1352.
|
| [29] |
Gottlieb P D. Amenities as an economic development tool: Is there enough evidence?[J]. Economic Development Quarterly, 1994, 8(3): 270-285.
|
| [30] |
Lee S Y, Florida R L, Acs Z. Creativity and entrepreneurship: A regional analysis of new firm formation[J]. Regional Studies, 2004, 38(8): 879-891.
|
| [31] |
Brueckner J K, Thisse J-F, Zenou Y. Why is central Paris rich and downtown Detroit poor? An amenity-based theory[J]. European Economic Review, 1999, 43(1): 91-107.
|
| [32] |
方远平, 陆莲芯, 毕斗斗, 等. 珠江三角洲港资服务业企业的空间格局及影响因素研究[J]. 地理科学, 2020, 40(9): 1421-1428.
Fang Yuanping, Lu Lianxin, Bi Doudou et al. The distribution and influencing factors of Hong Kong-funded service companies in the Pearl River Delta. Scientia Geographica Sinica, 2020, 40(9): 1421-1428.
|
| [33] |
徐维祥, 张凌燕, 刘程军, 等. 城市功能与区域创新耦合协调的空间联系研究——以长江经济带 107 个城市为实证[J]. 地理科学, 2017, 37(11): 1659-1667.
Xu Weixiang, Zhang Lingyan, Liu Chengjun et al. The coupling coordination of urban function and regional innovation: A case study of 107 cities in the Yangtze River Economic Belt. Scientia Geographica Sinica, 2017, 37(11): 1659-1667.
|
| [34] |
国家统计局. 东西中部和东北地区划分方法 [J/OL]. 2011-06-13. http://www.stats.gov.cn/ztjc/zthd/sjtjr/dejtjkfr/tjkp/201106/t20110613_71947.htm.
National Bureau of Statistics. Method of dividing east, west, central and northeast regions. 2011-06-13. http://www.stats.gov.cn/ztjc/zthd/sjtjr/dejtjkfr/tjkp/201106/t20110613_71947.htm.
|
| [35] |
第一财经. 2019新一线城市官方名单出炉: 你的城市排第几?(附337个城市排名) [J/OL]. 2019-05-24. https://www.yicai.com/news/100200192.html.
YICAI. The official list of new first-tier cities in 2019 is released: What is your city? (Attach a ranking of 337 cities). 2019-05-24. https://www.yicai.com/news/100200192.html.
|
| [36] |
张苏秋, 周锦. 中国区域创意指数的测度与评价[J]. 统计与决策, 2017(20): 44-48.
Zhang Suqiu, Zhou Jin. Measurement and evaluation of China’s Regional Innovation Index. Statistic & Decision, 2017(20): 44-48.
|
| [37] |
崔舸, 林宪生. 文化创意产业视角下我国物质文化遗产发展模式探究——以北京故宫为例[J]. 经济研究导刊, 2018(9): 39-41.
Cui Ge, Lin Xiansheng. Research on the development model of Chinese material heritage from the perspective of cultural and creative industries. Economic Research Guide, 2018(9): 39-41.
|
| [38] |
Clarke S E, Gaile G L. The work of cities[M]. Minneapolis: University of Minnesota Press, 1998.
|
| [39] |
Howkins J. The creative economy: How people make money from ideas[M]. London: Penguin Global, 2002.
|
| [40] |
彭珏, 何金廖. 电商粉丝经济的地理格局及其影响因子探析——以抖音直播带货主播为例[J]. 地理科学进展, 2021, 40(7): 1098-1112.
Peng Jue, He Jinliao. Spatial differentiation and influencing factors of fan economy in China: Taking TikTok livestreaming commerce host as an example. Progress in Geography, 2021, 40(7): 1098-1112.
|
/
| 〈 |
|
〉 |