
The Dynamic Change of Global Rare Earth Trade Network and Its Impact Mechanism: From the Perspective of Industrial Chain
Received date: 2022-01-04
Revised date: 2022-06-10
Accepted date: 2022-08-22
Online published: 2022-11-20
Copyright
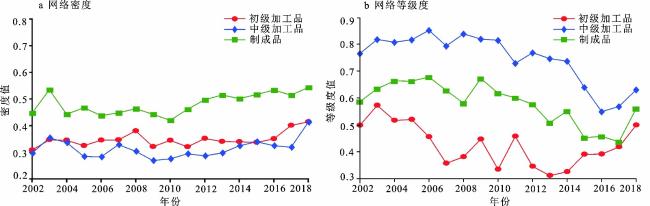
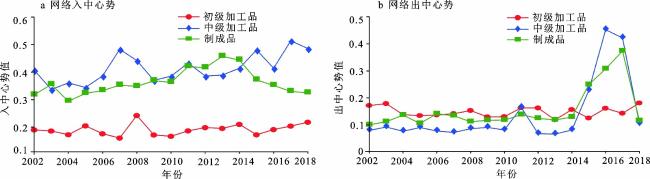
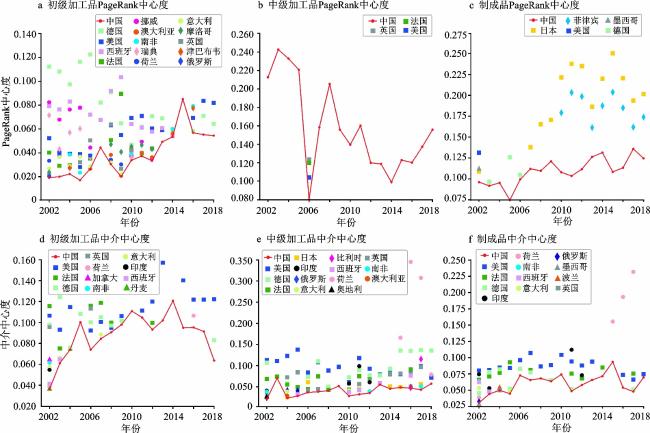
From the perspective of rare earth industrial chain, this article successively constructed the rare earth primary processed products, intermediate processed products and finished products trade network according to the trade dependence, and empirical test on the dynamic change of rare earth trade network structure and its influencing mechanism by using social network analysis method and Temporal Exponential Random Graph Model. The following conclusions are drawn. The three types of rare earth trade network are evolving into a complex network, and the trend of the intermediate processed products goods network ahead of the finished products and primary processed goods network in turn. From the perspective of backbone structure, three types of rare earth trade network have evolved from Europe to Europe and the United States, from China to Europe and the United States, and from Europe, the United States and Asia to Asia. China evolves into the top three countries with direct influence in all networks, but its leading edge has gradually narrowed, while its indirect influence has only entered the top three countries in the network of primary processed products and finished products, with a small increase. Mutual, triangle, star-radiation and star-expansion structure effects have significant heterogeneous effects on the dynamic evolution of the three types of rare earth trade network.
Zhuang Delin , Li Jiahao , Chen Ziruo , Liu Yuchen . The Dynamic Change of Global Rare Earth Trade Network and Its Impact Mechanism: From the Perspective of Industrial Chain[J]. SCIENTIA GEOGRAPHICA SINICA, 2022 , 42(11) : 1900 -1911 . DOI: 10.13249/j.cnki.sgs.2022.11.005
表1 2002年和2018年3个环节稀土贸易主干网络核心链条Table 1 Core chain of three types of rare earth trade top1 networks in 2002 and 2018 |
| 稀土产业链 | 年份 | 主要子群(节点占比) | 核心链条构成 |
| 注: “A←B”表示 B 国依赖于 A 国;“←→”表示节点之间存在直接依赖关系;中国数据未包含中国港澳台数据。 | |||
| 初级加工品 | 2002 | 欧洲子群(89%) | 挪威←德国←西班牙←法国←摩洛哥 ←美国←澳大利亚←中国 |
| 2018 | 欧洲子群(47%) 亚太子群(38%) | 西班牙←德国←意大利←西班牙 美国←澳大利亚←中国←阿联酋←印度 | |
| 中级加工品 | 2002 | 亚欧美子群(93%) | 中国←奥地利←德国,中国←法国←英国 中国←→日本←美国 |
| 2018 | 亚欧美子群(74%) 日本子群(15%) 英国子群(7%) | 德国←澳大利亚←马来西亚←中国←美国 越南←→日本←印度←西班牙 英国←→意大利 | |
| 制成品 | 2002 | 亚洲子群(26%) 美洲子群(21%) 欧洲子群(44%) | 日本←中国 墨西哥←→美国 英国←德国 |
| 2018 | 亚欧美共同体(100%) | 日本←中国←美国,日本←中国←德国 日本←中国←荷兰,日本←泰国←法国 | |
表2 TERGM的回归结果Table 2 Regression results of the TERGM |
| 变量名称 | 模型1 | 模型2 | 模型3 | 模型4 | 模型5 | 模型6 |
| 注:括号内为稳健性标准差;***、**和*分别表示在 1%,5% 和 10% 的显著性水平上显著;edges为常数项;mutual为互惠结构变量;gwideg为几何加权入度分布;gwodeg为几何加权出度分布;gwesp为三角形结构变量;stability为稳定性;variability为变异性;import(export)、gdp_sender(receiver)和gdp_per_sender(receiver)表示节点国家的稀土对应产品进(出)口额、国内生产总值(GDP)和人均生产总值(人均GDP)对其发出(接收)依赖关系的影响效应变量;colony_mat为历史殖民;contig_mat为地理相邻;dist_mat为地理距离;language_mat为语言;bit_mat为双边投资协定;空白项表示该变量未纳入模型。 | ||||||
| edges | −13.639*** (0.1784) | −21.0627*** (0.5332) | −16.4082*** (0.3184) | −8.9069*** (0.188) | −14.6377*** (0.3808) | −10.4578*** (0.3337) |
| mutual | 0.9821*** (0.0324) | 0.1614*** (0.0451) | 0.644*** (0.0407) | 0.5547*** (0.0418) | −0.0869** (0.059) | 0.3681*** (0.0357) |
| gwideg | 1.1957*** (0.0972) | 0.4278** (0.1734) | 0.4663*** (0.1064) | |||
| gwodeg | −0.4415** (0.1839) | −0.134** (0.1616) | −2.0273*** (0.2061) | |||
| gwesp | 0.2369*** (0.0161) | 0.1501*** (0.0264) | 0.3215*** (0.0189) | |||
| stability | 1.8776*** (0.0167) | 1.6335*** (0.0268) | 1.4864*** (0.0139) | |||
| variability | −0.0039** (0.0054) | −0.0236 (0.0078) | −0.0107 (0.0033) | |||
| lnimport | 0.2244*** (0.004) | 0.1915*** (0.007) | 0.1697*** (0.0033) | 0.176*** (0.0065) | 0.1564*** (0.0094) | 0.0778*** (0.0046) |
| lngdp_sender | 0.0004** (0.0037) | 0.0489*** (0.0094) | −0.014 (0.0043) | −0.0152 (0.006) | 0.0215 (0.0082) | −0.0043** (0.0044) |
| lngdp_per_sender | 0.0432*** (0.0124) | −0.0292** (0.0211) | 0.0633*** (0.0086) | 0.0398*** (0.0097) | −0.0197** (0.0218) | 0.0545*** (0.0094) |
| lnexport | 0.1694*** (0.0043) | 0.1658*** (0.0094) | 0.1643*** (0.0049) | 0.1736*** (0.0057) | 0.1596*** (0.0089) | 0.1544*** (0.0082) |
| lngdp_receiver | 0.1766*** (0.0069) | 0.3841*** (0.0137) | 0.2778*** (0.0133) | 0.0829*** (0.0078) | 0.2508*** (0.014) | 0.1487*** (0.0155) |
| lngdp_per_receiver | 0.0141** (0.0066) | 0.2634*** (0.0158) | 0.1979*** (0.0126) | −0.0144** (0.0114) | 0.1892*** (0.015) | 0.1276*** (0.0128) |
| colony_mat | 0.7799*** (0.0559) | 0.382*** (0.0337) | 0.7739*** (0.0236) | 0.4976*** (0.0631) | 0.1917 (0.0595) | 0.5284*** (0.0439) |
| contig_mat | 2.2624*** (0.0284) | 1.9769*** (0.0399) | 2.0688*** (0.0303) | 1.3839*** (0.0722) | 1.477*** (0.0719) | 1.4098*** (0.0452) |
| dist_mat | −0.3888*** (0.0556) | −0.6372*** (0.0803) | −0.4545*** (0.0618) | −0.3632*** (0.066) | −0.5471*** (0.0698) | −0.3594*** (0.0629) |
| language_mat | 0.9783*** (0.032) | 0.8824*** (0.071) | 0.9612*** (0.0244) | 0.7792*** (0.0412) | 0.7625*** (0.0706) | 0.7545*** (0.0319) |
| bit_mat | 0.3401*** (0.0211) | 0.2021*** (0.0218) | 0.3933*** (0.0247) | 0.2424*** (0.0279) | 0.2114*** (0.0276) | 0.2771*** (0.0333) |
| [1] |
汤铎铎, 刘学良, 倪红福, 等. 全球经济大变局、中国潜在增长率与后疫情时期高质量发展[J]. 经济研究, 2020, 55(8): 4-23
Tang Duoduo, Liu Xueliang, Ni Hongfu et al. The Changing global economic landscape and China’s potential growth rate and high-quality development in the post-epidemic era. Economic Research Journal, 2020, 55(8): 4-23
|
| [2] |
裴长洪, 刘洪愧. 中国外贸高质量发展: 基于习近平百年大变局重要论断的思考[J]. 经济研究, 2020, 55(5): 4-20
Pei Changhong, Liu Honghuai. The high-quality development of Chinese foreign trade enlightened by Xi Jinping’s important judgment on the profound Changes in a century. Economic Research Journal, 2020, 55(5): 4-20
|
| [3] |
李鹏飞, 杨丹辉, 渠慎宁, 等. 稀有矿产资源的全球供应风险分析——基于战略性新兴产业发展的视角[J]. 世界经济研究, 2015, 34(2): 96-104
Li Pengfei, Yang Danhui, Qu Shenning et al. Analysis on global supply risk of rare minerals: From the perspective of strategic emerging industry development. World Economy Studies, 2015, 34(2): 96-104
|
| [4] |
袁中许. 资源异质性视角下中国稀土定价权缺失本真研究[J]. 中国人口·资源与环境, 2019, 29(4): 157-167
Yuan Zhongxu. Authenticity study on the lack of pricing power in China’s rare earth from the perspective of resource heterogeneity China. Population, Resources and Environment, 2019, 29(4): 157-167
|
| [5] |
平新乔, 安然. 我国稀土出口总量与结构变化: 1999-2014年[J]. 改革, 2016, 32(3): 94-101
Ping Xinqiao, An Ran. The total export volume and structural changes of China’s rare earth export: 1999-2014. Reform, 2016, 32(3): 94-101
|
| [6] |
高风平, 张璞, 刘大成, 等. 国际稀土市场新格局与中国稀土产业战略选择[J]. 国际贸易问题, 2019, 45(7): 63-81
Gao Fengping, Zhang Pu, Liu Dacheng et al. The rare earths global market updates and the rare earths industry master plan of the United States and its allies. Journal of International Trade, 2019, 45(7): 63-81
|
| [7] |
Hou W, Liu H, Wang H et al. Structure and patterns of the international rare earths trade: A complex network analysis[J]. Resources Policy, 2018, 55: 133-142
|
| [8] |
Wang X, Yao M, Li J et al. Global embodied rare earths flows and the outflow paths of China’s embodied rare earths: Combining multi-regional input-output analysis with the complex network approach[J]. Journal of Cleaner Production, 2019, 216: 435-445
|
| [9] |
夏启繁, 杜德斌, 段德忠, 等. 中国稀土对外贸易格局演化及影响因素[J]. 地理学报, 2022, 77(4): 976-995
Xia Qifan, Du Debin, Duan Dezhong et al. Evolution and influencing factors of China’s foreign trade in rare earth metals. Acta Geographica Sinica, 2022, 77(4): 976-995
|
| [10] |
Kharrazi A, Fath B D. Measuring global oil trade dependencies: An application of the point-wise mutual information method[J]. Energy Policy, 2016, 86(1): 271-277
|
| [11] |
An Q, Wang L, Qu D et al. Dependency network of international oil trade before and after oil price drop[J]. Energy, 2018, 165: 1021-1033
|
| [12] |
Huang J B, Qian D, Ying W et al. The evolution and influencing factors of international tungsten competition from the industrial chain perspective[J]. Resources Policy, 2021, 73: 1-12
|
| [13] |
Li B H, Li H J, Dong Z L et al. The global copper material trade network and risk evaluation: A industry chain perspective[J]. Resources Policy, 2021, 74: 102275
|
| [14] |
Yang P, Gao X Y, Zhao Y R et al. Lithium resource allocation optimization of the lithium trading network based on material flow[J]. Resources Policy, 2021, 74: 102356
|
| [15] |
Li Q, Zhong W, Wang G et al. Material and value flows of iron in Chinese international trade from 2010 to 2016[J]. Resources Policy, 2018, 59: 139-147
|
| [16] |
Xin S, Han H, Zhao F et al. Tracing global lithium flow: A trade-linked material flow analysis[J]. Resources Conservation and Recycling, 2017, 124: 50-61
|
| [17] |
计启迪, 刘卫东, 陈伟, 等. 基于产业链的全球铜贸易网络结构研究[J]. 地理科学, 2021, 41(1): 44-54
Ji Qidi, Liu Weidong, Chen Wei et al. Structure of global copper-containing products trade network based on industrial chain perspective. Scientia Geographica Sinica, 2021, 41(1): 44-54
|
| [18] |
Shuai J, Peng X, Zhao Y et al. A dynamic evaluation on the international competitiveness of China’s rare earth products: An industrial chain and tech-innovation perspective[J]. Resources Policy, 2022, 75: 1-15
|
| [19] |
刘林青, 闫小斐, 杨理斯, 等. 国际贸易依赖网络的演变及内生机制研究[J]. 中国工业经济, 2021, 38(2): 98-116
Liu Linqing, Yan Xiaofei, Yang Lisi et al. Research on the evolution and endogenous mechanism of international trade dependence network. China Industrial Economics, 2021, 38(2): 98-116
|
| [20] |
Lusher D, Koskinen J, Robins G. Exponential random graph models for social networks: Theory, methods and applications[M]. Cambridge: Cambridge University Press, 2013.
|
| [21] |
许和连, 孙天阳, 成丽红. “一带一路”高端制造业贸易格局及影响因素研究——基于复杂网络的指数随机图分析[J]. 财贸经济, 2015, 36(12): 74-88
Xu Helian, Sun Tianyang, Cheng Lihong. Trade pattern and influence factors of high-end manufacturing on “One Belt and One Road”: A study based on the exponential random graph models. Finance & Trade Economics, 2015, 36(12): 74-88
|
| [22] |
何欢浪, 冯美珍. 我国稀土产品出口政策效果评估的实证检验[J]. 世界经济研究, 2017, 36(11): 88-99
He Huanlang, Feng Meizhen. An empirical study of the evaluation for China’s rare earth exporting. World Economy Studies, 2017, 36(11): 88-99
|
| [23] |
庄德林, 王鹏鹏, 许基兰, 等. 中国创业投资城市网络空间结构演变研究——基于四大投资阶段的分析视角[J]. 地理科学, 2020, 40(8): 1256-1265
Zhuang Delin, Wang Pengpeng, Xu Jilan et al. Spatial structure evolution of China’s venture capital city network: Based on the analysis perspective of four investment stages. Scientia Geographica Sinica, 2020, 40(8): 1256-1265
|
| [24] |
刘劲松. 基于社会网络分析的世界天然气贸易格局演化[J]. 经济地理, 2016, 36(12): 89-95
Liu Jinsong. Evolution of world natural gas trade pattern based on social network analysis. Economic Geography, 2016, 36(12): 89-95
|
| [25] |
余娟娟, 龚同. 全球碳转移网络的解构与影响因素分析[J]中国人口·资源与环境, 2020, 30(8): 21-30.
Yu Juanjuan, Gong Tong. Analyzing the deconstruction and influencing factors of the global carbon transfer network. China Population, Resources and Environment, 2020, 30(8): 21-30.
|
| [26] |
唐晓彬, 崔茂生. “一带一路”货物贸易网络结构动态变化及其影响机制[J]. 财经研究, 2020, 46(7): 138-153
Tang Xiaobin, Cui Maosheng. Research on the dynamic change of goods trade network structure and its impact mechanism of countries along the Belt and Road. Journal of Finance and Economics, 2020, 46(7): 138-153
|
| [27] |
杨文龙, 杜德斌, 马亚华, 等. “一带一路”沿线国家贸易网络空间结构与邻近性[J]. 地理研究, 2018, 37(11): 2218-2235
Yang Wenlong, Du Debin, Ma Yahua et al. Network structure and proximity of the trade network in the Belt and Road region. Geographical Research, 2018, 37(11): 2218-2235
|
/
| 〈 |
|
〉 |