
Spatio-temporal evolution and growth effects of technological correlation network in the Yangtze River Delta
Received date: 2025-07-23
Revised date: 2025-09-11
Online published: 2025-11-10
Supported by
National Natural Science Foundation of China(42171420)
National Social Science Foundation of China(23&ZD068)
Soft Science Foundation of Shanghai(24692115600)
Copyright
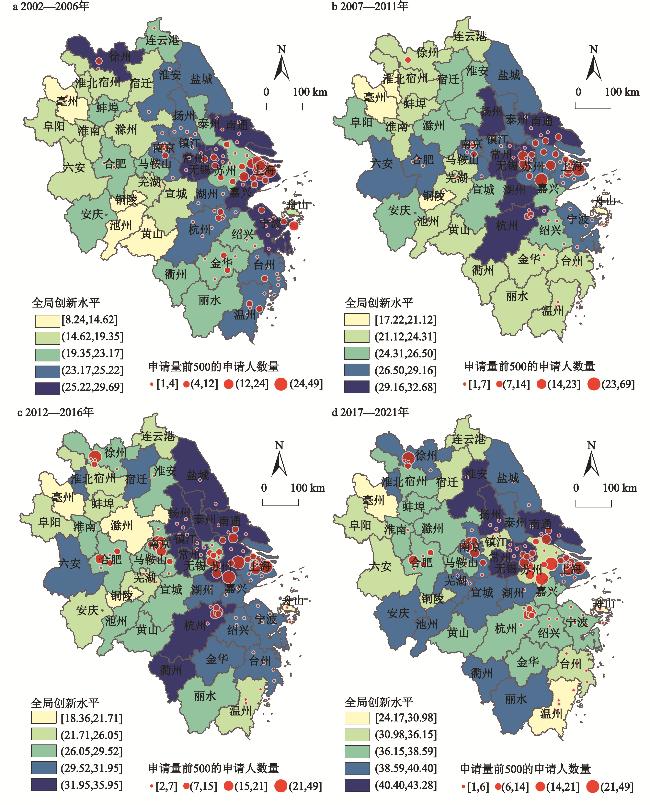
In the era of the knowledge economy, endogenous technological relatedness has increasingly evolved into networked configurations, profoundly reshaping the micro-level transmission mechanisms and output pathways of regional innovation. The spatiotemporal complexity and growth effects of these networks have attracted growing scholarly attention. Drawing on technological correlation theory, this study examines the spatiotemporal evolution and growth effects of the technological correlation network in the Yangtze River Delta (YRD) from 2002 to 2021. Results show that the network has expanded steadily, with deepening technological integration and a marked concentration of globally connected technologies along the Shanghai-Nanjing-Hefei-Hangzhou-Ningbo corridor. Its structural backbone has shifted from single-core dominance to multi-core concurrency, where star-shaped, chain-like, and tree-like patterns coexist, and the rise of hub and backbone technologies has become a key driver of urban innovation. The network also demonstrates strong modularity: the number of communities remains stable, yet their scales diverge and compositions diversify, with core technologies rooted both in origin hubs such as Shanghai, Nanjing, and Hangzhou and in application markets including Changzhou, Nantong, and Huzhou. While the knowledge base of individual technological clusters shows increasing diversification, cities with concentrated innovation resources—such as Nantong, Yancheng, and Jinhua—tend to prioritize specific domains. Patterns of urban network evolution can be categorized as comprehensive innovation, horizontal expansion, vertical specialization, or balanced low-level growth, broadly aligned with economic and administrative hierarchies. Growth effects are heterogeneous: aggregation and chain-like structures yield rising marginal benefits, while modular and global features follow an inverted U-shaped trajectory. These dynamics are further moderated by the scale of universities, enterprises, and individuals, as well as by the broader policy environment.
Lu Zhaopeng , Zhang Hong , Fan Fei . Spatio-temporal evolution and growth effects of technological correlation network in the Yangtze River Delta[J]. GEOGRAPHICAL SCIENCE, 2025 , 45(12) : 2600 -2612 . DOI: 10.13249/j.cnki.sgs.20250928
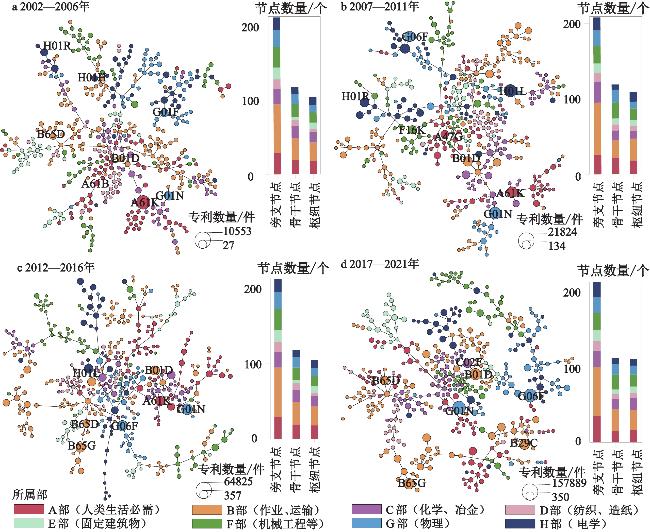
图2 2002—2021年长三角地区技术关联网络骨干结构的演化标注为所属门类:A47G(家用或餐桌用具);A61B(诊断;外科手术;鉴定);A61K(医用护理制剂组);B01D(物料分离技术类);B29C(塑材成形加工类);B65D(储运包装容器组);B65G(物料输储装置类);C02F(水污处理技术类);F16K(通用工程部件类);G01F(体积流量计量装置);G01N(材料性质测试类);G06F(电数字数据处理);H01H(电控保护装置组);H01R(电连接结构组);H01L(不包含在H10类中的半导体器件) Fig. 2 Technology networks backbone structure in the Yangtze River Delta from 2002 to 2021 |
表1 长三角地区技术关联网络分蘖模式及特征值Table 1 Urban branching type and characteristics of the Yangtze River Delta |
| 模式类型 | 城市 | 聚合特征 | 链式特征 | 模块特征 | 全局特征 | 模式类型 | 城市 | 聚合特征 | 链式特征 | 模块特征 | 全局特征 | |
| 综合创新型 | 南京 | 0.72 | 0.83 | 0.32 | 0.42 | 水平拓展型 | 泰州 | 0.42 | 0.30 | 0.52 | 0.54 | |
| 上海 | 0.66 | 0.87 | 0.35 | 0.57 | 宿迁 | 0.59 | 0.42 | 0.52 | 0.45 | |||
| 合肥 | 0.38 | 0.65 | 0.26 | 0.61 | 常州 | 0.57 | 0.57 | 0.50 | 0.78 | |||
| 杭州 | 0.63 | 0.75 | 0.30 | 0.56 | 宁波 | 0.39 | 0.25 | 0.31 | 0.67 | |||
| 低水平均衡型 | 徐州 | 0.21 | 0.18 | 0.37 | 0.24 | 南通 | 0.54 | 0.49 | 0.62 | 0.45 | ||
| 台州 | 0.25 | 0.21 | 0.47 | 0.33 | 嘉兴 | 0.62 | 0.42 | 0.55 | 0.61 | |||
| 温州 | 0.08 | 0.12 | 0.50 | 0.35 | 湖州 | 0.72 | 0.46 | 0.73 | 0.52 | |||
| 舟山 | 0.16 | 0.34 | 0.36 | 0.52 | 绍兴 | 0.67 | 0.40 | 0.67 | 0.58 | |||
| 金华 | 0.22 | 0.12 | 0.66 | 0.09 | 苏州 | 0.41 | 0.35 | 0.69 | 0.73 | |||
| 垂直深耕型 | 亳州 | 0.44 | 0.25 | 0.76 | 0.16 | 无锡 | 0.63 | 0.36 | 0.55 | 0.54 | ||
| 丽水 | 0.50 | 0.28 | 0.78 | 0.17 | 芜湖 | 0.42 | 0.39 | 0.55 | 0.74 | |||
| 连云港 | 0.62 | 0.52 | 0.61 | 0.26 | 淮南 | 0.39 | 0.35 | 0.24 | 0.62 | |||
| 阜阳 | 0.58 | 0.37 | 0.80 | 0.16 | 马鞍山 | 0.53 | 0.38 | 0.48 | 0.60 | |||
| 淮安 | 0.42 | 0.44 | 0.55 | 0.36 | 淮北 | 0.46 | 0.37 | 0.42 | 0.51 | |||
| 蚌埠 | 0.45 | 0.38 | 0.55 | 0.30 | 铜陵 | 0.60 | 0.29 | 0.56 | 0.79 | |||
| 衢州 | 0.34 | 0.33 | 0.51 | 0.26 | 安庆 | 0.57 | 0.33 | 0.70 | 0.39 | |||
| 宿州 | 0.46 | 0.33 | 0.57 | 0.21 | 黄山 | 0.67 | 0.69 | 0.48 | 0.79 | |||
| 盐城 | 0.37 | 0.44 | 0.73 | 0.40 | 滁州 | 0.61 | 0.35 | 0.65 | 0.64 | |||
| 安庆 | 0.57 | 0.33 | 0.70 | 0.39 | 池州 | 0.72 | 0.47 | 0.62 | 0.61 | |||
| 水平拓展型 | 扬州 | 0.59 | 0.46 | 0.60 | 0.53 | 宣城 | 0.82 | 0.41 | 0.75 | 0.66 | ||
| 镇江 | 0.53 | 0.49 | 0.47 | 0.69 | 六安 | 0.76 | 0.34 | 0.60 | 0.47 |
表2 城市创新特征变量Table 2 Descriptive statistics of variables |
| 变量 | 变量符号 | 变量描述 |
| 技术生长 | Gro | 技术是否形成比较优势 |
| 内生结构 | PR | 技术全局特征值 |
| CC | 技术模块特征值 | |
| BC | 技术链式特征值 | |
| HHI | 技术聚合特征值 | |
| 创新主体规模 | Stu | 普通高等学校在校人数/人 |
| Emp | 年末科技从业人数/人 | |
| Ent | 工厂和企业数/个 | |
| 创新环境 | Fin | 地区财政科技支出 |
| FDI | 外商直接投资/万美元 | |
| UE | 城镇私营单位就业人员/万人 | |
| 控制变量 | ReDen | 技术关联密度 |
| logGDP | 国内生产总值/亿元 | |
| logPop | 年末户籍人口数/万人 |
表3 模型回归结果Table 3 Results of nonlinear logistic regression analysis |
| 变量类型 | 模型(1) | 模型(2) | 模型(3) | 模型(4) | 模型(5) |
| 注:*** P<0.01,** P<0.05,所有回归均使用稳健标准误,括号内为t值;变量含义见表2;−表示该自变量不纳入模型中进行回归。 | |||||
| HHI | − ( | − | − | − | − ( |
| HHI 2 | ( | − | − | − | − |
| BC | − | − ( | − | − | − ( |
| BC 2 | − | ( | − | − | − |
| CC | − | − | ( | − | ( |
| CC 2 | − | − | − ( | − | − |
| PR | − | − | − | ( | ( |
| PR 2 | − | − | − | − ( | − |
| ReDen | ( | ( | ( | ( | ( |
| logGDP | ( | ( | ( | ( | ( |
| logPop | ( | ( | ( | ( | ( |
| Stu | ( | ( | ( | ( | ( |
| Emp | − ( | − ( | − ( | − ( | − ( |
| Ent | ( | ( | ( | ( | ( |
| Fin | − ( | − ( | − ( | − ( | − ( |
| FDI | − ( | − ( | − ( | − ( | − ( |
| UE | ( | ( | ( | ( | ( |
| 常数项 | − ( | − ( | − ( | − ( | − ( |
表4 分组模型回归结果Table 4 Nonlinear logistic regression analysis |
| 变量类型 | Stu分组 | Emp分组 | Ent分组 | Fin分组 | |||||||
| 第一组 | 第二组 | 第一组 | 第二组 | 第一组 | 第二组 | 第一组 | 第二组 | ||||
| 注:所选城市按从高到低排序,平均分为2组变量;*** P<0.01, ** P<0.05, * P<0.1,括号内为t值;变量含义见表2。 | |||||||||||
| HHI | − ( | − ( | ( | − ( | − ( | − ( | − ( | − ( | |||
| BC | − ( | − ( | − ( | − ( | − ( | − ( | − ( | − ( | |||
| CC | ( | − ( | − ( | − ( | − ( | − ( | − ( | − ( | |||
| PR | ( | ( | ( | ( | ( | ( | ( | ( | |||
| ReDen | ( | ( | − ( | ( | − ( | ( | − ( | ( | |||
| logGDP | − ( | ( | ( | ( | ( | ( | ( | ( | |||
| logPop | ( | − ( | − ( | − ( | − ( | − ( | − ( | − ( | |||
| Stu | − ( | ( | ( | − ( | − ( | − ( | ( | ( | |||
| Emp | − ( | ( | ( | ( | ( | ( | ( | ( | |||
| Ent | ( | − ( | − ( | ( | − ( | ( | − ( | − ( | |||
| Fin | − ( | ( | ( | ( | ( | ( | ( | ( | |||
| FDI | − ( | − ( | − ( | − ( | − ( | − ( | − ( | − ( | |||
| UE | ( | − ( | − ( | − ( | − ( | − ( | − ( | − ( | |||
| 常数项 | − ( | ( | ( | ( | ( | ( | ( | ( | |||
| [1] |
Kauffman S, Lobo J, Macready W G. Optimal search on a technology landscape[J]. Journal of Economic Behavior & Organization, 2000, 43(2): 141-166.
|
| [2] |
Ardito L, Natalicchio A, Petruzzelli A M. Evidence on the determinants of the likelihood and speed of technological convergence: A Knowledge search and recombination perspective in key enabling technologies[J]. IEEE Transactions on Engineering Management, 2023, 70(4): 1442-1455.
|
| [3] |
Nakamura H, Suzuki S, Sakata I et al. Knowledge combination modeling: The measurement of knowledge similarity between different technological domains[J]. Technological Forecasting and Social Change, 2015, 94: 187-201.
|
| [4] |
郭琪, 贺灿飞. 演化经济地理视角下的技术关联研究进展[J]. 地理科学进展, 2018, 37(2): 229-238.
Guo Qi, He Canfei. Progress of research on technological relatedness in the perspective of evolutionary economic geography. Progress in Geography, 2018, 37(2): 229-238.
|
| [5] |
Kalthaus M. Knowledge recombination along the technology life cycle[J]. Journal of Evolutionary Economics, 2020, 30(3): 643-704.
|
| [6] |
Zakaryan A. Organizational knowledge networks, search and exploratory invention[J]. Technovation, 2023, 122: 102680
|
| [7] |
Yayavaram S, Ahuja G. Decomposability in knowledge structures and its impact on the usefulness of inventions and knowledge-base malleability[J]. Administrative Science Quarterly, 2008, 53(2): 333-362.
|
| [8] |
Youn H, Strumsky D, Bettencourt L M A et al. Invention as a combinatorial process: Evidence from US patents[J]. Journal of the Royal Society[J], 2015, 12(106): 20150272
|
| [9] |
Park H, Magee C L. Tracing technological development trajectories: A genetic knowledge persistence-based main path approach[J]. PLoS One, 2017, 12(1): e0170895
|
| [10] |
Carnabuci G, Bruggerman J. Knowledge specialization, knowledge brokerage and the uneven growth of technology domains[J]. Social Forces, 2010, 88(2): 607-641.
|
| [11] |
Boh W F, Evaristo R, Ouderkirk A. Balancing breadth and depth of expertise for innovation: A 3M story[J]. Research Policy, 2014, 43(2): 349-366.
|
| [12] |
Marku E, Di Guardo M C, Patriotta G et al. Technology emergence as a structuring process: A complexity theory perspective on blockchain[J]. Journal of Management, 2024, 51(7): 2916-2945.
|
| [13] |
Boschma R. Towards an evolutionary perspective on regional resilience[J]. Regional Studies, 2014, 49(5): 733-751.
|
| [14] |
Rigby D L. Technological relatedness and knowledge space: Entry and exit of US cities from patent classes[J]. Regional Studies, 2013, 49(11): 1922-1937.
|
| [15] |
Frenken K, Van Oort F, Verburg T. Related variety, unrelated variety and regional economic growth[J]. Regional Studies, 2007, 41(5): 685-697.
|
| [16] |
Gloria C, McCann P, Venhorst V A. Promoting regional growth and innovation: Relatedness, revealed comparative advantage and the product space[J]. Journal of Economic Geography, 2020, 20(1): 293-316.
|
| [17] |
Boschma R, Balland P A, Kogler D F. Relatedness and technological change in cities: The rise and fall of technological knowledge in US metropolitan areas from 1981 to 2010[J]. Industrial and Corporate Change, 2015, 24(1): 223-250.
|
| [18] |
Cao L, Chen Z, Evans J. Destructive creation, creative destruction, and the paradox of innovation science[J]. Sociology Compass, 2022, 16(11): e13043
|
| [19] |
贺灿飞, 朱晟君. 中国产业发展与布局的关联法则[J]. 地理学报, 2020, 75(12): 2684-2698.
He Canfei, Zhu Shengjun. The principle of relatedness in China’s regional industrial development. Acta Geographica Sinica, 2020, 75(12): 2684-2698.
|
| [20] |
朱晟君, 金文纨, 胡晓辉. 关联视角下的区域产业动态研究进展与反思[J]. 地理研究, 2020, 39(5): 1045-1055.
Zhu Shengjun, Jin Wenwan, Hu Xiaohui. The regional industrial dynamics from the perspective of relatedness. Geographical Research, 2020, 39(5): 1045-1055.
|
| [21] |
Straccamore M, Loreto V, Gravino P. The geography of technological innovation dynamics[J]. Scientific Reports, 2023, 13(1): 21043
|
| [22] |
Choi J, Hwang Y. Patent keyword network analysis for improving technology development efficiency[J]. Technological Forecasting & Social Change, 2014, 83: 170-182.
|
| [23] |
叶玉瑶, 陈奕嘉, 刘向杰, 等. 超越技术的视角: 新型基础设施推动区域经济发展的理论基础与科学议题[J]. 地理科学, 2024, 44(4): 553-561.
Ye Yuyao, Chen Yijia, Liu Xiangjie et al. Beyond the perspective of technology: Theoretical basis and scientificissues of new infrastructure to promote the high-quality development of regional economy. Scientia Geographica Sinica, 2024, 44(4): 553-561.
|
| [24] |
李伟, 王宛, 伏怡铭, 等. 不同经济发展水平下的区域产业退出路径研究[J]. 地理科学, 2025, 45(4): 770-782.
Li Wei, Wang Wan, Fu Yiming et al. Regional industrial exit paths and regional economic development. Geographical Science, 2025, 45(4): 770-782.
|
| [25] |
陈广平, 王琛. 长三角地区创业活动时空演变及其影响因素[J]. 地理科学, 2025, 45(4): 808-821.
Chen Guangping, Wang Chen. Spatio-temporal differences and impact factors of new firm formation rates in the Yangtze River Delta region. Geographical Science, 2025, 45(4): 808-821.
|
| [26] |
Li Yingcheng, David Rigby. Relatedness, complexity, and economic growth in Chinese cities[J]. International Regional Science Review David Rigby, 46(1): 3-37.
|
| [27] |
Higham K, De Rassenfosse G, Jaffe A B. Patent quality: Towards a systematic framework for analysis and measurement[J]. Research Policy, 2021, 50(4): 104215
|
| [28] |
Aicher C, Jacobs A Z, Clauset A. Learning latent block structure in weighted networks[J]. Journal of Complex Networks, 2014, 3(2): 221-248.
|
| [29] |
Bekar C, Carlaw K, Lipsey R. General purpose technologies in theory, application and controversy: A review[J]. Journal of Evolutionary Economics, 2018, 28(5): 1005-1033.
|
| [30] |
曹湛, 戴靓, 吴祖泉, 等. 城市技术网络的概念框架与实证研究[J]. 地理研究, 2023, 42(9): 2302-2323.
Cao Zhan, Dai Liang, Wu Zuquan et al. The conceptual framework and empirical investigation of the interurban technology networks. Geographical Research, 2023, 42(9): 2302-2323.
|
| [31] |
Petralia S, Balland P A, Morrison A. Climbing the ladder of technological development[J]. Research Policy, 2017, 46(5): 956-969.
|
| [32] |
Arthur W B. The nature of technology: What it is and how it evolves [M]. New York: Free Press, 2009.
|
| [33] |
Kim D, Cerigo D B, Jeong H et al. Technological novelty profile and invention’s future impact[J]. EPJ Data Science, 2016, 5(1): 8
|
| [34] |
Fontana M, Iori M, Montobbio F et al. New and atypical combinations: An assessment of novelty and interdisciplinarity[J]. Research Policy, 2020, 49(7): 104063
|
| [35] |
Teixeira da Silva J A. The Matthew effect impacts science and academic publishing by preferentially amplifying citations, metrics and status[J]. Scientometrics, 2021, 126(6): 5373-5377.
|
| [36] |
Triulzi G, Alstott J, Magee C L. Estimating technology performance improvement rates by mining patent data[J]. Technological Forecasting and Social Change, 2020, 158: 120100
|
| [37] |
刘承良, 桂钦昌, 段德忠, 等. 全球科研论文合作网络的结构异质性及其邻近性机理[J]. 地理学报, 2017, 72(4): 737-752.
Liu Chengliang, Gui Qinchang, Duan Dezhong et al. Structural heterogeneity and proximity mechanism of global scientific collaboration network based on co-authored papers. Acta Geographica Sinica, 2017, 72(4): 737-752.
|
/
| 〈 |
|
〉 |