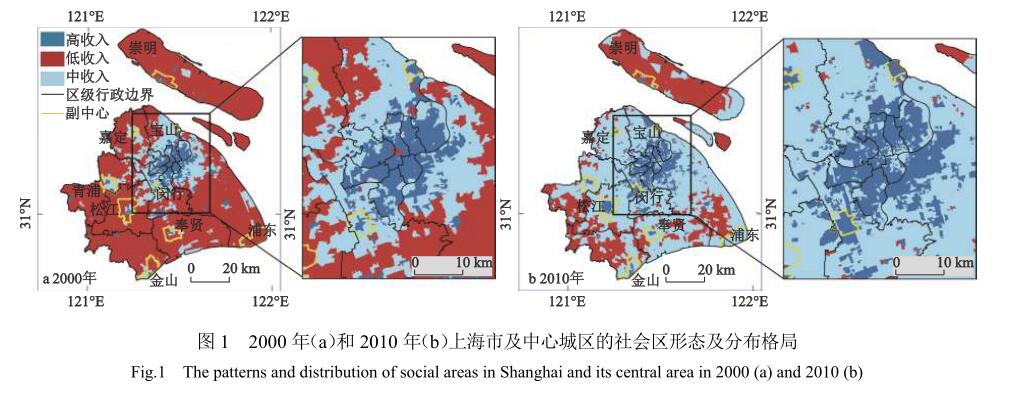
The modern urban theory originating from the West cannot explain all characteristics of the ''Global South Cities'' represented by China. To make the urban theory more inclusive, this paper focuses on the spatial structure and dynamics of high, middle, and low class/income groups, and attempts to capture not only the localism and differences but also the general characteristics of cities through a comparative study of urban social space in three typical cities in China and the United States, namely Shanghai, Chicago, and Los Angeles. The results show that the Chinese cities is characterized by ''the low-income in suburbs and the high-income in the city'', which is opposite to the classical pattern of ''the upper class in the suburbs and the lower class in the city'' in American cities. The neighborhood dynamics in the United States are characterized by more ''downward social space'' in suburbia as well as a growing upward social space in the city. But the Chinese city is characterized by more ''upward social space'' due to the expansion of middle-income neighborhoods in the suburb, and a slight tendency of inner-city gentrification. The differences in urban socio-spatial structure between China and the United States are produced by the distinctions of various socio-economic factors. However, the general characteristics are also be found. The urban socio-spatial structure of each country is corresponding to the urbanization stage, and the differences in the structure and dynamics of social space can be understood by a unified analytical framework of the attractiveness of urban residents and the accessibility of intra-urban transportation. Moreover, the underlying mechanism of the urban socio-spatial dynamics is also similar, which reflects the extension of uneven development of social status in urban space and the spatial manifestation of the success of the dominant group in the locational competition in nature.
Urban agglomeration, as the main battlefield for countries to participate in global competition, plays an important role in leading China's innovation and development. Based on social network analysis and negative binomial model, this paper analyzes overall characteristics, status characteristics and spatial spread characteristics of innovation networks in the Beijing-Tianjin-Hebei, Yangtze River Delta and Pearl River Delta urban agglomerations from 1995 to 2015, and makes in-depth analysis and dynamic comparison of the causes of the differences. The study finds that: 1) From the perspective of the overall characteristics of innovation network, innovation cooperation in Beijing-Tianjin-Hebei urban agglomeration, Yangtze River Delta and Pearl River Delta became increasingly close, dense and networked from 1995 to 2015. Compared with The Beijing-Tianjin-Hebei urban agglomeration and the Pearl River Delta, the Yangtze River Delta has the most sparse innovation network but the most innovative vitality. 2) In terms of the status of innovation network, as the innovation connection breadth of the three urban agglomerations has been greatly improved, the depth of the connection has a large difference in the space-time evolution, resulting in a clear hierarchical difference in node status. On the whole, status hierarchy shows a typical ''pyramid'' structure. The Beijing-Tianjin-Hebei urban agglomeration showed the most significant ''fault'' phenomenon, while the Yangtze River Delta and pearl River Delta showed the trend of equalization and polarization respectively. 3) From the perspective of spatial spread characteristics, the Beijing-Tianjin-Hebei urban agglomeration led by Beijing and Tianjin, shows an inverted ''V'' shape of sprawl to Shijiazhuang and Baoding in the southwest and Tangshan and Qinhuangdao. The Yangtze River Delta is led by ''Shanghai, Nanjing and Hangzhou'' with multiple cores, expanding outwards around the main core cities. The Pearl River Delta is relying on Guangzhou as the core, Guangzhou-Shenzhen, Guangzhou-Zhuhai and Guangzhou-Foshan as the three axes, inverted ''V'' type spread to the Pearl River Estuary. 4) From the point of driving mechanism, network effects and city bilateral attributes can significantly influence the three urban agglomerations innovation linkage intensity. Multidimensional proximity effect on innovation of contact strength of present typical urban agglomerations heterogeneity, border only positive influence on the innovation of the Yangtze river delta cooperation, spatial distance attenuation effect have a negative effect only in Beijing-Tianjin-Hebei and Yangtze River Delta. The relationship between technological proximity and innovation cooperation in Beijing-Tianjin-Hebei and The Yangtze River Delta is inverted U-shaped, but positive U-shaped in the Pearl River Delta. The research results are of great significance to enrich the research results of urban network and strengthen the synergistic effect of urban innovation network.
As a historical process, the evolution of spatial organization in the metropolitan area results from regional economic growth, multi-scale division of labour and multi-subject power relations. This study constructs a multi-scale comparative analysis framework to compare and summarizes the spatial characteristics, organizational rules and evolutionary mechanism of the spatial organization evolution of Shanghai and Los Angeles metropolitan areas. In this way, it is conducive to exploring the characteristics of the spatial organization of China's metropolitan areas. Los Angeles is representative of ''polycentric'' ''low-density'', and ''scattered'' after the transformation of the post-Fordist economy. After the reform and opening-up, Shanghai clustered the benefits of national policy preference and global capital transfer. The rise of many industrial parks and new towns promoted the transformation of Shanghai's spatial organization from ''monocentric'' to ''polycentric''. The adjustment of industrial structure and division of labour are the main reasons for the evolution of spatial organization in metropolitan areas. However, due to the differences in multi-scale spatiality, the processes of evolution are significantly different. As an intermediary for the country to be embedded in the global production network, the spatial organization of the Shanghai metropolitan area is a product of multi-scale political interaction and integration. A large amount of infrastructure investment and construction has attracted global capital, reshaped spatial organization, and strengthened the government's role in uneven regional growth. The construction of a multi-scale comparative analysis framework based on a relationship perspective, which regards cities as a collection of abstractions and concrete practices, provides a new theoretical perspective for understanding and analyzing the mechanism of spatial organization evolution in specific situations.
With the transformation of urban economy to metropolitan economy, urban space is accelerating to expand to suburbs, and the fringe areas have developed rapidly. The development of suburbs presents a new stage characteristic—post-suburbanization. This article puts Shanghai’s suburbs in the post-suburbanization landscape, and uses the post-suburbanization theory to examine the spatial growth of Shanghai's suburbs. Results found: 1) Post-suburbanization is an important stage in the process of suburbanization, which is a new spatial settlement form after the centrifugal and decentralized development of multiple elements. Compared with traditional suburbanization, post-suburbanization space is obviously different in spatial distribution, spatial utilization, spatial relationship, spatial governance mode, etc. 2) The suburbs of Shanghai have entered a new era of post-suburbanization, with more complex and diversified functional spaces in the outer suburbs, more independent suburban spaces, and present urban-like forms. 3) The development of post-suburbanization space has gone through three stages: industrial satellite towns serving industrial production after the founding of the People's Republic of China; development zones for reforming experimental fields after the opening up; and new towns created by comprehensive functional spaces after 2000. Different spatial carriers reshape the elements of suburban landscape and promote the formation of new spatial settlement form. 4) The development-oriented post-suburbanization construction is a new round of large-scale suburban development and construction of local governments to maintain their own growth accumulation strategy, and its formation is the result of the growth alliance under the leadership of the local government.Government's entrepreneurial behaviors; space repair of capital; The participation of residents in space production has obviously promoted the formation of post-suburbanization in China.
This article analyzes how featured town has become a new state space through state rescaling and ''state-capital'' relationship transformation. Taking the spatial restructuring of Intelligence Valley in Hangzhou as an example, three major findings are reported as follows. First, in the process of land use transformation, the governments of Zhejiang Province and Hangzhou city have shifted the scale of power downwardly and outwardly in terms of land regulation, governance networks, and policy incentives, in order to strengthen the regulatory capacity and autonomy of sub-city administrative agencies, which realizes the localization of power in Intelligence Valley. Second, in the process of industrial upgrading, multi-level governments eliminate inefficient industries through the construction of industrial regulatory regime, policy mobilization, corporate compensation and administrative punishment. Subsequently, governments have guided the reterritorialization of capital with resource injection, administrative empowerment, and the improvement of social status. Third, the interaction between the new configuration of the power and the transformation of ''state-capital'' relationship jointly promote Intelligence Valley to become a new state space to sustain high-quality development. In general, the construction of featured towns reveals the development trends of China's state spatial selectivity in sub-city-scale, in which the city strategically constructs a ''sub-city-scale new state space'' to cope with the crisis of land use shortage and industrial inefficiency.
There is a growing body of literature focusing on the process of regional diversification. New industries do not start from scratch but evolve out of regional structures that provide related competences and assets, which means regions are more prone to related diversification. What is still received surprisingly little attention from scholars, though, is a fundamental question of what determines regional diversification, and how do regions develop new growth paths. A city and its surrounding region do not act for themselves, but, instead, ultimately depend on firms to introduce new activities at the micro-scale. There are significant differences in the ability of firms to induce regional structural changes. Based on the resource-based view of the region, the rents to firm-owned resources would seem to preclude its application to regions—which do not own resources—the notion of rents can help understand which agents will be most likely to change the local capability base. Using the database of China's Annual Survey of Industrial Firms (ASIF), this paper investigates the extent to which firms induce a structural change in the manufacturing capability base of Chinese regions between 1998 and 2010. It is found that: 1) The manufacturing capability base of Chinese regions is not stable from 1998 to 2010. Compared with domestic firms, foreign firms are more active in exploring new (to-the-region) economic activities over time. 2) Foreign firms and domestic firms play different roles in regional industrial dynamics in China. In short term, the unrelated diversification required for structural change mostly originates via domestic firms, especially the state-owned ones, compared with their foreign counterparts. Nevertheless, foreign firms manage to create longer-lasting change in regions in long term. The reason may be related to the special role of state-owned enterprises in several developing countries. They can obtain alternative resources from government more easily than other firms, contributing to their ability and willingness of inducing new paths unrelated to China's preexisting industrial structure. Another possible explanation relates to the legal restrictions on economic activities faced by foreign firms in China. 3) The co-evolution of firms and regional industrial structures may be conditional on the regional type. In the manufacturing integration zone, firms tend to become more related to the regional portfolio of activities, deviating less from the region's average capability match. While in manufacturing decentralization regions, this deviation of most agent type is more pronounced. This paper connects more tightly the literature of evolutionary economic geography and international business, that helps understand the mounting evidence on related diversification of regional economies. Besides, it also emphasize the significance of state-owned enterprises in China and several policy implications can be drawn from these empirical findings.
To explore the pattern of population flow will help reveal the law of urban systems and connections between cities. Based on Baidu migration data from March 9 to April 28, 2021, the ''hierarchical-network'' structure of cities in Northeast China was studied from the perspective of population migration by using fractal theory, urban scaling law, social network analysis and self-organizing maps method. The results are as follows: 1) The primacy ratio of urban system based on migration scale is low, and the distribution of high-order cities is concentrated. The scale fractal characteristics of migration routes are concentrated in the high-order and loose in the low order. The relationship between migration scale and urban population is super linear, and Shenyang, Changchun and Harbin are at the first level. 2) In the network based on migration scale, Shenyang, Changchun, Siping, Tieling and Harbin are at the core of the network, while Harbin, Shenyang, Changchun and Dalian are the key hub cities of the network. 3) There are obvious differences in the structure of the network between the directed migration flow and the net migration flow. The migration scale of Shenyang and Changchun is larger, while the net migration volume of Harbin is higher. 4) There is a spatial agglomeration phenomenon of migration behaviors, and the core regions are in the east, central and southern regions. The migration behaviors within the region are mainly intra-provincial migration, which can be divided into 4 sub-groups according to migration preferences. 5) The internal connection of the Harbin-Changchun metropolitan area is weak, and the central-and-southern Liaoning has shown a trend of agglomeration development. 6) Cities in northeast China can be divided into 6 types according to their migration scale and network location, such as high-migration core city and high-migration semi-marginal city, which can better reveal the inner characteristics of cities than a single scale hierarchy division.
Highly-educated talents are not only the intellectual support for urban economic upgrading in the era of knowledge economy but also the important strategic resources for national and regional competition. Based on the microscale big data of the population in Shenzhen, we extract the data of the highly-educated immigrants who migrated to Shenzhen from 1980 to 2014. Using the methods of spatial autocorrelation and event history analysis, we explore the demographic characteristics and the spatial-temporal pattern changes of the high-educated immigrants after the reform and opening up, and investigate the driving factors influencing the individual migration decision-making in the past ten years, attempting to uncover the process of talent agglomeration in Shenzhen under different talents recruitment policy stages. The results found that: 1) The number of highly-educated immigrants in Shenzhen has grown rapidly along with the younger and unmarried demographic characteristics, while the gap in the urban-rural household registration structure has been shrunk. The spatial agglomeration characteristics of the source districts of the highly-educated immigrants are significant as the adjacent areas within Guangdong as well as the Triangle of Central China formed high-high agglomeration and central cities dominated high-low agglomeration. 2) Personal family factors, spatial obstacle factors and socioeconomic factors simultaneously shape the complex process of individual migration. People who are younger, holding urban registration and shorter geographical distance, engaged in industry, commerce and service industries and from areas with smaller population, lower per capita GDP, and more students in universities are more likely to immigrate. 3) The continuous audit policy of talents recruitment implemented in Shenzhen from 2008 to 2012 has effectively attracted the immigration of highly-educated talents, promoted the balance of the age structure of immigrant talents, and weakened the regional socioeconomical factors. The point-system evolution further fosters the equalization of the age structure and the transfer of talents between central cities. The results can provide decision support for the advanced recruitment of highly-educated immigrants and regional development in China.
The compliance rate of the distance between residences (CRDBR) is one of the most essential indicators for estimating the quality of human settlement. In the study, a method for quickly estimating the CRDBR in residential areas from the perspective of daylighting is developed. The CRDBR and its spatiotemporal variations of 1675 residential quarters that was built up since 1982 in Wuhan metropolis are also discussed, integrated with moving T-test, Sen's Slope, Mann-Kendall test and Theil index, using the contours and height of the residences taken from Baidu API. The results show that: 1) The overall accuracy for distinguishing whether the distance of each residence to the buildings ahead of it is compliant or not by the method developed in the study is 92.89%. The mean absolute error for estimating the CRDBR by the proposal method at a quarter scale is 5.14%. 2) The generally low CRDBR is observed in Wuhan metropolis respected by the overall CRDBR of 65.57%. Moreover, the property of the residential quarters that show the CRDBR below 50% is 29.01%. 3) From the year 1982 to 2021, Wuhan metropolis witness four stages, namely quickly decrease, floating growth, slight growth and quickly increase, in the dynamics of the CRDBR. Mixed variations in the CRDBR are observed among the sequential time periods. However, the increase in the CRDBR and decrease in the variations of the CRDBR are generally generated in Wuhan metropolis, respectively, indicating positive patterns of the dynamics in the CRDBR. 4) The ringlike distribution of the Theil index and its average value for the CRDBR is generated in Wuhan metropolis.
Understanding the spatio-temporal variety and influence mechanisms of habitat quality can provide scientific guidance for regional ecological management and sustainable utilization of land resources. In this study, the InVEST model was applied to evaluate the spatio-temporal distribution characteristics of habitat quality in the Wanjiang City Belt from 2000 to 2020. In addition, the multiscale geographically weighted regression (MGWR) was used to analyze the impact of urbanization and landscape pattern on habitat quality. The results showed that from the perspective of temporal change, the average habitat quality index decreased from 0.51 in 2000 to 0.47 in 2020, with a decline rate of 7.84%. In terms of spatial distribution, the spatial distribution of habitat quality showed a spatial distribution pattern that was 'high in the the west and southeast-low in the central and north'. The high-quality habitat areas were mainly distributed in the southeastern and western mountainous areas and some water areas. The low habitat quality areas were distributed in coastal plains and northern agricultural urban areas. The declining habitat quality area were mainly distributed in Hefei, Chuzhou and urban districts along the Yangtze River, such as Maanshan, Wuhu, Tongling, Chizhou and Anqing, which have experienced fast economic development and urban expansion. Rapid urbanization had a significant negative effect on habitat quality in most regions, while the magnitude and direction of the impacts of landscape pattern on habitat quality differed in time and space. The land urbanization rate (LUR) had negative effects on habitat quality in various areas, which became more and more significant over time, and the negative proportion of regression coefficients in both phases reached more than 80%. Moreover, night time light (NTL) had an obvious negative effect on habitat quality in some regions, but as time went on, a positive correlation effect was observed in local areas. These research results can provide decision-making criteria for biodiversity protection and regional sustainable development.
This study firstly constructs a conceptual model of tourism environmental system resilience and a theoretical framework of the influence of traffic accessibility on tourism environmental system resilience. Then, we take 24 county-level units in Xiangxi Area as the study area, introduce set-pair analysis method, weighted average travel time and comprehensive evaluation analysis to research tourism environmental system resilience (TESR). In addition, this research adopts spatial panel Durbin model to examine the spatial spillover effect of traffic accessibility on the resilience of tourism environment system. It is revealed by the results that: 1) The mean value of TESR in Xiangxi Area has increased from 0.407 in 2000 to 0.624 in 2020, and the spatial distribution was relatively stable in the south, while the central and northern parts changed significantly. Based on the results of TESR subsystem measurement in Xiangxi Area, the districts and counties were classified into six types: high-high, high-low, high-low, low-high, low-low, low-low, and low-low; 2) The traffic accessibility shows the characteristic of decreasing from the central part to the surrounding area, forming the relative advantageous zone of Jishou-Fenghuang-Hecheng-Zhijiang-Hongjiang as the high value area of accessibility, and the development trend of regional traffic integration is prominent; 3) The traffic accessibility improves the tourism economic system resilience and tourism social system resilience, which in turn promotes the improvement of TESR.
The identification and mediation of multi-functional potential conflicts in territorial space is an important basis for optimizing the pattern of territorial space and realizing high-quality development. In this paper, the Yellow River Delta is taken as the research area, and the social ecosystem theory is selected to establish conceptual framework of potential conflict of multi-function of territorial space. Then the multi-functional suitability evaluation of territorial space is carried out from three aspects of ecological protection, agricultural production and urban construction. The types, intensities and spatial patterns of multi-functional potential conflicts of territorial space in the Yellow River Delta are revealed by means of multi-dimensional potential conflict identification model. With the help of mediation mechanism of potential conflicts, the optimized pattern of territorial space in the Yellow River Delta is reconstructed. It is concluded that: 1) The suitability of ecological protection, agricultural production and urban construction function in the Yellow River Delta are important, suitable, and suitable, respectively; 2) The types of potential conflicts that the dual-functional type of agricultural production-urban construction and the multi-functional type of ecological protection-agricultural production-urban construction area proportion accounted for 84.12% and 85.35%, and their intensity are severe and moderate respectively, dominated potential conflicts types in the Yellow River Delta; 3) The spatial distribution of multi-functional potential conflicts of territorial space in the Yellow River Delta shows a significant land-river-sea gradient differentiation in the geographical unit, and has a certain degree of imbalance in the administrative unit; 4) Land use planning and land use status play a rigid constraint and flexible guiding effect in the mediation of potential conflicts. The optimized pattern of territorial space formed under the coordination of the two is a scientific guide to regulate the ecological environment vulnerability and regulate the rationality of human activities in the Yellow River Delta.
Technological innovation plays an important role in promoting carbon emission performance and achieving carbon peak and carbon neutrality targets. The study explores the spatio-temporal evolution characteristics of China's carbon emission performance and the impact of technological innovation on it by taking 30 provinces and municipalities in China as the research object, using the Super-SBM model and STIRPAT model. The following conclusions are as follows: 1) China's carbon emission performance shows an overall upward trend in time with a slow growth rate, and changes continuously to the form of median concentration and symmetric distribution. The average has risen from 0.3215 in 2002 to 0.4150 in 2018, with an average annual growth rate of 1.61%. 2) China's carbon emission performance has obvious spatial characteristics, decreasing roughly from the eastern coast to the central and western parts, with Moran's I fluctuating up from 0.2265 in 2002 to 0.3687 in 2018, and the degree of spatial agglomeration keeps increasing. 3) In the variables of technological innovation, the amount of patent authorization, the proportion of R&D expenditure in GDP, and the full-time equivalent of R&D personnel are significantly positively correlated with carbon emission performance. In the control variables, marketization is significantly positively correlated, while industrial structure, energy structure, and urbanization rate are significantly negatively correlated. The study proposes countermeasures in terms of increasing innovation investment, strengthening talent attraction and training, and promoting the conversion of innovation results, which have certain reference value for countries and regions to increase technological innovation drive and improve carbon emission performance.
Using the spatial transformation matrix, landscape pattern analysis, and Optimal Parameters-based Geographical Detector Model, this study aimed to reveal the spatial evolution characteristics and formation mechanism of the ''three-zone space'' in Northeast China in the past 20 years from the two dimensions of transformation gross scale and landscape pattern change. The results showed that: 1) In the last 20a, with the rapid expansion of urban space, the resident population in Northeast China was decreasing, and the imbalance of ''population-land'' in non-central cities was more serious. At the same time, the scale of agricultural space and ecological space had been reduced. 2) Agricultural space was the main source of urban expansion, especially in the main agricultural producing areas. In addition, the conversion between ecological space and agricultural space in non-key and optimized development zones was particularly evident. 3) The trend of landscape fragmentation and heterogeneity in key and optimized development zones was obvious, and the position of agricultural space as a dominant type in the main agricultural product producing areas declined, but no significant change in the landscape pattern of ecological function reserve. 4) Land development policy had a significant impact on both the transformation gross scale and landscape pattern change, but the geographical conditions had a stronger impact on the landscape pattern change and social-economic factors had a more influence on the transformation gross scale.
Based on the spatial scale of cities, the super-efficient MINDS model considering non-desired output was used to measure the agricultural green efficiency of 126 prefecture-level cities in the Yangtze River Economic Belt from 2001 to 2019, and the standard deviation ellipse and ESDA spatial statistics were used to reveal the spatial and temporal divergence characteristics of agricultural green efficiency, and the spatial heterogeneity influence of multiple factors on agricultural green efficiency in the Yangtze River Economic Belt was explored with the GWR model. The results show that: 1) the overall spatial distribution pattern of agricultural green efficiency in the Yangtze River Economic Zone shows a southwest-northeast trend and tends to polarize, and the center of gravity has a tendency to move to the east-northwest. 2) There is a significant positive spatial correlation between agricultural green efficiency in the Yangtze River Economic Zone. In the distribution of cold and hot spots, the hot spot areas converge to the Yangtze River Delta region, the secondary cold spot areas extend upstream, and the middle reaches develop into concentrated continuous cold spot areas. 3) There is a significant spatial non-equilibrium in the regression coefficients of all the influencing factors. The level of industrialization has a negative impact on agricultural green efficiency in most regions, with the weakest inhibitory effect in the upstream areas; the level of urbanization, the scale of agricultural land operation, and the level of agricultural mechanization have an overall positive correlation with agricultural green efficiency, with the regression coefficient of urbanization level decreasing from east to west, and the regression coefficient of the scale of agricultural land operation and agricultural mechanization level showing a collapse in the high east and low west; the overall impact of fiscal expenditure on agricultural green efficiency changes from positive to negative in the 13th Five-Year Plan period, but still plays a positive role in promoting agricultural green efficiency in upstream regions.
In order to deeply understand the thermal, dynamic mechanism and particle microphysical properties of a heavy pollution process in Beijing in spring, a study was conducted based on multiple data sources of environmental, meteorological, sounding, AERONET, ceilometer remote sensing and satellite remote sensing data. The results are as follows: 1) The synergistic observation of multi-source data shows that this pollution originated in the western part of China, with a wide range of impacts, and it constituted a severe pollution up to level 6 in Beijing, with the concentrations of PM2.5 and PM10 as high as 600 μg/m3 and 1000 μg/m3. 2) MODIS MCD19A2 MAIAC AOD data can well reveal the origin, intensity, transport and affected area of the pollution. MISR AOD shows that t microphysical properties of the pollution particle have the characteristics of large mode, non-spherical and non-absorption. 3) CALIPSO data shows that the depolarization was 0.1-0.5 and the color ratio was 0.5-1.3 at the altitude of 1-4 km, showing the phenomenon of ''small depolarization and large color ratio''. 4) AERONET data shows that before, during and after pollution, the AOD_550 nm values were 0.9, 2.0 and 0.2 respectively, and the AE_440-675 nm values were 1.30, 0.4 and 1.0 respectively, indicating that the pollution was a mixture of PM2.5 and PM10. 5) Radiosonde data show that the polluted atmospheric stratification of this pollution was very stable, and there were significant thermodynamic characteristics in each phase. Before the pollution broke out (May 3), the upper atmosphere was humid and the temperature decline rate was small, while the lower atmosphere was dry and rose, forming a convective space. During the pollution outbreak period (May 4), there was a multi-layer inversion and dry atmosphere sinking movement. Driven by the upper westerly wind and the lower southerly wind. At the end of pollution (May 5), the inversion in the lower layer disappears, the height of the inversion in the upper layer continues to rise, and the air was dry, and the wind speed in the deep westerly region continues to increase, ending the pollution process. 6) The results of Ceilometer monitoring and EC model results showed that the atmosphere was stable on May 4th, and the boundary layer was distributed evenly in space, with an atmospheric boundary layer height of about 1200 m at 08:00 and about 300 m at 20:00.
This study uses RS and GIS technique to invert key spatial morphology factors and land surface temperature in the central district of Tianjin. Based on linear regression model and the Cubist model, an in-depth analysis of the relationship between spatial morphology factors (i.e. building density, floor area ratio, building height, and sky view factor) and land surface temperature is accomplished, and the thresholds of key morphology factors are clarified. This study finds that: 1) There is a piecewise linear relationship between building height and land surface temperature, and the response threshold for the mutant change is 13.5 meters; There is a linear negative correlation between sky view factor and land surface temperature. Both building density and floor area ratio show a linear positive correlation with land surface temperature. 2) The Cubist model delineates threshold of building density as 13% and sets the threshold of building height as 9.9 meters. Three sub-rules are established: Rule 1 shows that building density is a positive contributing factor for low development intensity scenarios; Rule 2 shows floor area ratio is a positive contributing factor for medium development intensity scenario; Rule 3 shows that building density and floor area ratio belong to the positive contributing factors, while building height and sky view factor are negative contributing factors for high development intensity scenarios. 3) The Cubist model is more applicable than the global regression model, and it establishes a linear relationship between independent variables and dependent variables for subarea representing different rules which is partitioned by the thresholds of independent variables.
Convective precipitation and stratiform precipitation may carry different isotopic information due to different microphysical processes during precipitation formation. Based on 226 event precipitation samples collected in Lanzhou from 2019 to 2021 and monthly precipitation isotope data of GNIP (Global Network for Isotopes in Precipitation) from 1986 to 1999, combining the precipitation types (convective precipitation and stratiform precipitation) were classified by ERA5 data, the relationship between the proportion of precipitation types and stable isotope in different time scales was analyzed. The results show that the variation of δ18O reflects the change of precipitation type and is negatively correlated with stratiform fraction. This is attributed the strong updraft of convective precipitation makes the precipitation particles riming growth with high δ18O, and the stratiform precipitation is formed by the diffusion and aggregation of water vapor in the precipitation which is relatively depleted in δ18O. Lanzhou is located in semi-arid area, the negative linear relationship between δ18O and stratiform proportion is less obvious than that in humid areas, which may be related to the stratiform precipitation experienced sub-cloud evaporation. On the seasonal scale, the precipitation δ18O in the cold season is lower than that in the warm season, which may be related to the fact that the precipitation in the cold season is predominantly stratiform.