
Tourism Spatial Structure Evolution of Metropolitan Area: A Case Study of Changjiang River Delta Metropolitan Area
Received date: 2011-09-26
Request revised date: 2012-03-19
Online published: 2012-05-20
Copyright
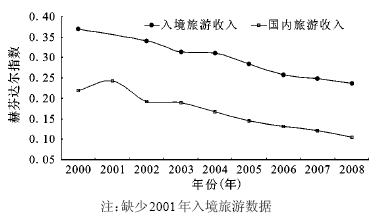
It is significant to optimize spatial structure and promote tourism destination building of metropolitan tourism by studying tourism spatial structure evolution of metropolitan area, which have an important meaning in playing the function and spatial effects of metropolis tourism. The article, based on the data of tourist number and tourism revenue, using Herfindal index and model of regression analysis of rank-size, studys the evolution of tourism spatial structure evolution of Changjiang River delta metropolitan area. The result demonstrates that the q value of Changjiang River delta metropolitan area decreases from 1999 to 2008. The q value of inbound tourism decreases from 1.861 to 1.438 in 1999-2008. The q value of domestic tourism decreases from 1.155 to 0.779, smaller than 1 after 2003. Also its Herfindal index value of inbound tourism decreases from 0.371 to 0.237 and domestic tourism decreases from 0.219 to 0.105. Only the value of domestic tourism Herfindal index in 2000 is greater than year of 1999. It shows that the density of tourist number and tourism income of domestic tourism is smaller than inbound tourism. So the relative disparity of tourism development among cities is shrinking and tourism development tends to equilibrium in Changjiang River delta metropolitan area. In fact, the tourism development is multi-centered, networked, integrated and balanced, and tends to high-level equalization in the Changjiang River delta metropolitan area. Then we discuss its evolution mechanism of tourism spatial structure using the theory of tourism space interaction. It considers that the evolution of tourism spatial structure of metropolitan area may experience such processes as low-level equalization, concentration, diffusion and high-level equalization from the earlier to late period. In this periods, the tourism space interaction play an important role, and the accessibility, complementary and alternative provide necessary conditions for the tourism space interaction among cities of metropolitan area. As main forms of the tourism space interaction, the accumulation and diffusion of tourism finance, technology, personnel, information and experience and other factors promote the evolution tourism spatial structure of metropolitan area from low-level equalization to the high-level equalization. Finally, this article explores the mechanism of tourism spatial structure evolution of metropolitan area from the view of the expansion of tourism enterprises and spatial behavior of tourists which play an important role in evolution of tourism spatial structure of metropolitan area wholly.
ZHU Fu-biao , LU Lin , YU Ran , BAO Jie . Tourism Spatial Structure Evolution of Metropolitan Area: A Case Study of Changjiang River Delta Metropolitan Area[J]. SCIENTIA GEOGRAPHICA SINICA, 2012 , 32(5) : 570 -576 . DOI: 10.13249/j.cnki.sgs.2012.05.570
Table 1 Regression analysis of tourism rank-size of Changjiang River Delta metropolitan area表1 长三角都市圈旅游位序-规模回归分析 |
| 项目 | 年份 | 回归方程 | q | 相关系数(R) | F(sig.) |
|---|---|---|---|---|---|
| 入境旅游 | 1999 | lnPi=5.651-1.861lnPi | 1.861 | 0.973 | 252.994 (0.000) |
| 2000 | lnPi=5.583-1.886lnPi | 1.886 | 0.964 | 184.827 (0.000) | |
| 2001 | lnPi=5.872-1.767lnPi | 1.767 | 0.964 | 184.127 (0.000) | |
| 2002 | lnPi=6.095-1.708lnPi | 1.708 | 0.951 | 131.540 (0.000) | |
| 2003 | lnPi=5.950-1.611lnPi | 1.611 | 0.977 | 291.145 (0.000) | |
| 2004 | lnPi=6.398-1.630lnPi | 1.630 | 0.977 | 296.036 (0.000) | |
| 2005 | lnPi=6.575-1.606lnPi | 1.606 | 0.967 | 204.738 (0.000) | |
| 2006 | lnPi=6.691-1.574lnPi | 1.574 | 0.955 | 144.667 (0.000) | |
| 2007 | lnPi=6.778-1.531lnPi | 1.531 | 0.953 | 137.680 (0.000) | |
| 2008 | lnPi=6.698-1.438lnPi | 1.438 | 0.959 | 160.457 (0.000) | |
| 国内旅游 | 1999 | lnPi=8.697-1.155lnPi | 1.155 | 0.982 | 382.331(0.000) |
| 2000 | lnPi=8.735-1.107lnPi | 1.107 | 0.984 | 441.053 (0.000) | |
| 2001 | lnPi=8.832-1.079lnPi | 1.079 | 0.989 | 603.935 (0.000) | |
| 2002 | lnPi=8.902-1.000lnPi | 1.000 | 0.980 | 335.407 (0.000) | |
| 2003 | lnPi=8.898-0.963lnPi | 0.963 | 0.979 | 321.892 (0.000) | |
| 2004 | lnPi=9.032-0.924lnPi | 0.924 | 0.972 | 243.961(0.000) | |
| 2005 | lnPi=9.117-0.878lnPi | 0.878 | 0.967 | 201.821 (0.000) | |
| 2006 | lnPi=9.213-0.852lnPi | 0.852 | 0.964 | 183.553 (0.000) | |
| 2007 | lnPi=9.304-0.820lnPi | 0.820 | 0.963 | 177.030 (0.000) | |
| 2008 | lnPi=9.363-0.779lnPi | 0.779 | 0.960 | 165.639 (0.000) |
注:各年份回归相关系数均在0.95以上,并通过0.000水平显著性检验,可以用于回归分析。 |
Fig. 1 Tourism Herfindal index of Changjiang River Delta metropolitan area图1 长三角都市圈旅游赫芬达尔指数 |
Fig. 2 Tourism spatial structure of Changjiang River Delta metropolitan area in 2008图2 2008年长三角都市圈旅游空间结构 |
The authors have declared that no competing interests exist.
| [1] |
|
| [2] |
|
| [3] |
|
| [4] |
|
| [5] |
|
| [6] |
|
| [7] |
|
| [8] |
|
| [9] |
|
| [10] |
|
| [11] |
|
| [12] |
|
| [13] |
|
| [14] |
|
| [15] |
|
| [16] |
|
| [17] |
|
| [18] |
|
| [19] |
|
| [20] |
|
| [21] |
|
| [22] |
|
| [23] |
|
| [24] |
|
| [25] |
|
| [26] |
|
| [27] |
|
| [28] |
|
| [29] |
|
| [30] |
|
| [31] |
|
| [32] |
|
| [33] |
|
| [34] |
|
| [35] |
|
| [36] |
国家统计局国际统计信息中心.长江和珠江三角洲及港澳台统计年鉴2009[M].北京:中国统计出版社,2009.
|
| [37] |
中华人民共和国国家旅游局.中国旅游统计年鉴: 2009[M].北京:中国旅游出版社, 2009.
|
| [38] |
|
| [39] |
|
| [40] |
国家旅游局政策法规司,国家统计局城市社会经济调查司,国家统计局农村社会经济调查司.旅游抽样调查资料2009[M].北京:中国旅游出版社,2009.
|
/
| 〈 |
|
〉 |
