×
模态框(Modal)标题
在这里添加一些文本
Close
Close
Submit
Cancel
Confirm
×
模态框(Modal)标题
×
Journal
Article
Figure
Search
EN
中文
Home
About Journal
About Journal
Indexed in
Awards
Editorial Board
Guide for Authors
Browse
Current Issue
Online First
Archive
Highlights
Topic
Archive by Subject
Most Viewed
Most Download
Most Cited
E-mail Alert
RSS
Subscribe
Contact us
EN
中文
Figure/Table detail
Adjusting territorial and economic zoning of China to build a high-quality regional spatial pattern
Li Guoping, Zhu Ting, Sun Yu
SCIENTIA GEOGRAPHICA SINICA
, 2024, 44(
1
): 20-29. DOI:
10.13249/j.cnki.sgs.20231164
Fig. 4
The average distance and total distance between the provincial capitals of each economic zone
Other figure/table from this article
Table 1
Representative plans for economic zoning
Fig. 1
The proportion of GDP in the eastern, central, western and northeast regions of China from 2012 to 2022
Fig. 2
The proportion of GDP in the southern and northern regions of China from 2012 to 2022
Table 2
Changes of GDP share of zones in China in 2012—2022
Fig. 3
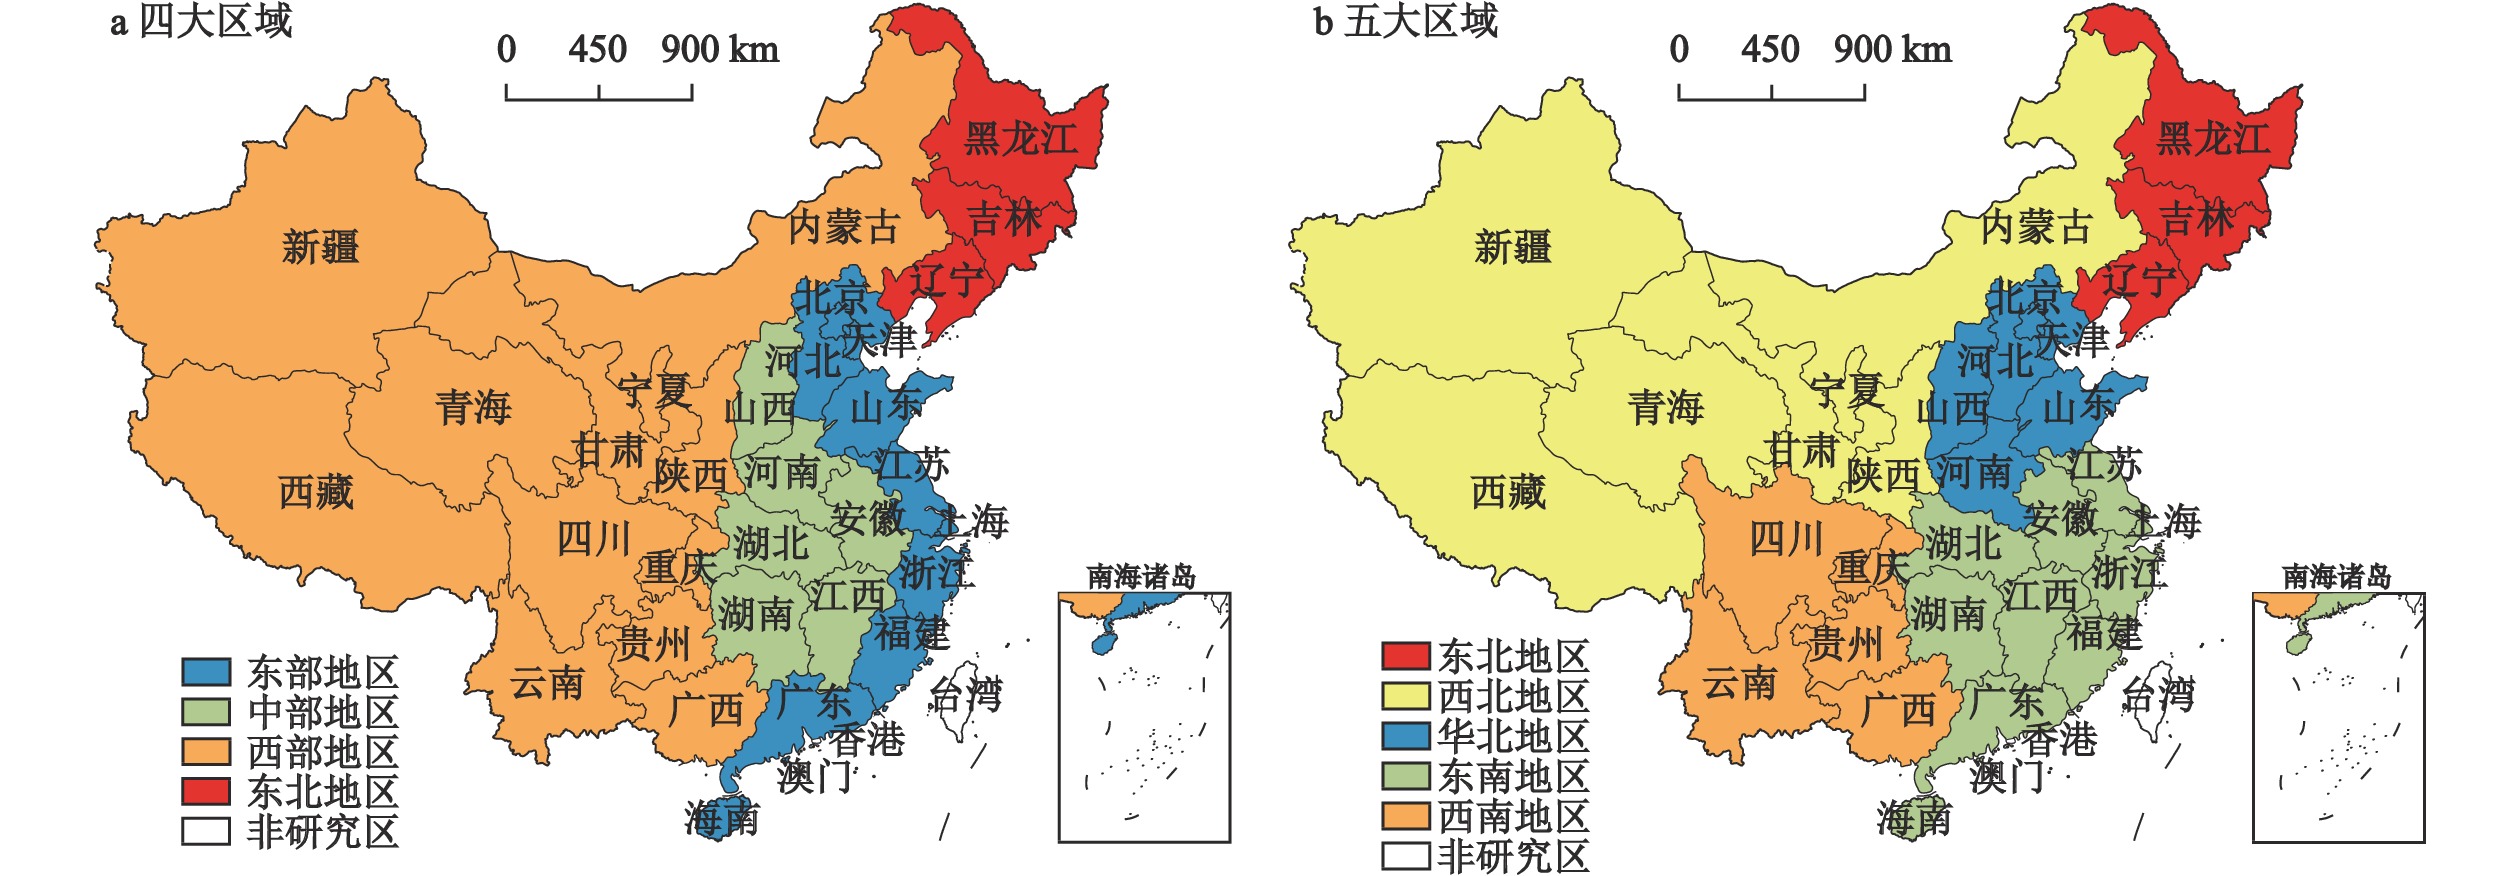
Comparison of economic zoning schemes in China
Table 3
Population and economy of zones of China in 2022