
城市空间结构对惠州市中心城区交通事故影响的时间差异分析
作者简介:柳林(1965-),男,湖南湘潭人,博士,教授,主要从事犯罪空间模拟,多智能体模拟,GIS应用等研究。E-mail: liulin2@mail.sysu.edu.cn
收稿日期: 2014-01-11
要求修回日期: 2014-04-25
网络出版日期: 2015-01-15
基金资助
国家自然科学基金项目(41171140、41271166)资助
Temporally Impact of Urban Structure on City Traffic Accidents in Huizhou
Received date: 2014-01-11
Request revised date: 2014-04-25
Online published: 2015-01-15
Copyright
利用惠州的交通事故数据,结合惠州的土地利用类型及重要设施的分布数据来探讨城市空间结构对交通事故的影响,使用Kernel核心密度法定性探讨交通事故密度的时空变化,把土地类型及重要设施抽象化为点空间要素,建立对数线性回归模型定量讨论城市空间结构对城市交通事故影响的时间差异。分析结果表明,在各个时期惠城区商业用地对交通事故的影响均很显著;工作地和车站对交通事故的影响主要体现在交通流高峰及消散期2个时间段内,但影响程度比商业用地低;在交通流次高峰时,交叉口和工作地的交互作用容易导致事故的高发;城市空间结构通过聚集人流或影响人们的出行等方式对交通事故的发生产生影响。
柳林 , 宋广文 , 周素红 , 陈建国 , 郑重 , 刘凯 . 城市空间结构对惠州市中心城区交通事故影响的时间差异分析[J]. 地理科学, 2015 , 35(1) : 75 -83 . DOI: 10.13249/j.cnki.sgs.2015.01.75
Nowadays, traffic accidents are key factors that influence the safety of residents′ travel, and the urban structure, represented by the land use and important facilities in this study, plays a rather essential role in the happening of traffic accidents. Figuring out the impacts of urban structure on traffic accidents can provide references for government policies and residents′ travel. However, the previous researches were rather qualitative or ignored the temporal characteristics of such spatial elements, which also failed to uncover the interacting effect between different spatial elements, and therefore it could not reveal the internal relations between spatial elements and urban traffic accidents. This study uses the Kernel Core Density method to discuss the spatio-temporal variation qualitatively by making use of the data of traffic accidents in Huizhou City. On this basis, it also adopts network-analysis unit to build a logarithm linear regression model to discuss the temporal disparity of spatial facilities’ influencing on urban traffic accidents, with a purpose to further reveal the spatio-temporal relations between traffic accidents and their influencing factors. The study reveals that the layout of commercial facilities has significant impacts on traffic accidents for the whole day. The impacts of workplaces and stations having on traffic accidents mainly show in and after traffic rush hours, but the influence degree is lower than those of commercial facilities. Besides, the interaction between intersections and workplaces more easily leads to the occurring of accidents in the sub-rush hours. Urban structure has impact on the occurrence of traffic accidents by aggregating people or changing the way people travel. The conclusion of this research contributes to enrich the study of the relationship between urban structure and traffic accidents. Moreover, it also can be a reference for other similar studies.
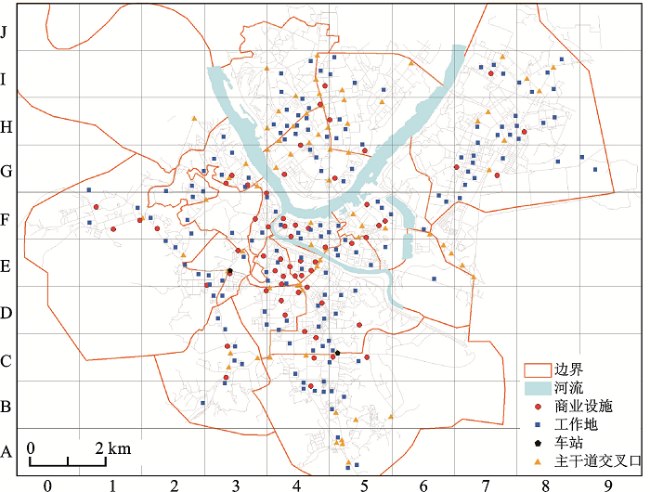
Fig.1 The facilities distribution of Huicheng District after grid processing图1 网格化处理后的惠城区设施分布 |
Fig.3 The ranked distribution of the total accidents in Huicheng District and locations of important facilities图3 惠城区交通事故总量灰度分布及重要设施布局 |
Fig.4 The density distributions of traffic accidents for each period and the whole图4 惠城区交通事故总量及各时期交通事故密度分布 |
Table 1 The correlation matrix of all variables表1 交通事故总量与主要空间要素数量的相关系数矩阵 |
| 事故总量 | I | S | W | ST | |
|---|---|---|---|---|---|
| 事故总量 | 1.000 | 0.466 | 0.846 | 0.586 | 0.298 |
| I | 0.466 | 1.000 | 0.453 | 0.603 | 0.008 |
| S | 0.846 | 0.453 | 1.000 | 0.531 | 0.171 |
| W | 0.586 | 0.603 | 0.531 | 1.000 | 0.107 |
| ST | 0.298 | 0.008 | 0.171 | 0.107 | 1.000 |
注:S代表商业用地,W代表工作用地,ST代表车站数,I代表交叉口。 |
Table 2 The regression parameters for each model表2 交通事故量与主要空间要素量的回归模型的主要参数 |
| 变量 | B | 标准化系数 | T统计量 | 变量 | B | 标准化系数 | T统计量 |
|---|---|---|---|---|---|---|---|
| a交通事故总量回归模型(adjusted R2=0.711) | c次高峰期交通事故回归模型(adjusted R2=0.573) | ||||||
| (常量) | 2.075 | 19.636 | (常量) | 1.710 | 39.371 | ||
| S | 0.210 | 0.473** | 5.213 | S | 0.107 | 0.562** | 5.748 |
| W | 0.153 | 0.452** | 5.037 | IW | 0.008 | 0.372** | 3.809 |
| ST | 0.800 | 0.170* | 2.201 | ||||
| b高峰期交通事故回归模型(adjusted R2=0.678) | d消散期交通事故回归模型(adjusted R2=0.711) | ||||||
| (常量) | 1.744 | 26.136 | (常量) | 1.926 | 20.547 | ||
| S | 0.131 | 0.492** | 5.141 | S | 0.207 | 0.524** | 5.793 |
| W | 0.082 | 0.402** | 4.240 | W | 0.119 | 0.396** | 4.411 |
| ST | 0.532 | 0.189* | 2.318 | ST | 0.732 | 0.175* | 2.271 |
注:*表示在0.05的置信水平下显著,**表示在0.01的置信水平下显著。 |
Table 3 The outliers for each model表3 四大模型的特殊点诊断 |
| 模 型 | 单元编号 | 标准残差 | 实际值 | 预测值 | 残差 |
|---|---|---|---|---|---|
| 交通事故总量模型 | C4 | 2.05 | 4.28 | 3.26 | 1.02 |
| F3 | 2.03 | 3.81 | 2.80 | 1.01 | |
| F4 | -2.17 | 3.64 | 4.72 | -1.08 | |
| 高峰期交通事故模型 | E5 | 2.16 | 3.04 | 2.36 | 0.68 |
| F4 | -3.07 | 2.30 | 3.26 | -0.96 | |
| F6 | 2.08 | 2.64 | 1.99 | 0.65 | |
| 次高峰交通事故模型 | E3 | 2.50 | 2.89 | 2.24 | 0.65 |
| E5 | 2.55 | 2.48 | 1.82 | 0.66 | |
| F4 | -2.47 | 1.79 | 2.43 | -0.64 | |
| 消散期交通事故模型 | C4 | 2.26 | 3.93 | 2.94 | 0.99 |
| F3 | 2.16 | 3.53 | 2.58 | 0.95 |
The authors have declared that no competing interests exist.
| [1] |
公安部交通管理局. 2010年全国道路交通事故情况[R/OL].
|
| [2] |
|
| [3] |
|
| [4] |
|
| [5] |
|
| [6] |
|
| [7] |
|
| [8] |
|
| [9] |
|
| [10] |
|
| [11] |
|
| [12] |
|
| [13] |
|
| [14] |
|
| [15] |
|
| [16] |
|
| [17] |
|
| [18] |
|
| [19] |
|
| [20] |
|
| [21] |
|
| [22] |
|
| [23] |
|
| [24] |
|
| [25] |
|
| [26] |
|
| [27] |
|
| [28] |
|
| [29] |
La Torre Giuseppe VB E,
|
| [30] |
|
| [31] |
|
| [32] |
KinghamS,
|
| [33] |
|
| [34] |
|
| [35] |
|
| [36] |
|
| [37] |
|
| [38] |
广东统计局.广东2011年统计年鉴[M].北京:中国统计出版社, 2011.
|
| [39] |
|
/
| 〈 |
|
〉 |


