
基于多智能体的城市人口分布模型
作者简介:康停军(1981-),山东聊城人,博士研究生,主要从事城市地理信息系统研究。E-mail:gisktj@163.com
收稿日期: 2012-02-18
要求修回日期: 2012-04-13
网络出版日期: 2012-07-20
基金资助
国家自然科学基金(40971216、41071246)资助
Agent-based Urban Population Distribution Model
Received date: 2012-02-18
Request revised date: 2012-04-13
Online published: 2012-07-20
Copyright
康停军 , 张新长 , 赵元 , 王海鹰 , 张维 . 基于多智能体的城市人口分布模型[J]. 地理科学, 2012 , 32(7) : 790 -797 . DOI: 10.13249/j.cnki.sgs.2012.07.790
The acquisition of detailed population distribution has become an important research topic in the fields of geography and its relative disciplines. Urban population distribution is of significance in the correlation analysis among economies, environment protection, resources utilization and urban planning. In recent years, grid transformation of population data based on GIS and RS technologies has become the focus of population spatial distribution. Many transformation models (digital population model, kernel estimate model, gravity model, etc.) and high resolution RS images (ETM image, land use data and aerophotogrammetry image, etc.) are used. The existing researches mainly use the top-down models. The applications of them are limited since there are too many parameters to determine or too complex to execute. Urban population distribution is a typical bottom-up macroscopic phenomenon caused by individual migration at the microscopic level. Multi-agent technology provides a new solution for such problems. It has been widely used in the field of land-use simulation, land-use planning and residential segregation. This article analyzes the importance of spatial distribution of urban population data. To overcome the disadvantages of traditional methods, a framework based on multi-agent system and GIS is proposed to model the spatial distribution of urban population data. This framework consists of external environment controller, housing infrastructure, multi-agent and rule. Impact factors, such as traffic accessibility, education, environment and living facility have been chosen and quantified by GIS. In the framework, each agent represents a family. Within the consideration of economic conditions and school-age children, agents are divided into six categories. The impact factor weights in each category are determined by AHP. Residential land has been rasterized into regular residential cell in initial condition; each residential cell has the same amount of agents. Whether an agent migrates or not depends on the residential pressure, and the probability of leaving its current location increases monotonically with the residential pressure. Under the residential pressure of socio-economy, every agent decides whether to leave the residential location or not. If an agent decides to leave, it must select the optimal location to migrate according to the constraints such as incomes and perception of the environment. If the target location has been full of agents, the migrating agent must consult with every agent living in the target location. Exponential function is introduced to represent the probability of successful consultation, which depends on the utilities in target location of two consulting agents. The population distribution is formed by means of decision-making, consulting and migration of agents. The proposed model is applied to simulating the population distribution of two districts in Guangzhou, Guangdong Province, China. Compared with the gravity model, the model proposed in this article achieves higher accuracy and is closer to the actual distribution pattern. In a conclusion, the simulation model based on multi-agent technology can provide a new method of modeling urban population distribution.
Key words: population distribution; simulation; multi-agent; Guangzhou
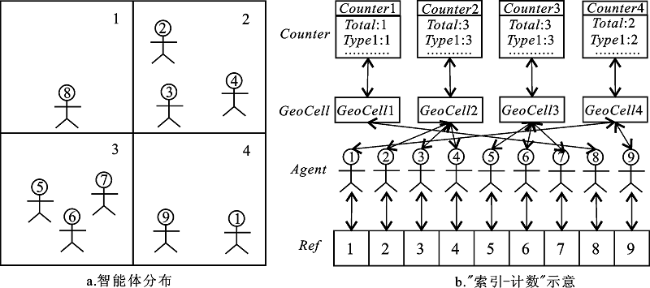
Fig. 1 Distribution of agents and “index-counter”图 1 智能体分布及“索引–计数”图 |
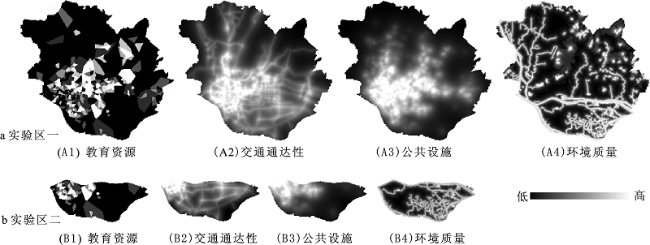
Fig.2 Impact factor on settlement图2 居住影响因素 |
Table 1 Number and weights of different family agents表1 不同类型家庭的数量及权重 |
| Agent类型 | 实验区一 | 实验区二 | 影响因素权重 | |||||
|---|---|---|---|---|---|---|---|---|
| 比例(%) | 数量 | 比例(%) | 数量 | 自然环境 | 交通通达度 | 教育资源 | 公共设施 | |
| 低收入无教育需求 | 25 | 278330 | 22 | 65235 | 0.0764 | 0.5193 | 0.0489 | 0.3554 |
| 低收入有教育需求 | 12 | 133599 | 11 | 32617 | 0.0522 | 0.4934 | 0.1427 | 0.3117 |
| 中收入无教育需求 | 33 | 367396 | 33 | 97853 | 0.2240 | 0.3680 | 0.0399 | 0.3680 |
| 中收入有教育需求 | 16 | 178131 | 18 | 53374 | 0.1429 | 0.2857 | 0.2857 | 0.2857 |
| 高收入无教育需求 | 9 | 100199 | 10 | 29652 | 0.3742 | 0.2088 | 0.0427 | 0.3742 |
| 高收入有教育需求 | 5 | 55666 | 6 | 17791 | 0.2857 | 0.1429 | 0.2857 | 0.2857 |
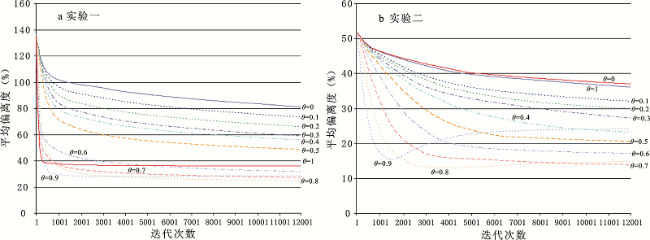
Fig. 3 The relation between iteration and average deviation of different weight图3 模拟迭代次数与平均偏离度关系 |
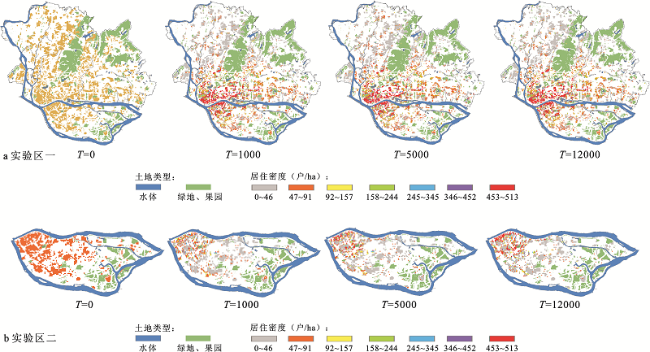
Fig.4 Simulation of population distribution at different time图4 不同时刻人口分布模拟 |
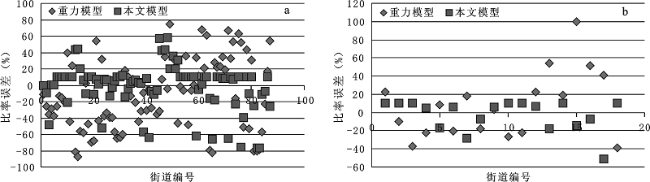
Fig.5 Ratio errors of gravity model and proposed model图5 本文模型与重力模型模拟比率误差分布 |
The authors have declared that no competing interests exist.
| [1] |
|
| [2] |
|
| [3] |
|
| [4] |
|
| [5] |
|
| [6] |
|
| [7] |
|
| [8] |
|
| [9] |
|
| [10] |
|
| [11] |
|
| [12] |
|
| [13] |
|
| [14] |
|
| [15] |
|
| [16] |
|
| [17] |
|
| [18] |
|
| [19] |
|
| [20] |
|
| [21] |
|
| [22] |
|
| [23] |
|
| [24] |
广州市统计局.广州统计年鉴2007[M].北京:中国统计出版社,2007.
|
| [25] |
广州市统计局.2006年广州市国民经济和社会发展统计公报[R/OL].
|
| [26] |
|
| [27] |
|
/
| 〈 |
|
〉 |