
福建省综合交通可达性格局及其与制造业空间分布的关系分析
作者简介:陈松林(1964-),福建南安人,教授,博士,主要从事土地利用与规划、地理信息系统应用等研究。E-mail: slchen6@163.com
收稿日期: 2011-09-26
要求修回日期: 2012-03-19
网络出版日期: 2012-07-20
基金资助
教育部人文社科研究规划基金项目(09YJA790044)、教育部人文社科重点研究基地项目(10JJDZONGHE017)、福建省自然科学基金(2012J01162)资助
The Integrated Transportation Accessibility in Fujian Province and Its Correlation with the Spatial Distribution of Manufacturing
Received date: 2011-09-26
Request revised date: 2012-03-19
Online published: 2012-07-20
Copyright
以福建省为研究区域,县(市)为研究单元,采用加权平均旅行时间指标,分析公路(区内与区外联系)、铁路、港口、航空等交通方式及区域综合交通网络的可达性空间格局,探讨各交通网络空间分布的均衡性。选取制造业中的28个行业,从资源集约度角度将其分为资源密集型制造业、劳动密集型制造业、资本密集型制造业,利用平均集中率测量产业集聚度。引入要素禀赋条件、外部性、规模经济、制度政策4个方面13个变量对福建制造业空间分布影响因素进行回归分析。结果表明:福建省路网可达性由沿海中部向四周降低,其中公路区内可达性呈明显的圈层结构,区外可达性为“井”字形分布,铁路、港口和机场形成以福州、厦门—泉州为可达性高值区的马鞍状格局,综合交通网络可达性呈带状分布。不同类型的制造业在空间分布格局上呈现不同的特征,制造业平均集中率高值区呈环状分布,而制造业集中率低值区呈点状分布,与交通可达性的“凹陷区”重合。可达性与制造业空间集聚呈现很强的相关性,并且与不同类型制造业空间集聚相关程度有所差异,与资源密集型制造业空间集聚相关性相对较低。此外,农业丰裕度、自然资源禀赋、知识溢出效应、相对企业规模等其他变量对制造业空间分布也有显著影响。
陈松林 , 陈进栋 , 韦素琼 . 福建省综合交通可达性格局及其与制造业空间分布的关系分析[J]. 地理科学, 2012 , 32(7) : 807 -815 . DOI: 10.13249/j.cnki.sgs.2012.07.807
Focusing on Fujian Province with counties and cities as the basic research units, the study uses weighted average travel time as an indicator to analyze the accessibility patterns of highways within Fujian Province and those between Fujian and other provinces, as well as those of railways, ports and civil aviations respectively. Then, with the result of these patterns, the accessibility patterns of integrated transportation are elaborated. Finally, the proportionality of transportation space distribution is discussed. Basing on classification method of resources intensive, the selected 28 kinds of manufacturing industries can be classified into resources-intensive manufacturing, labor-intensive manufacturing and capital-intensive manufacturing. Then by Average Concentration Rate, industry centralization is calculated. Selecting 13 variables in the aspects of endowment factors, external economies, scale economies and policies to do regression analysis of influencing factors on the spatial distribution of manufacturing. The results indicate that: the accessibility of integrated transportation in Fujian Province decreases from the central coastal area to the periphery with the accessibility of highways within Fujian Province presenting an obvious circle structure, and the accessibility of highways between Fujian and other provinces taking the shape of "﹟", while railways, ports, and airports form a saddle-shaped pattern of high accessibility around Fuzhou-Xiamen-Quanzhou area. The integrated transportation net shows a zonal distribution. The different types of manufacturing present the different characteristics in spatial distribution: the high value area of manufacturing average concentration rate show an annular distribution and the low value area is distributed dottedly, which coincide with the "sag area" of transportation accessibility. There are strong positive correlations between transportation accessibility and manufacturing industries agglomeration, but the correlation degree is different in various types of manufacturing. For example, transportation accessibility has a low correlative rate with the resources-intensive manufacturing. In addition, the determinative factors of manufacturing industries agglomeration in Fujian Province also include agriculture abundance, natural resources endowments, knowledge spillovers and relative enterprise scale .
Key words: accessibility; transportation network; manufacturing type; Fujian Province
Fig. 1 The administrative map of Fujian Province图1 福建省行政区划 |
Fig. 2 The highway accessibility in Fujian Province图2 福建省公路区内可达性 |
Fig. 3 The main highways accessibility between Fujian and other provinces图3 福建省公路区外可达性 |
Fig. 4 The railway accessibility in Fujian Province图4 福建省铁路可达性 |
Fig. 5 The port accessibility in Fujian Province图5 福建省港口可达性 |
Fig. 6 The civil aviation accessibility in Fujian Province图6 福建省机场可达性 |
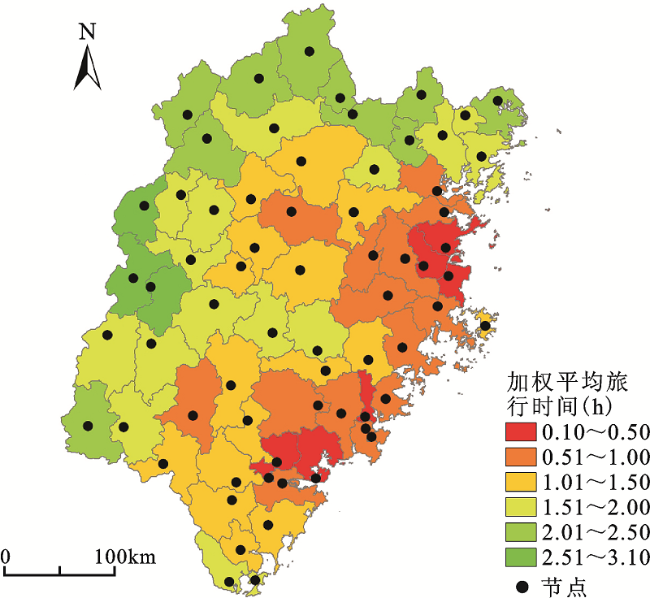
Fig. 7 The integrated accessibility in Fujian Province图7 福建省综合可达性格局 |
Fig. 8 The average concentration rate of manufacturing industries图8 制造业平均集中率 |
Table 1 Definitions of explanatory variables in models of manufacturing location in Fujian Province表1 福建省制造业区位模型中解释变量的描述 |
| 变量名称 | 代号 | 含义 | |
|---|---|---|---|
| 要素禀赋条件 | 农业丰裕度 | Agrg | 农业产出占GDP的比重 |
| 自然资源禀赋 | Mini | 采掘业产出占GDP的比重 | |
| 资本禀赋 | Capital | 资本形成总额占GDP的比重 | |
| 劳动力成本 | Wage | 职工平均工资与地区职工平均工资之比 | |
| 交通密度 | Trans | 公路里程/地区面积 | |
| 综合可达性 | Comp-A | 见式(1) | |
| 外部性 | 市场规模 | GDP | 各县(市)人均GDP与全省平均水平的比值 |
| 技术溢出效应 | Patent | 各地区专利申请批准量占全国的比重 | |
| 集聚经济 | 相对企业规模 | Size | 制造业从业人员/制造业企业个数 |
| 地方化经济 | Div | 各产业总产值与全部制造业总产值比值之平方和 | |
| 城市化经济 | Urban | 非农业人口比重 | |
| 制度政策 | 市场化程度 | State | 国有企业总产值占地区工业总产值的比重 |
| 对外开放度 | FDI | 实际使用外资金额的对数 | |
Table 2 Regression analysis of factors influencing manufacturing industries distribution表2 制造业地理分布影响因素回归结果 |
| 变量 | 要素禀赋条件 | 外部性 | 集聚经济 | 制度政策 | 全部效应 |
|---|---|---|---|---|---|
| Constant | -0.353 | -2.662*** | -3.209*** | -4.043*** | -2.081*** |
| Agrg | -3.640*** | -2.659*** | |||
| Mini | -2.584** | -2.637** | |||
| Capital | -0.818** | -0.246 | |||
| Wage | 0.802 | 1.249 | |||
| Trans | -0.013 | -0.186 | |||
| Comp-A | 1.388*** | 0.452* | |||
| GDP | 2.561** | 0.294 | |||
| Patent | 5.471* | 0.739* | |||
| Size | 0.037*** | 0.014** | |||
| Div | -2.502*** | -2.104*** | |||
| Urban | 3.498*** | 0.792 | |||
| State | -0.610 | -1.845 | |||
| FDI | 0.479*** | 0.116* | |||
| R2 | 0.781 | 0.655 | 0.669 | 0.538 | 0.891 |
| F | 28.984 | 46.642 | 30.336 | 23.687 | 24.124 |
| D.W. | 2.036 | 1.990 | 1.914 | 1.984 | 2.089 |
注:***在0.01水平显著,**在0.05水平显著,*在0.1水平显著,回归结果经过异方差性矫正。 |
The authors have declared that no competing interests exist.
| [1] |
|
| [2] |
|
| [3] |
|
| [4] |
|
| [5] |
|
| [6] |
|
| [7] |
|
| [8] |
|
| [9] |
|
| [10] |
|
| [11] |
|
| [12] |
|
| [13] |
|
| [14] |
|
| [15] |
|
| [16] |
|
| [17] |
|
| [18] |
|
| [19] |
|
| [20] |
|
| [21] |
|
| [22] |
|
| [23] |
|
| [24] |
|
| [25] |
|
| [26] |
|
| [27] |
|
| [28] |
|
| [29] |
福建省统计局.福建统计年鉴(2009)[M].北京:中国统计出版社,2009.
|
| [30] |
|
| [31] |
福建省住房和城乡建设厅.厦泉漳城市发展走廊规划研究[EB/OL].
|
| [32] |
中国民用航空局.2008年民航机场生产统计公报[R/OL].
|
| [33] |
|
/
| 〈 |
|
〉 |


