
水库调节地区东江流域非一致性水文极值演变特征、成因及影响
作者简介:叶长青(1982-),男,海南屯昌人,博士研究生,主要从事水文水资源方面研究。E-mail:yechangqing2001@hotmail.com
收稿日期: 2012-08-22
要求修回日期: 2013-01-04
网络出版日期: 2013-07-20
基金资助
国家自然科学基金重大国际合作和重点项目(51210013,50839005)、水利部公益性行业科研专项经费项目专题(200901043-3)、广东省科技厅项目(2010B050300010)、广东省水利科技创新项目(2009-39)、中山大学重大项目培育和新兴交叉学科项目(10lgzd11)、国家重点基础研究发展计划(973)项目(2010CB428405)、广东省自然科学基金(S2011040005992)、国家自然科学基金(51209095)、国家自然科学基金项目(41001019)资助
Changing Properties, Causes and Impacts of Non-stationary Extreme Stream Flow Under the Changing Environment of Hydraulic Engineering Regulated Basin in Dongjiang River, China
Received date: 2012-08-22
Request revised date: 2013-01-04
Online published: 2013-07-20
Copyright
叶长青 , 陈晓宏 , 张家鸣 , 张丽娟 , 孔兰 . 水库调节地区东江流域非一致性水文极值演变特征、成因及影响[J]. 地理科学, 2013 , 33(7) : 851 -858 . DOI: 10.13249/j.cnki.sgs.2013.07.851
No "stationarity" existed any longer in the environmental background for the formation of runoff series. Designed by the existing engineering hydrologic analysis method will face the risk of distortion in design frequency caused by the ever-changing environment. We analyzed the statistical properties of hydrologic extreme flow for hydrologic station of Longchuan and Heyuan in Dongjiang river using 8 probability distribution functions. Estimate of parameters was performed using the maximum likelihood technique. Goodness of fit was done based on AIC, BIC and AICc for the optimal linear frequency distribution before and after environment change. And the rules and effects of variability for hydrologic extreme flow was discussed. The research results indicate that the non-stationary annual maximum daily flow series of stations in Dongjiang Basin show a descend trend that caused by rainfall and construction of water conservancy projects. Mixed tail distribution (LN2) at Longchuan and Heyuan stations were found to be the best fitting model. The optimal linear frequency distribution maintain consistency before and after environment change, but the impacts on fitting curve of flood series showed an overall performance as upper tail from "steep" to "gentle". The Changing properties and impacts of parameters to distribution are analyzed by the 30-year moving average method. Flood frequency analyses for Dongjiang river show that the maximum flow with a 0.01-annual probability (corresponding to 100-year flood peak under stationary conditions) over the 56-year record has ranged from a maximum discharge of 9 189 m3/s to a minimum of 2 305 m3/s at longchuan station; and has ranged from a maximum discharge of 11 125 m3/s to a minimum of 4 072 m3/s at Heyuan station. If the non-stationarity of series is not considered, the traditional method is still used for calculation. At the Longchuan and Heyuan Stations, the design flood magnitude will be overestimated. Compared with non-stationary flood series characteristics, the flood magnitude is smaller and the frequency is lower for the stationary "real" flood series characteristics caused by hydraulic engineering regulation and rainfall. After changes in the hydrological regime, the flood return period estimated before the change is often unable to well describe the flood frequency characteristics after environmental changes.
Table 1 Background and data sources of research area表1 研究区背景及资料来源 |
| 水文站 | 位置 | 流域面积(km2) | 序列长度 | |
|---|---|---|---|---|
| 龙川 | 115°15´E | 24°07´N | 7 699 | 1954-1-1~2009-12-31 |
| 河源 | 114°42´E | 23°44´N | 15 750 | 1954-1-1~2009-12-31 |
Table 2 Detailed information of major reservoirs in Dongjiang River表2 东江流域主要水库详细信息 |
| 水库 | 河流 | 库容 (108m3) | 建库年代 | 影响站点 |
|---|---|---|---|---|
| 枫树坝 | 东江干流 | 19.4 | 1970~1974 | 龙川,河源 |
| 新丰江 | 新丰江 | 139.0 | 1958~1962 | 河源 |
Table 3 Distributions probability density function of hydrological frequency analysis表3 水文频率分析的分布概率密度函数 |
| 分布线型 | 概率密度函数 | 参数 | 特征 |
|---|---|---|---|
| PT3 | 尺度: ;位置:;形状: | 薄尾 | |
| GLO | 当 k≠0, y= k-1ln{1-k x-ξ /α}; 当 k=0, y= x-ξ/α. | 尺度: ;位置: ξ;形状: k | 厚尾 |
| GEV | 尺度: ;位置: ξ;形状:k | 混尾 | |
| Weibull | 尺度: ;位置: ξ;形状: k | 薄尾 | |
| Gumbel | 尺度: ;位置: ξ | 混尾 | |
| LN3 | 尺度: ;位置: ξ;形状: | 混尾 |
注:当LN3分布位置参数ξ为0时则为LN2分布概率密度函数;PT3分布取对数变换则为LP3分布概率密度函数 |
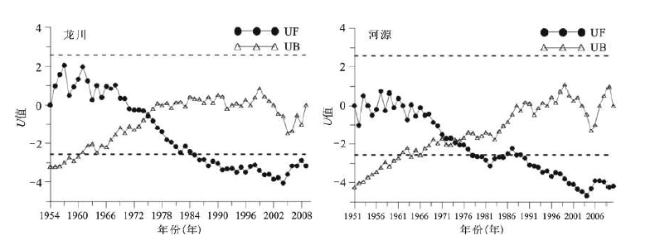
Fig.1 M-K test of annual maximum daily flow series in Dongjiang River Basin图1 东江流域年最大流量M-K检验 |
Table 5 Fitting test value of 8 probability distributions for flood frequency analysis in Dongjiang River表5 东江年最大流量8种概率分布的拟合检验值 |
| 水文站 | 拟合检验 | PT3 | GLO | GEV | Weibull | GUM | LN3 | LN2 | LP3 |
|---|---|---|---|---|---|---|---|---|---|
| 龙川 (1954~2009年) | AIC | 922.91 | 921.16 | 931.93 | 923.68 | 929.84 | 921.38 | 919.78 | 925.66 |
| BIC | 928.99 | 927.24 | 938.01 | 929.75 | 933.90 | 927.45 | 923.84 | 931.73 | |
| AICc | 923.37 | 921.62 | 932.39 | 924.14 | 930.07 | 921.84 | 920.01 | 926.12 | |
| 龙川 (1975~2009年) | AIC | 557.39 | 548.83 | 548.91 | 549.21 | 548.18 | 548.85 | 546.87 | 548.85 |
| BIC | 562.06 | 553.49 | 553.57 | 553.87 | 551.29 | 553.52 | 549.98 | 553.52 | |
| AICc | 558.17 | 549.60 | 549.68 | 549.98 | 548.55 | 549.62 | 547.24 | 549.62 | |
| 河源 (1951~2010年) | AIC | 1046.99 | 1038.33 | 1040.67 | 1036.11 | 1038.64 | 1037.52 | 1035.63 | 1037.33 |
| BIC | 1053.28 | 1044.62 | 1046.95 | 1042.40 | 1042.83 | 1043.81 | 1039.82 | 1043.61 | |
| AICc | 1047.42 | 1038.76 | 1041.09 | 1036.54 | 1038.85 | 1037.95 | 1035.84 | 1037.76 | |
| 河源 (1964~2010年) | AIC | 803.21 | 791.43 | 792.32 | 794.23 | 792.72 | 792.80 | 790.85 | 792.85 |
| BIC | 808.76 | 796.98 | 797.87 | 799.78 | 796.42 | 798.35 | 794.55 | 798.40 | |
| AICc | 803.77 | 791.98 | 792.88 | 794.79 | 792.99 | 793.35 | 791.13 | 793.41 |
注:下划线数值所对应的概率分布函数是最适合水文站年最大流量的分布函数;各拟合检验值越小表示概率分布函数越适合。 |
Table 6 Parameter estimation of maximum likelihood methods for optimal distribution model in Dongjiang River表6 东江年最大流量的最优分布极大似然法参数估计 |
| 水文站 | 序列长度(年代) | 最优分布 | 参数 | ||
|---|---|---|---|---|---|
| 尺度 | 形状 | 位置 | |||
| 龙川 | 1954~2009 | LN2 | 7.184 | 0.653 | / |
| 1975~2009 | LN2 | 6.956 | 0.538 | / | |
| 河源 | 1951~2010 | LN2 | 7.684 | 0.603 | / |
| 1964~2010 | LN2 | 7.563 | 0.543 | / | |
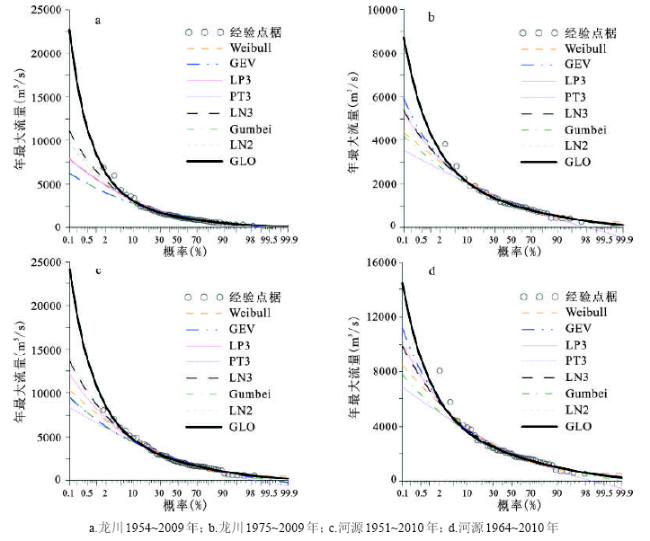
Fig.2 Comparison the flood frequency distribution curve of annual maximum flow in Dongjiang River图2 东江年最大流量频率分布曲线对比 |
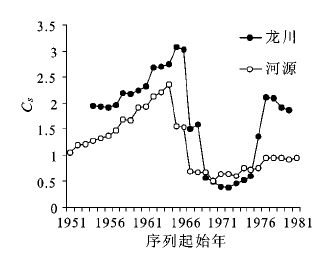
Fig.3 Change process of 30 a moving Cs value of annual maximum flow series in Dongjiang River图3 东江年最大流量序列参数30 a滑动Cs变化过程 |
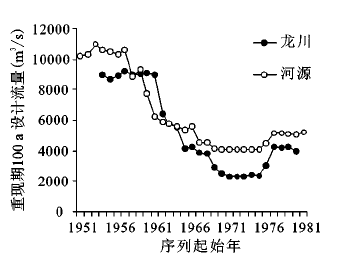
Fig.4 Change process of design flood peak flow (Return period=100 years)图4 重现期100 a的设计洪峰流量变化趋势 |
Table 7 Designed maximum daily flow(m3/s)in return periods before and after environment change in Dongjiang River表7 东江变化环境前后水文站各重现期对应极值流量(m3/s)的设计值 |
| 水文站 | 线型 | 序列长度(年) | T=5 | T=10 | T=20 | T=50 | T=100 | T=200 |
|---|---|---|---|---|---|---|---|---|
| 龙川 | LN2 | 1954~2009 | 2284.43 | 3099.44 | 3997.56 | 5038.82 | 6020.42 | 7085.47 |
| 1975~2009 | 1650.35 | 2091.31 | 2543.02 | 3169.11 | 3669.98 | 4197.46 | ||
| 河源 | LN2 | 1951~2010 | 3609.37 | 4705.90 | 5858.50 | 7496.70 | 8836.09 | 10270.60 |
| 1964~2010 | 3040.74 | 3860.60 | 4701.90 | 5869.97 | 6805.78 | 7792.42 |
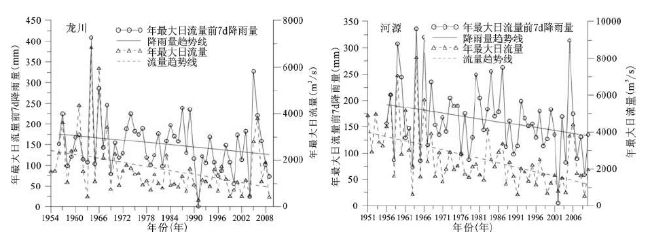
Fig.5 Change process of annual maximum flow and sum of previous seven-days rainfall value in Dongjiang River Basin图5 东江流域年最大流量及前7 d降雨量的变化过程 |
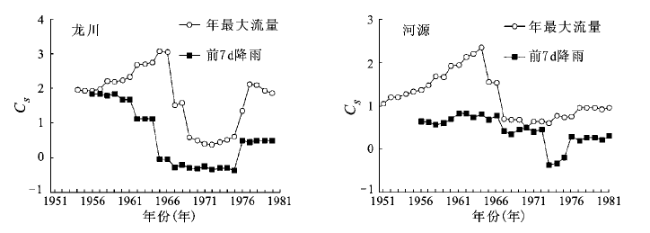
Fig.6 Change process of 30 a moving Cs value of annual maximum daily flow series and previous seven-days rainfall series in Dongjiang River图6 东江年最大流量和前7 d降雨量序列参数30 a滑动Cs变化过程 |
The authors have declared that no competing interests exist.
| [1] |
|
| [2] |
|
| [3] |
|
| [4] |
|
| [5] |
|
| [6] |
|
| [7] |
|
| [8] |
|
| [9] |
|
| [10] |
|
| [11] |
|
| [12] |
|
| [13] |
|
| [14] |
|
| [15] |
|
| [16] |
|
| [17] |
|
| [18] |
|
| [19] |
|
| [20] |
|
| [21] |
|
/
| 〈 |
|
〉 |