
住房制度改革以来长春市新建住宅的空间布局研究
作者简介:庞瑞秋(1974-),女,内蒙古开鲁人,博士,副教授,主要从事城市规划与设计,城市地理学研究。E-mail: pangrq615@nenu.edu.cn
收稿日期: 2012-07-11
要求修回日期: 2012-12-12
网络出版日期: 2013-04-20
基金资助
国家自然科学基金项目(51178091)资助
The Spatial Layout of Residence Since the Reform of Housing System in Changchun
Received date: 2012-07-11
Request revised date: 2012-12-12
Online published: 2013-04-20
Copyright
庞瑞秋 , 赵梓渝 , 王唯 , 姚雪松 . 住房制度改革以来长春市新建住宅的空间布局研究[J]. 地理科学, 2013 , 33(4) : 435 -442 . DOI: 10.13249/j.cnki.sgs.2013.04.435
This article, taking the urban area of Changchun as an example, based on data from the websites of Sohu Focus-Changchun Real Estate and www.fangjia.com, applies counter weight analysis and the GIS platform. It analyzes the distribution patterns of newly-constructed residential space in Changchun from 1991 to 2012, and points out that the residential pattern of space in Changchun has the following features: 1) an evident tendency of housing suburbanization; 2) residential space distributes along the city’s main roads in an axial arrangement and centers on urban green space and water space in a circular arrangement; 3) housing prices show general single-center and multi-core circular distributions. Further, on the basis of analyzing the factors that influence newly-constructed residences, the article analyzes the effect of this kind of space distribution: the separation of housing and workplaces, resulting from the suburbanized distribution of the city’s population, is aggravating traffic pressures and the suburbanization and multi-centralizaton of business spaces.
Key words: reform of the housing system; housing space; spatial pattern; Changchun
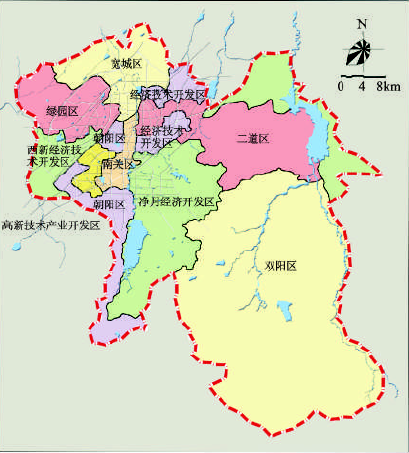
Fig.1 Location of different districts of Changchun图1 长春市各区区位图 |
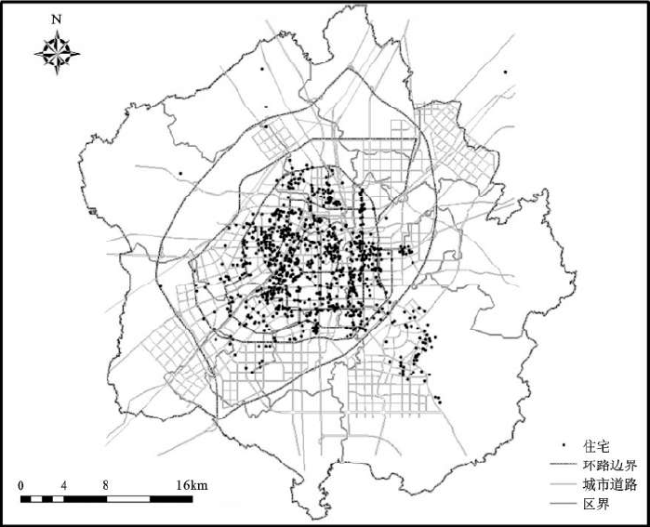
Fig.2 Distribution of sample points of houses图2 楼盘样本点分布 |
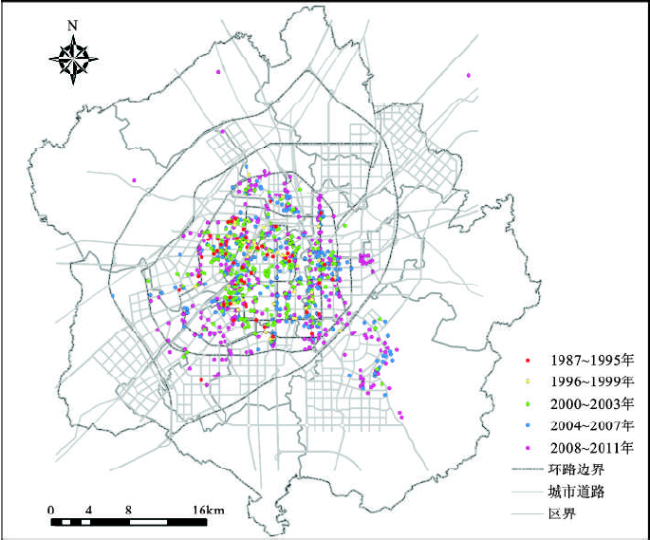
Fig.3 Location of residential construction图3 不同年份住宅建筑分布 |
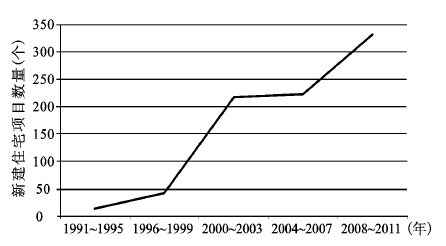
Fig.4 The number of newly-constructed houses in each stage图4 各阶段年新建住宅数量趋势 |
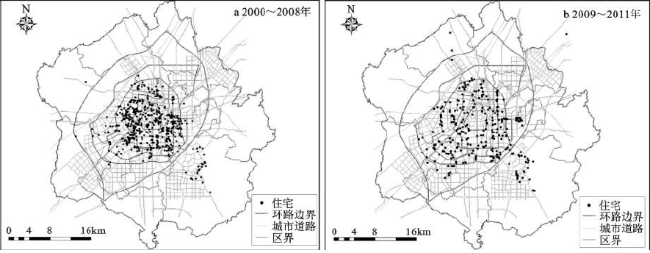
Fig.5 Distribution of new housings in Changchun in 2000-2011图5 长春市2000~2011年新建住宅分布 |
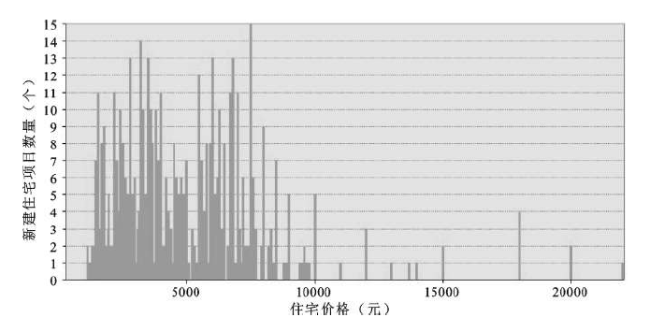
Fig.6 Distribution histogram of housing price图6 住宅价格分布直方图 |
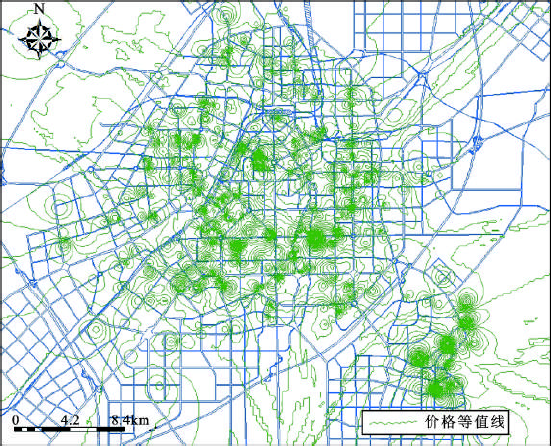
Fig.7 Isoclines chart of housing price in Changchun图7 长春市住宅价格分布等值线图 |
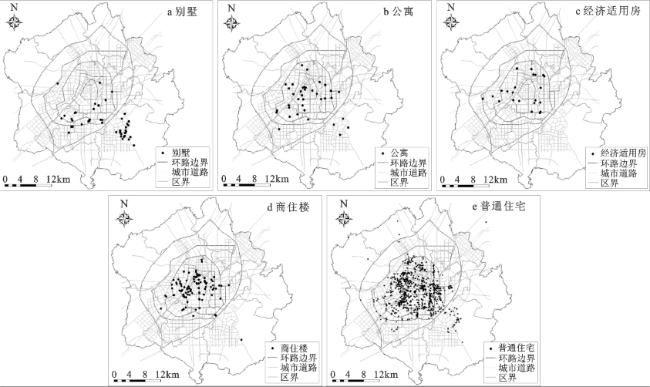
Fig.8 Distribution of houses in different architectural pattern in 2000-2011图8 2000~2011年长春市不同建筑模式住宅区位分布 |
Table 1 Distribution of housing amount in Changchun (in belt way) in 2009-2011表1 2009~2011年长春市住宅数量分布(按环线) |
| 住宅类别 | 一环里 | 一环到二环 | 二环到三环 | 三环到四环 | 四环以外 | 总计 |
|---|---|---|---|---|---|---|
| 普通住宅 | 4 (2.45%) | 33(20.25%) | 68(41.72%) | 28(17.18%) | 30(18.40%) | 163(100.00%) |
| 经济适用房 | 1(100.00%) | 1(100.00%) | ||||
| 公寓 | 3(13.04%) | 5(21.74%) | 6(26.09%) | 3(13.04%) | 6(26.09%) | 23(100.00%) |
| 商住楼 | 5(12.50%) | 16(40.00%) | 14(35.00%) | 3(7.50%) | 2(5.00%) | 40(100.00%) |
| 别墅 | 3(9.09%) | 6(18.18%) | 8(24.24%) | 16(48.48%) | 33(100.00%) | |
| 合计 | 12(4.62%) | 57(21.92%) | 94(36.15%) | 43(16.54%) | 54(20.77%) | 260(100.00%) |
注:括号中数字为各住宅类型比例。 |
Table 2 Remising amount of residential lands in each year in Jingyue development area表2 净月历年居住用地出让量 |
| 年份(年) | 居住用地出让面积(hm2) | 总出让面积(hm2) | 居住用地占总出让面积之比(%) |
|---|---|---|---|
| 2004 | 109.68 | 111.54 | 98.33 |
| 2005 | 247.20 | 247.20 | 100 |
| 2006 | 73.05 | 73.05 | 100 |
| 2007 | 90.17 | 104.78 | 86.06 |
| 2008 | 66.27 | 88.95 | 74.50 |
| 2009 | 76.05 | 84.78 | 89.70 |
注:数据来源于2004~2009年长春市国土资源厅①(① 长春市国土资源厅.长春市土地出让台账. 2004~2009年.) |
The authors have declared that no competing interests exist.
| [1] |
|
| [2] |
|
| [3] |
|
| [4] |
|
| [5] |
|
| [6] |
|
| [7] |
|
| [8] |
|
| [9] |
|
| [10] |
|
| [11] |
|
| [12] |
|
| [13] |
|
| [14] |
|
| [15] |
|
| [16] |
|
/
| 〈 |
|
〉 |