
黄河流域旅游经济的时空分异与R/S分析
作者简介:王开泳(1980-), 男, 山东滕州人,博士, 副研究员,主要从事城市地理学、旅游地理学方面研究。E-mail: wangky@igsnrr.ac.cn
收稿日期: 2012-07-16
要求修回日期: 2013-03-19
网络出版日期: 2013-06-26
基金资助
国家自然科学基金(40901088)资助
The Spatio-temporal Variation of Regional Tourism Economy and R/S Analysis in The Huanghe River Basin
Received date: 2012-07-16
Request revised date: 2013-03-19
Online published: 2013-06-26
Copyright
王开泳 , 张鹏岩 , 丁旭生 . 黄河流域旅游经济的时空分异与R/S分析[J]. 地理科学, 2014 , 34(3) : 295 -301 . DOI: 10.13249/j.cnki.sgs.2014.03.295
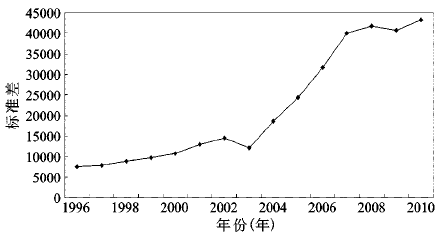
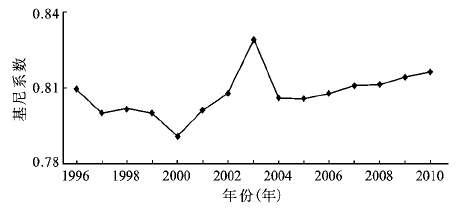
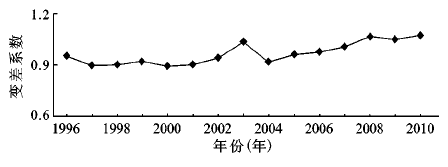
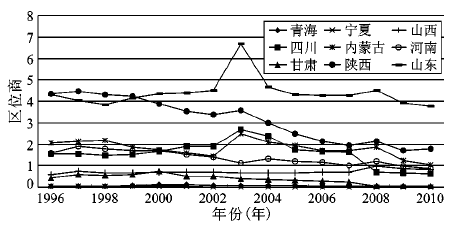
This article focuses on the trend of regional tourism economic disparities of the Huanghe River. Using four indices to evaluate the differences between the 9 provinces,including Standard deviation, Gini coefficient, variation coefficient, and location quotient. On the basis of these indices, the R/S analysis is conducted. The outcome of the analysis shows that the change of absolute difference in regional tourism economy is expanding while the change of relative difference is declining. At the same time, it is also found that Shandong, Shaanxi and Inner Mongolia are always developed province in tourism economy, however, Qinghai, Ningxia and Gansu are underdeveloped in tourism economy from 1996 to 2008. Sichuan Province was once a developing zone in tourism, with the exploration of tourism resources, it is becoming a developed area in the Huanghe River, while Henan is versa. If the tourism continues to develop under this circumstances, the difference of regional tourism economy will be fluctuant in the rising trend. Finally, the article provides some advice to narrow the regional tourism economic gap.
Fig.1 The VOC of inbound tourism in the Huanghe River Basin in 1996-2010图1 1996~2010年黄河流域旅游经济标准差变化 |
Fig.2 The Gini of tourism economy in the Huanghe River Basin图2 黄河流域旅游经济基尼系数变化 |
Fig.3 The VC of tourism economy in the Huanghe River Basin图3 黄河流域旅游经济的变异差系数变化 |
Fig.4 The location quotient of the Huanghe River Basin图4 1996~2008年黄河流域旅游经济区位商 |
Table 1 The result of R/S表1 R/S分析结果(Hurst指数) |
| τ | 3 | 4 | 5 | 6 | 7 | 8 | 9 | 10 | 11 | 12 | 13 | 14 | 15 |
|---|---|---|---|---|---|---|---|---|---|---|---|---|---|
| H | 0.7886 | 0.7580 | 0.4936 | 0.5295 | 0.6734 | 0.6466 | 0.7609 | 0.7489 | 0.7592 | 0.7702 | 0.8029 | 0.7826 | 0.8147 |
| Vn | - | 0.2316 | 0.2674 | 0.2478 | 0.2235 | 0.23189 | 0.2342 | 0.2520 | 0.2018 | 0.2352 | 0.2618 | 0.2352 | 0.2479 |
注:因一次差分和一阶自回归去掉了前2个数据,所以实际计算过程中所用数据为3~15个,Vn是用来检验Hurst稳定性及估计周期循环长度的指标,其公式为[Vn=(R/S)/n]。 |
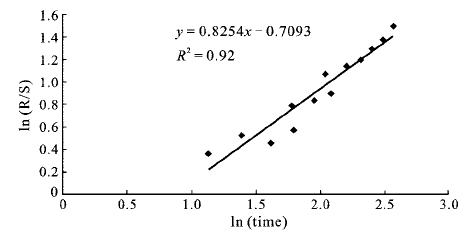
Fig.5 The R/S of Gini coefficient of inbound tourism in the Huanghe River Basin图5 1996~2008年黄河流域入境旅游基尼系数R/S分析 |
Table 2 Stage,character and trend of tourism industry表2 黄河流域各省旅游业发展阶段、特点与趋势 |
| 区域性旅游地 | 旅游景区数量 | 旅游接待饭店 | 代表性旅游吸引物 | 主要产品 类型 | 发展 阶段 | 演化趋势 | ||||||||
|---|---|---|---|---|---|---|---|---|---|---|---|---|---|---|
| 5A | 4A | 3A | 2A | A | 5X | 4X | 3X | 2X | 1X | |||||
| 山东 | 6 | 37 | 61 | 21 | 6 | 24 | 150 | 475 | 244 | 2 | 泰山、明故城、蓬莱阁、 孔府孔庙孔林、海滨 | 观光旅游、 休闲度假 旅游、文化 旅游、商务 会议旅游 | 比较 成熟 阶段 | 文化-旅游、城市-旅游、社区-旅游、环境-旅游的融合 |
| 陕西 | 2 | 21 | 28 | 23 | 0 | 8 | 37 | 148 | 76 | 0 | 黄帝陵、华清池、秦始 皇兵马俑 | |||
| 内蒙古 | 2 | 19 | 27 | 48 | 6 | 7 | 16 | 79 | 126 | 11 | 响沙湾、成吉思汗陵、 格根塔拉草原 | |||
| 河南 | 8 | 55 | 26 | 21 | 0 | 10 | 57 | 192 | 123 | 4 | 云台山、龙门石窟、 少林寺、包公祠 | 观光旅游、 文化旅游 | 发展转 型的成 长阶段 | 旅游产品类型多样化、旅游-城市互动发展 |
| 山西 | 3 | 23 | 1 | 25 | 7 | 9 | 46 | 104 | 96 | 0 | 五台山、云冈石窟、皇 城相府 | |||
| 四川 | 5 | 33 | 17 | 51 | 0 | 16 | 67 | 163 | 143 | 6 | 九寨沟、峨眉山、青 城山-都江堰、巫山 小三峡、大足石刻 | |||
| 青海 | 1 | 9 | 2 | 3 | 0 | 1 | 12 | 46 | 43 | 3 | 青海湖、塔尔寺、藏 药文化博物馆 | 观光旅游、 生态旅游 | 起步 阶段 | 旅游市场开拓、旅游产品深化、旅游接待设施的合理发展 |
| 宁夏 | 3 | 4 | 3 | 8 | 1 | 1 | 10 | 39 | 7 | 0 | 沙坡头、沙湖 | |||
| 甘肃 | 3 | 28 | 7 | 30 | 2 | 3 | 37 | 134 | 123 | 14 | 崆洞山、嘉峪关、麦 积山、三峡 | |||
注:A表示旅游景区,X表示旅游宾馆饭店的星级。表中数据来源于参考文献[10,11,15]。 |
The authors have declared that no competing interests exist.
| [1] |
|
| [2] |
|
| [3] |
|
| [4] |
|
| [5] |
|
| [6] |
|
| [7] |
|
| [8] |
|
| [9] |
中华人民共和国统计局.中国统计年鉴[M].北京:中国统计出版社,1996~2001.
|
| [10] |
中华人民共和国旅游局.中国旅游统计年鉴[M].北京:中国旅游出版社,1996~2001.
|
| [11] |
|
| [12] |
|
| [13] |
|
| [14] |
|
| [15] |
|
| [16] |
|
| [17] |
|
/
| 〈 |
|
〉 |