
基于镇域尺度的江苏省人口分布空间格局演变
作者简介:车冰清(1981-),男,江苏沛县人,博士研究生,实验师,主要从事空间结构与区域发展研究。E-mail:chebingqing@jsnu.edu.cn
收稿日期: 2014-12-22
要求修回日期: 2015-04-30
网络出版日期: 2015-11-20
基金资助
国家自然科学基金项目(41371146、41201160、41501122)资助
Spatio-temporal Changes of Population Distribution at Sub-district Level in Jiangsu Province
Received date: 2014-12-22
Request revised date: 2015-04-30
Online published: 2015-11-20
Copyright
基于2000年、2010年人口普查乡镇(街道)数据,运用探索性空间数据分析、半变异函数等方法,分析江苏省人口分布的时空分异特征,并揭示其空间演化机理。结果表明:① 江苏省人口分布呈现较大的空间差异,全省层面上呈现南北人口密度高于中部的“凹”字型结构,城乡层面上呈现街道人口密度高于乡镇的“城乡二元”结构,以及沿江地区明显的“核心边缘”结构;② 研究期内江苏省人口分布的空间不均衡性和集聚性呈增强之势,长江以北镇域的人口密度大多降低而以南普遍增加,苏锡常、南京、徐州三大都市圈的人口集聚能力进一步提升,沿江地区成为全省规模最大的高密度人口连绵区;③ 空间关联作用是引起江苏省人口分布格局变化的空间机理,而政策、区位、经济与自然环境等因素是造成江苏人口格局变化的主要动力。
车冰清 , 仇方道 . 基于镇域尺度的江苏省人口分布空间格局演变[J]. 地理科学, 2015 , 35(11) : 1381 -1387 . DOI: 10.13249/j.cnki.sgs.2015.011.1381
Since the reform and opening up, the large-scale migration in China has caused dramatic changes in population distribution, which has become a hot research field of human geography. Spatial pattern of population distribution has a typical character of scale dependency. Fine-scale estimation of the population distribution has been a huge challenge in the field of population geography. In China, sub-district is the finest administrative unit in official population census data. Thus, population density data at township level can be used to describe and characterize the population spatial pattern and changes elaborately, and support the optimized layout plan of Chinese population and government policy decision making. Sub-district boundaries across 13 cities in Jiangsu Province had been collected in this study. The national population census data were spatially joined to the boundary layer for population density calculation. Based on the fifth and sixth population censuses, using exploratory spatial data analysis, interpolation methods and semivariogram, the space differentiation and temporal variation of population density of all sub-districts in Jiangsu Province in 2000-2010 are explored, and further, the evolutionary mechanism of it is discussed. The results are reported as follows. In spatial distribution, the population density of Jiangsu Province was characterized by concave shaped structure, urban-rural dual structure, and core-periphery structure. Suzhou-Wuxi-Changzhou metropolitan area had the most widely dense population, and Nanjing City circle had the highest population density. In the evolution, the space differentiation of population density was becoming ever more obvious. Population density in the south of Jiangsu was generally increasing, but most towns’ population density was declining in the northern area. The variation of population density was presented spatial inequality. In evolutionary mechanism, spatial continuity and self-organization of population density have been intensified, and the spatial form of population density changed from decentralization in the initial stage to centralization. Additionally, the structural difference resulted from spatial association has become more and more obvious. The changes of population distribution were influenced mainly by policy and economic factors. First, regional strategies played a guiding role in the population distribution changes. Secondly, economic development reshaped the population distribution, and the population density had a significant positive correlation with economic density. Thirdly, location difference was the determinant. At last but not the least, physical geography difference had also affected the layout in a certain extent. This study expanded the research scale and dimension of the research in population geography research in China. The resulted population density dataset in 2000 and 2010 is expected to enrich the baseline data resources for population geography development in China.
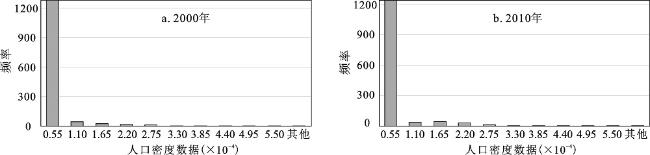
Fig.1 Histogram of population density in Jiangsu Province图1 人口密度 |
Table 1 Prediction errors of semi-variance function models表1 拟合模型的预测误差 |
| 年份 | 验证参数 | 拟合模型 | |||
|---|---|---|---|---|---|
| Stable | Exponential | Spherical | Gaussian | ||
| 2000年 | 均方根 | 2950.18 | 2832.632 | 2992.762 | 3066.236 |
| 标准平均值 | 0.1366004 | 0.1344623 | 0.1326696 | 0.12957 | |
| 标准均方根 | 0.6071783 | 0.6372542 | 0.6187091 | 0.6238103 | |
| 平均标准误差 | 3670.271 | 3395.671 | 3677.142 | 3722.631 | |
| 2010年 | 均方根 | 2797.151 | 2802.023 | 2775.24 | 2862.018 |
| 标准平均值 | 0.1528145 | 0.1600067 | 0.1369406 | 0.1308856 | |
| 标准均方根 | 0.6120949 | 0.5949895 | 0.6113926 | 0.6267969 | |
| 平均标准误差 | 4087.916 | 4272.291 | 4362.84 | 4519.554 | |
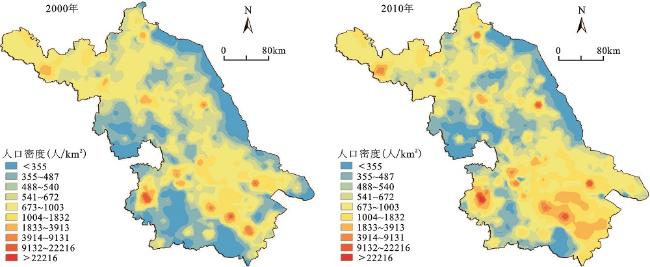
Fig.2 Distribution of population density in Jiangsu Province图2 人口密度的空间分布 |
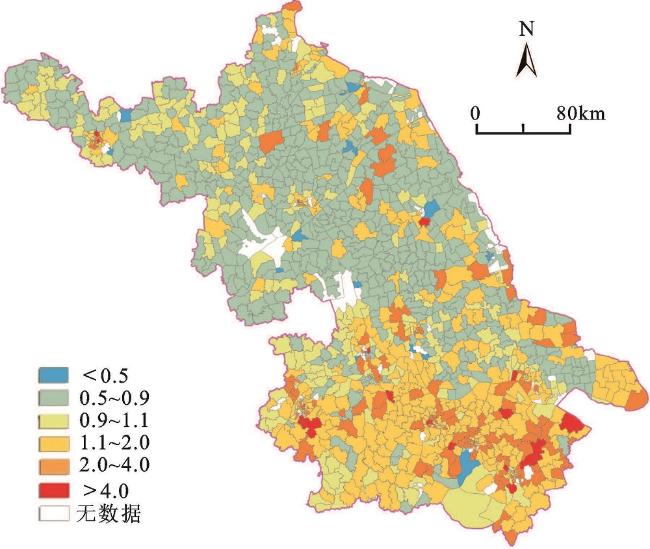
Fig.3 Change of population density in Jiangsu Province in 2000-2010图3 2000~2010年江苏省人口密度变化(人/km2) |
Table 2 Semi-variance function models of population density in Jiangsu Province表2 江苏省人口密度的半变异函数参数值 |
| 年份 | 变程 | 块金值 | 偏基台 | 基台值 | 块金系数 |
|---|---|---|---|---|---|
| 2000年 | 15.1 | 0.021162 | 1.082699 | 1.103861 | 0.0191709 |
| 2010年 | 22.1 | 0.050971 | 1.245648 | 1.296619 | 0.0393107 |
The authors have declared that no competing interests exist.
| [1] |
|
| [2] |
|
| [3] |
|
| [4] |
|
| [5] |
|
| [6] |
|
| [7] |
|
| [8] |
|
| [9] |
|
| [10] |
|
| [11] |
|
| [12] |
|
| [13] |
|
| [14] |
|
| [15] |
|
| [16] |
|
| [17] |
中国科学院可持续发展研究组.中国可持续发展战略报告[M].北京:科学出版社,2000.
|
| [18] |
|
| [19] |
|
| [20] |
|
| [21] |
|
| [22] |
|
| [23] |
|
| [24] |
|
| [25] |
|
| [26] |
|
| [27] |
|
| [28] |
|
| [29] |
|
| [30] |
|
| [31] |
|
| [32] |
|
| [33] |
国家统计局.第五次人口普查乡、镇、街道数据[DB/OL]..
|
| [34] |
国家统计局.中国2010年人口普查分乡、镇、街道资料[M].北京:中国统计出版社,2013.
|
| [35] |
|
| [36] |
|
| [37] |
|
| [38] |
|
/
| 〈 |
|
〉 |