
劳动力成本上升与中国制造业空间转移
作者简介:李伟(1990-),男,山东日照人,博士研究生,主要从事产业发展、演化经济地理学与国际贸易研究。E-mail:xiari.liwei@163.com
收稿日期: 2016-11-14
要求修回日期: 2017-04-23
网络出版日期: 2017-11-20
基金资助
国家杰出青年科学基金项目(41425001)、国家自然科学基金项目(41271130)资助
The Rising Labor Costs and Spatial Restructure of Chinese Manufacturing
Received date: 2016-11-14
Request revised date: 2017-04-23
Online published: 2017-11-20
Supported by
National Science Foundation of China for Distinguished Young Scholars (41425001), National Natural Sciences Foundation of China (41271130).
Copyright
采用中国规模以上工业企业数据,建立面板数据回归模型,研究了劳动力成本上升对制造业空间转移的影响,主要有以下研究结论:① 劳动力成本提升已成为推动中国制造业空间转移的重要影响因素。2004年以前发达地区相对较高的工资水平并未影响到产业集聚,但是2004年以后较高的工资水平开始推动制造业企业向工资水平较低的地区迁移,但出口型企业与满足国内市场需求的制造业企业体现出了不同的转移路线。② 2004年以前中国制造业总体上不断向长三角、珠三角以及山东半岛等地区集中,2004年以后制造业开始向沿海相对较为落后的江苏北部、山东中西部以及中国中西部地区迁移,满足国内市场需求的制造业企业是向中西部地区迁移的主体,出口型企业由长三角和珠三角向东部地区的山东半岛和辽东半岛等交通条件较好的地区迁移。③ 东部地区产业升级缓慢。尽管产业向外转移,但东部沿海地区的产业尤其是满足国内市场需求的制造业企业仍然以劳动力驱动为主,资本驱动的特征并不明显。但出口型企业的发展率先表现出了资本驱动的特征。
李伟 , 贺灿飞 . 劳动力成本上升与中国制造业空间转移[J]. 地理科学, 2017 , 37(9) : 1289 -1299 . DOI: 10.13249/j.cnki.sgs.2017.09.001
The spatial evolution of manufacturing is one of the focuses of economic geographers. Using Chinese industrial enterprises data and panel data regression model, this article investigates the effect of labor market transition on the spatial transfer of Chinese manufacturing. The main conclusions are as follows: firstly, the rising labor cost has becoming a key factor that has an influence on the spatial transfer of Chinese manufacturing. The industrial agglomeration in developed area was not affected by the relatively high labor costs before 2004, but after 2004, the rising labor cost in developed area drove enterprises, no matter export-oriented enterprises or enterprises that served domestic marked, to migrate to relatively less developed areas with relatively low labor costs. Secondly, the flying geese pattern has occurred in China. Before 2004, China's manufacturing continuously agglomerated to the Yangtze River Delta, the Pearl River Delta, Shandong Peninsula and other areas. However, after 2004, the manufacturing enterprises began to migrate to less developed area, such as the northern Jiangsu, the middle and western Shandong and the middle and western regions in China. Enterprises that met the domestic market mainly migrated to the central and western China, while export-oriented enterprises mainly migrated from the Yangtze River Delta and the Pearl River Delta to Shandong Peninsula, Liaodong Peninsula and other areas with convenient transportation. Lastly, the eastern area showed little tendency of industrial upgrading. The development of enterprises, especially enterprises that met domestic market was still labor cost-driven. However, the development of exported-oriented enterprises showed a tendency of capital-driven.
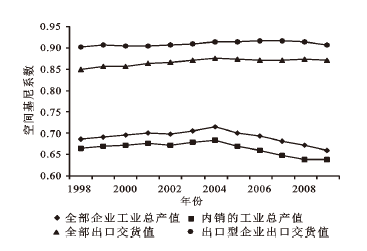
Fig.1 Changes of manufacturings’ spatial Gini coefficient from 1998 to 2009图1 1998~2009年制造业空间基尼系数变化 |
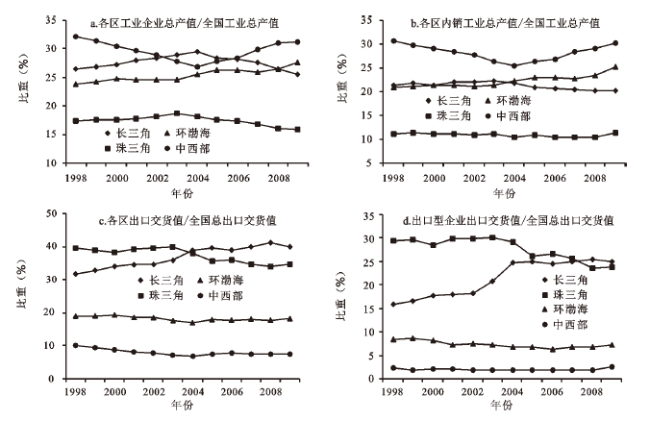
Fig.2 Change of proportion of industry and export at subnational level图2 经济区尺度产业及出口份额变化 |
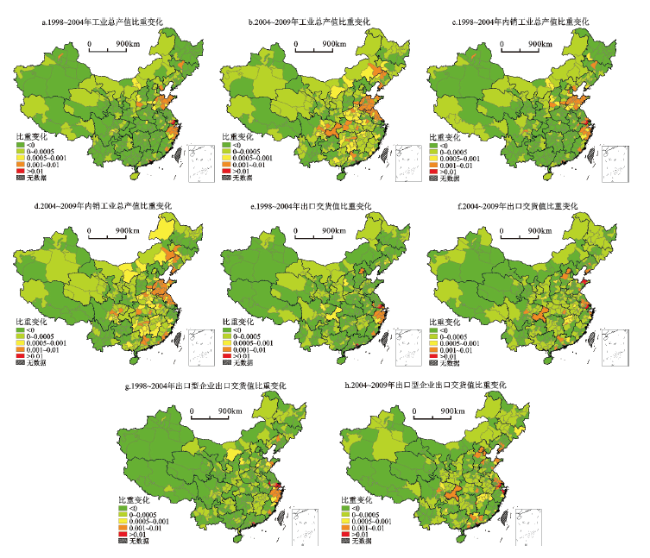
Fig.3 Change of proportion of industry and export at city level图3 城市尺度产业及出口份额变化 |
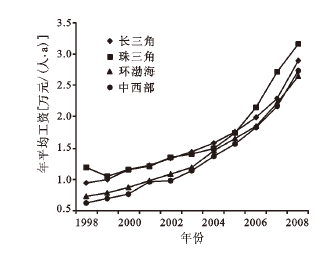
Fig.4 Change of wages at subnational level图4 经济区尺度工资水平变化 |
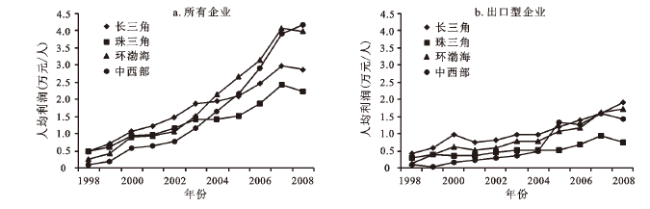
Fig.5 Cost-benefit change of all enterprises and export-oriented enterprises at economic zone level图5 经济区尺度所有企业和出口型企业成本收益分析 |
Table 1 Defination and explanation of variables表1 变量定义与解释 |
| 变量名称 | 符号 | 计算与赋值 |
|---|---|---|
| 因变量 | ||
| 相对工业产出增长率 | Gijt | |
| 自变量 | ||
| 相对工资水平 | Wijt | |
| 相对资本劳动比 | KLijt | |
| 本地产业的绝对规模 | Aijt | |
| 本地产业的专业化水平 | Sijt | |
| 本地产业的多样化水平 | Dijt | |
| 相对企业规模 | Rijt | |
| 相对资产利润率 | Pijt |
注:t代表初始年份,i代表地级行政单元,j代表产业,Y代表工业总产值,L代表从业人员,W代表本年应付工资总额,E代表企业数量,P代表利润总额,A代表总资产。 |
Table 2 Regression results at national level表2 全国尺度上的回归结果 |
| 1999~2003年 | 2004~2008年 | ||||||
|---|---|---|---|---|---|---|---|
| 模型1 G | 模型2 GN | 模型3 GK | 模型4 G | 模型5 GN | 模型6 GK | ||
| W | 0.0189* | 0.0323** | -0.133** | -0.0523*** | -0.0278** | -0.128** | |
| KL | -0.0175 | -0.0297** | 0.0513 | -0.00324 | -0.0234* | 0.116** | |
| A | -0.0900*** | -0.0930*** | -0.203*** | -0.0747*** | -0.111*** | -0.223*** | |
| S | -0.637*** | -0.639*** | -0.344*** | -0.676*** | -0.672*** | -0.322*** | |
| D | -0.151*** | -0.165*** | -0.257*** | -0.295*** | -0.248*** | -0.172* | |
| R | 0.0159 | 0.0371** | 0.109* | 0.0108 | 0.0609*** | 0.0675 | |
| P | 0.0132** | 0.0148** | -0.0242 | 0.0241*** | 0.0137* | -0.00499 | |
| 常数项 | -1.598*** | -1.651*** | -2.387*** | -1.736*** | -2.008*** | -2.453*** | |
| R2 | 0.272 | 0.212 | 0.024 | 0.370 | 0.259 | 0.025 | |
| 样本数 | 27266 | 27136 | 7708 | 32421 | 32185 | 10475 | |
注:*** 、**、*分别表示回归系数在1%、5%和10%的水平下显著。G为相对工业产出增长率;GN为用内销工业总产值计算的相对工业产出增长率;GK为用出口型企业出口交货值计算的相对出口增长率。下表同。 |
Table 3 Regression results of the eastern area in China表3 东部地区回归结果 |
| 1999~2003年 | 2004~2008年 | ||||||
|---|---|---|---|---|---|---|---|
| 模型1 | 模型2 | 模型3 | 模型4 | 模型5 | 模型6 | ||
| G | GN | GK | G | GN | GK | ||
| W | 0.0077 | 0.0294 | -0.179*** | -0.0636*** | -0.00514 | -0.177*** | |
| KL | -0.0714*** | -0.107*** | 0.0824 | -0.0230* | -0.0830*** | 0.0970* | |
| A | -0.146*** | -0.142*** | -0.180** | -0.0927*** | -0.135*** | -0.309*** | |
| S | -0.521*** | -0.499*** | -0.390*** | -0.658*** | -0.664*** | -0.209*** | |
| D | 0.0256 | 0.0209 | -0.254** | -0.294*** | -0.137** | -0.172 | |
| R | -0.019 | -0.0098 | 0.101 | 0.0355** | 0.128*** | 0.0446 | |
| P | 0.00228 | 0.00701 | -0.00593 | 0.0332*** | 0.0152 | -0.0256 | |
| 常数 | -1.623*** | -1.588*** | -2.150*** | -1.872*** | -1.955*** | -3.143*** | |
| R2 | 0.269 | 0.161 | 0.029 | 0.398 | 0.187 | 0.024 | |
| 样本数 | 11446 | 11366 | 5917 | 12919 | 12823 | 7476 | |
注:*** 、**、*分别表示回归系数在1%、5%和10%的水平下显著。 |
Table 4 Regression results of the middle and western area in China表4 中西部地区回归结果 |
| 1999~2003年 | 2004~2008年 | ||||||
|---|---|---|---|---|---|---|---|
| 模型1 | 模型2 | 模型3 | 模型4 | 模型5 | 模型6 | ||
| G | GN | GK | G | GN | GK | ||
| W | 0.0205 | 0.0316* | 0.0143 | -0.0478*** | -0.0385** | -0.0114 | |
| KL | 0.00291 | 0.000885 | -0.0408 | 0.00524 | 0.00339 | 0.127 | |
| A | -0.0619*** | -0.0743*** | -0.260* | -0.0668*** | -0.0962*** | -0.00700 | |
| S | -0.695*** | -0.706*** | -0.190 | -0.684*** | -0.677*** | -0.579*** | |
| D | -0.280*** | -0.299*** | -0.225 | -0.298*** | -0.277*** | -0.233 | |
| R | 0.0428** | 0.0728*** | 0.107 | 0.000463 | 0.0296* | 0.0912 | |
| P | 0.0185*** | 0.0180** | -0.0710* | 0.0202** | 0.0131 | 0.0432 | |
| 常数 | -1.624*** | -1.779*** | -2.972** | -1.676*** | -1.930*** | -0.614 | |
| R2 | 0.277 | 0.244 | 0.015 | 0.361 | 0.311 | 0.031 | |
| 样本数 | 15820 | 15770 | 1791 | 19502 | 19362 | 2999 | |
注:*** 、**、*分别表示回归系数在1%、5%和10%的水平下显著。 |
The authors have declared that no competing interests exist.
| [1] |
[
|
| [2] |
|
| [3] |
|
| [4] |
|
| [5] |
|
| [6] |
|
| [7] |
|
| [8] |
|
| [9] |
|
| [10] |
|
| [11] |
|
| [12] |
|
| [13] |
|
| [14] |
|
| [15] |
[
|
| [16] |
[
|
| [17] |
|
| [18] |
[
|
| [19] |
[
|
| [20] |
[
|
| [21] |
[
|
| [22] |
[
|
| [23] |
[
|
| [24] |
[
|
| [25] |
[
|
| [26] |
[
|
| [27] |
[
|
| [28] |
[
|
| [29] |
|
| [30] |
|
| [31] |
|
| [32] |
[
|
| [33] |
[
|
| [34] |
|
| [35] |
|
| [36] |
宇博智业.中国工业企业数据库[DB/OL].
[
|
| [37] |
|
| [38] |
|
| [39] |
|
/
| 〈 |
|
〉 |