
援藏与西藏自治区经济发展耦合协调分析
作者简介:周春山(1964-),男,河南信阳人,教授,博导,主要从事区域发展与城乡规划、城市地理学研究。E-mail: zhoucs@mail.sysu.edu.cn
收稿日期: 2017-03-02
要求修回日期: 2017-05-09
网络出版日期: 2018-04-10
基金资助
国家自然科学基金项目(41601161)资助
The Coupling and Coordinating Analysis Between Aiding Tibet and Economic Development in Tibet Autonomous Region
Received date: 2017-03-02
Request revised date: 2017-05-09
Online published: 2018-04-10
Supported by
National Natural Science Foundation of China (41601161)
Copyright
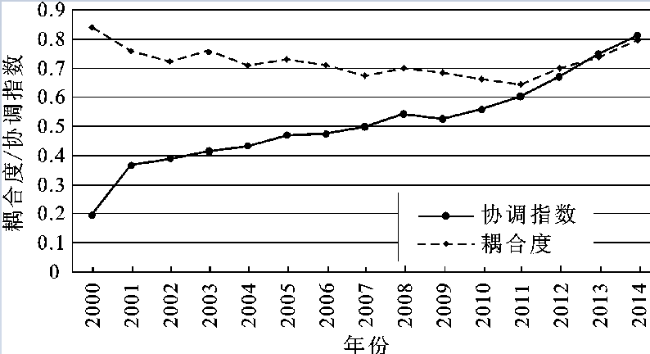
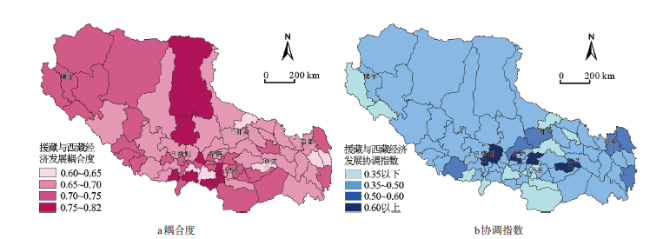
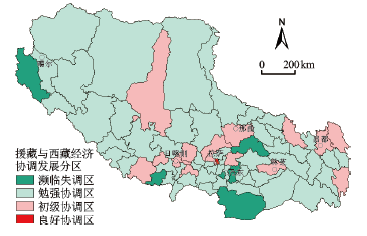
以西藏自治区74个县(市、区)为研究对象,运用灰色关联分析,建立援藏与西藏自治区经济发展耦合关联指标体系,分析了2000~2014年援藏与西藏自治区经济发展各要素之间的关联性;在此基础上,构建耦合度模型与协调指数模型,分析援藏与西藏自治区经济发展的时空耦合协调特征。结果表明:援藏与各县(市、区)的经济发展关联度在0.687~0.750之间,具有较强的正向关联。其中,财政转移支付对自治区经济发展的影响尤为显著,并且援藏在经济实力与乡村经济方面的绩效更为明显;2000年以来,援藏与西藏自治区经济发展耦合度始终处于中度以上水平,协调指数也持续上升,援藏与西藏自治区经济发展逐渐达到高级协调状态;2014年,各县区援藏与经济发展耦合度处于中度以上水平,但协调指数处在中级以下。西藏自治区划分为良好协调、初级协调、勉强协调以及濒临失调4种协调发展区,勉强协调区为主;高海拔及边境地区耦合作用略强于其他地区,但协调指数较低;自然条件好的河谷地区表现出较大的内部差异,高协调指数呈现趋中心性。
周春山 , 余波 , 史晨怡 , 王宇渠 . 援藏与西藏自治区经济发展耦合协调分析[J]. 地理科学, 2018 , 38(2) : 206 -213 . DOI: 10.13249/j.cnki.sgs.2018.02.006
Aiding Tibet has a strong relationship with the economic development in Tibet Autonomous Region, so it is both theoretically and practically necessary to study the coupling and coordinating process over time and space between them when it comes to the relationship between policy and local development and the implementation and perfection of aiding Tibet work. This paper takes 74 counties (cities, districts) of Tibet Autonomous Region as investigated subjects. With the support of gray correlation analysis method, this paper analyzes the correlation and interaction between aiding Tibet and Tibetan economic development during 2000-2014 by establishing an index system for aiding Tibet in terms of five aspects, including fiscal transfer payment, infrastructure, public facilities, favor of loan, construction and installation investment along with Tibetan economic development in terms of four aspects, including economic strength, economic vitality, economic structure and rural economy. Based on the gray correlation analysis, the paper further explores the relationship between aiding Tibet and economic development by establishing the coupling degree model and coordinating index model, focusing on the coupling and coordination process and trends as well as the spatial distribution of coupling index and coordinating index. The results show that: 1) there is strong positive correlation between aiding Tibet and economic development with the correlation degree averaging from 0.687 to 0.750. The impact of financial transfer payment on the economic development is particularly significant, following by the impact of favor of loan, public facilities and infrastructure. Meanwhile, aiding Tibet has more obvious effects on economic strength and rural economy. 2) Since the 21th century, the coordinating index between aiding Tibet and economic development has been showing a rising trend, indicating the gradually coordinating trend with each other. 3) In 2014, the coupling degree of every county (city, district) is above the medium level but the coordinating index is below the medium level. Specifically, higher altitude area and border area have higher coupling degree but lower coordinating index. There exist obvious spatial differences in coupling and coordination indexes inside the Brahmaputra River and its four branches area, with higher coordinating indexes generally tending to the political and economic centers. Based on the coupling degree and coordinating index, the paper also divides Tibet Autonomous Region into four regions: better coordinating region, primary coordinating region, barely coordinating region and little coordinating region. Almost 68.919% of the counties (cities, districts) distribute in the barely coordinating region and only Chengguan district in Lhasa is the better coordinating area. Finally, some suggestion is proposed on aiding Tibet.
Table 1 Indicator system of aiding Tibet and Tibet Autonomous Region economic development表1 援藏与西藏自治区经济发展耦合关联指标体系 |
| 系统层 | 指标层1 | 指标层2 |
|---|---|---|
| 援藏 | 财政转移支付X1 | 财政转移支付X11 |
| 基础设施建设X2 | 公路通车里程X21 | |
| 公共服务设施建设X3 | 学校个数X31、医疗卫生机构床位数X32 各种社会福利收养性单位床位数X33 | |
| 建筑安装工程投资X4 | 建筑安装工程投资额X41 | |
| 金融优惠政策X5 | 金融贷款优惠X51 | |
| 经济发展 | 经济实力Y1 | 第二产业就业人数Y11,第三产业就业人数Y12,全社会固定资产投资Y13 人均GDP Y14,地区生产总值Y15* |
| 经济活力Y2 | GDP增长率Y21,第一产业增长率Y22,第二产业增长率Y23,第三产业增长率Y24,公共财政收入Y25,社会消费品零售总额Y26,年末金融机构各项贷款余额Y27,地方财政支出Y28*,各项税收Y29*,城乡居民储蓄存款余额Y210* | |
| 经济结构Y3 | 第一产业比重Y31,第二产业比重Y32,第三产业比重Y33 | |
| 乡村经济Y4 | 农业增加值Y41,牧业增加值Y42 |
注:*表示被删减或合并的指标。 |
Table 2 The matrix of correlation between Tibet aiding and economic development表2 援藏与西藏自治区经济发展灰色关联度矩阵 |
| X1(0.7500) | X2(0.6987) | X3(0.7242) | X4(0.6872) | X5(0.7407) | |||||
|---|---|---|---|---|---|---|---|---|---|
| X31 | X32 | X33 | |||||||
| Y1(0.8115) | Y11 | 0.8636 | 0.8024 | 0.7758 | 0.8593 | 0.7418 | 0.7032 | 0.8038 | 0.7928 |
| Y12 | 0.8239 | 0.8327 | 0.7620 | 0.8135 | 0.7093 | 0.6792 | 0.7653 | 0.7694 | |
| Y13 | 0.9167 | 0.7585 | 0.8317 | 0.9007 | 0.7810 | 0.7401 | 0.8528 | 0.8259 | |
| Y14 | 0.9017 | 0.6778 | 0.8838 | 0.8766 | 0.8700 | 0.8167 | 0.9776 | 0.8577 | |
| Y2(0.7087) | Y21 | 0.5877 | 0.6198 | 0.5648 | 0.6173 | 0.5759 | 0.5705 | 0.5920 | 0.5897 |
| Y22 | 0.6352 | 0.6728 | 0.5712 | 0.6347 | 0.5844 | 0.5367 | 0.6020 | 0.6053 | |
| Y23 | 0.6630 | 0.6501 | 0.6108 | 0.6753 | 0.6111 | 0.6105 | 0.6691 | 0.6414 | |
| Y24 | 0.5832 | 0.5579 | 0.6068 | 0.6028 | 0.6166 | 0.6076 | 0.6293 | 0.6006 | |
| Y25 | 0.8423 | 0.6426 | 0.8991 | 0.8455 | 0.9512 | 0.8799 | 0.8884 | 0.8499 | |
| Y26 | 0.9287 | 0.6867 | 0.8574 | 0.9101 | 0.8720 | 0.8160 | 0.9384 | 0.8585 | |
| Y27 | 0.7837 | 0.5990 | 0.8400 | 0.7726 | 0.8906 | 0.9999 | 0.8240 | 0.8157 | |
| Y3(0.5927) | Y31 | 0.5235 | 0.5510 | 0.5757 | 0.5123 | 0.5349 | 0.5663 | 0.5567 | 0.5458 |
| Y32 | 0.7067 | 0.8571 | 0.6667 | 0.7221 | 0.6359 | 0.6080 | 0.6726 | 0.6956 | |
| Y33 | 0.5554 | 0.6442 | 0.5100 | 0.5412 | 0.5066 | 0.4801 | 0.5187 | 0.5366 | |
| Y4(0.7780) | Y41 | 0.7760 | 0.8542 | 0.7069 | 0.7797 | 0.6876 | 0.6451 | 0.7137 | 0.7376 |
| Y42 | 0.9094 | 0.7726 | 0.8284 | 0.8610 | 0.7754 | 0.7351 | 0.8474 | 0.8185 | |
| 0.7500 | 0.6987 | 0.7182 | 0.7453 | 0.7090 | 0.6872 | 0.7407 | 0.7213 | ||
注:括号内为二级指标关联度的平均值。 |
Fig.1 Trends of coupling and coordination index of Tibet aiding and economic development图1 援藏与西藏自治区经济发展耦合度与协调指数变化 |
Fig.2 Spatial distribution of coupling and coordinating value of aiding Tibet and economic development in 2014图2 2014年援藏与经济发展耦合度及协调指数空间分布 |
Fig.3 Spatial distribution of four types of coordinating areas of aiding Tibet and economic development in 2014图3 2014年援藏与经济发展协调发展类型分区 |
The authors have declared that no competing interests exist.
| [1] |
[
|
| [2] |
[
|
| [3] |
[
|
| [4] |
[
|
| [5] |
[
|
| [6] |
[
|
| [7] |
[
|
| [8] |
[
|
| [9] |
[
|
| [10] |
[
|
| [11] |
[
|
| [12] |
[
|
| [13] |
[
|
| [14] |
[
|
/
| 〈 |
|
〉 |