
基于土壤理化性质估计土壤水分特征曲线Van Genuchten模型参数
作者简介:李爽(1990-),女,辽宁沈阳人,博士研究生,主要研究方向为土壤侵蚀与土地生产力。E-mail: 929122959@qq.com
收稿日期: 2017-06-20
要求修回日期: 2017-09-12
网络出版日期: 2018-07-20
基金资助
国家自然科学基金(41371271)、水利部公益性行业科研专项经费项目 (201501012)资助
Parameter Estimation of Soil Water Retention Curve Based on Soil Physical and Chemical Properties of Van Genuchten Model
Received date: 2017-06-20
Request revised date: 2017-09-12
Online published: 2018-07-20
Supported by
National Natural Science Foundation of China (41371271), the Public Welfare Industry Special Funds for Scientific Research from Ministry of Water Resources (201501012)
Copyright
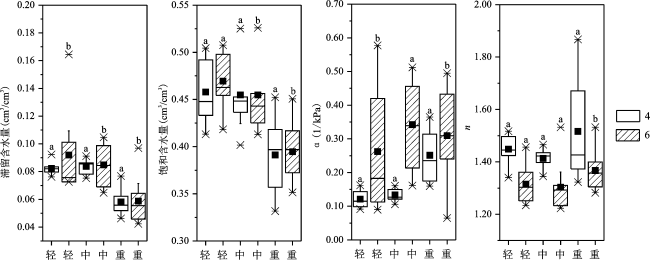
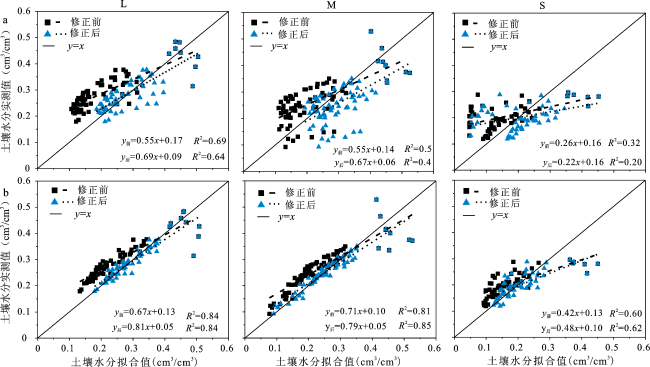
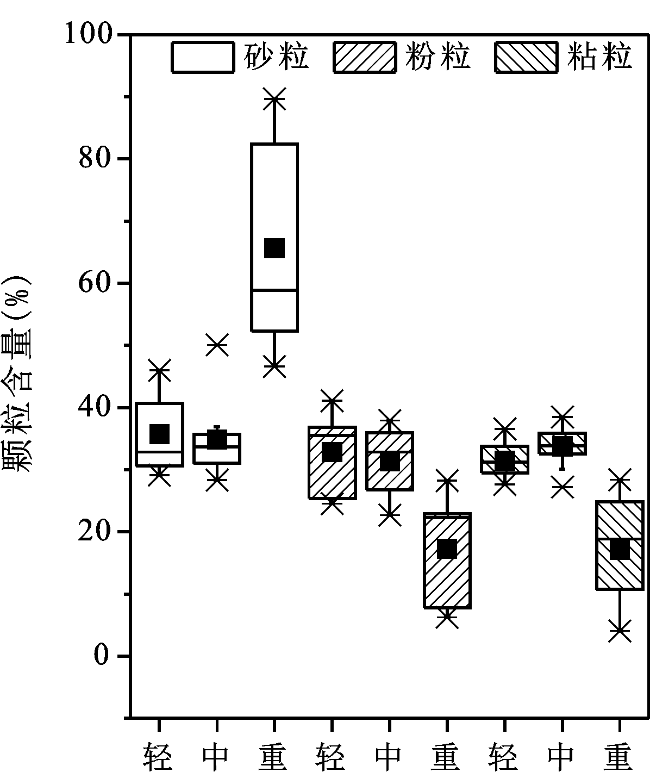
在东北黑土区采集了不同侵蚀强度黑土土样,测定其土壤水分、机械组成、有机质和容重等指标,利用Rosetta模型估计了Van Genuchten模型的参数,并将估算土壤水分与实测土壤水分对比,评价了选择不同土壤理化性质指标的模拟精度,及该方法对东北黑土的适宜性。结果表明:选择4个或6个土壤性质指标,尺度参数(α)和形状参数(n)的差异较大,采用6指标时,α增大,n减小。修正VG模型参数m与n的关系后,模型拟合精度明显提高,其中6指标的计算结果好于4指标,但拟合值偏大,需进一步较正。Rosetta模型适用于砂粒含量小于46%,粘粒含量大于28%的东北黑土。
关键词: 土壤水分特征曲线; 土壤理化性质; 黑土; Rosetta模型; Van Genuchten模型
李爽 , 赵相杰 , 谢云 , 翟俊瑞 , 刘刚 , 高晓飞 , 李晶 , 高燕 . 基于土壤理化性质估计土壤水分特征曲线Van Genuchten模型参数[J]. 地理科学, 2018 , 38(7) : 1189 -1197 . DOI: 10.13249/j.cnki.sgs.2018.07.021
The soil water retention curve (SWRC) is the basic parameter of soil hydraulics to study soil water movement and soil water balance, which is closely related to soil physical and chemical properties. But the parameters of model is difficult to estimate. In this study, black soil samples with different erosion intensity were collected in the black soil region of Northeast China, and soil moisture under 7 soil water suction, mechanical composition, organic matter and bulk density were measured. We used Rosetta model to estimate the parameters of Van Genuchten (VG) model and compared the estimated soil moisture with the measured soil moisture. And then the simulation accuracy of different soil physical and chemical indexes and the suitability of the method to the black soil in Northeast China were evaluated. The results showed that there had little effect for the residual water content (θr) and saturated water content (θs) between 4 or 6 soil properties index, but had large difference for the scale parameter (α) and shape parameter (n). When the 6 indexes were used, shape parameter n decreased with the increased of scale parameter α. The relationship between the shape parameters m and n of the VG model was further modified, which improved the accuracy of model fitting obviously. The results of the 6 indexes were better than the 4 indexes. But the estimated values were different from the measured values and the estimated values were larger than the measured, which means soil moisture estimation need to be corrected according to the estimated value of relatively large degree. The fitting precision of Rosetta model for lightly and moderately erosion black soil was higher, and the precision of severely erosion black soil was lower. The model was suitable for sand content less than 46%, the clay content more than 28% of black soil in Northeast China.
Table 1 The sampling point of different eroded black soils and soil property表1 不同侵蚀强度黑土样地及土壤性质 |
| 侵蚀强度 | 模型处理 | 样点编号 | 黑土层(cm) | 砂粒(%) | 粉粒(%) | 粘粒(%) | ||
|---|---|---|---|---|---|---|---|---|
| 轻度 | 拟合 | L-1 | 30 | 31.93 | 34.06 | 34.01 | ||
| 拟合 | L-2 | 40 | 31.74 | 39.50 | 28.76 | |||
| 拟合 | L-3 | 40 | 43.47 | 24.97 | 31.56 | |||
| 验证 | L-4 | 70 | 32.95 | 34.60 | 32.45 | |||
| 验证 | L-5 | 30 | 35.27 | 37.01 | 27.72 | |||
| 验证 | L-6 | 55 | 30.61 | 36.59 | 32.80 | |||
| 验证 | L-7 | 70 | 26.86 | 39.22 | 33.91 | |||
| 中度 | 拟合 | M-1 | 30 | 31.30 | 35.56 | 33.14 | ||
| 拟合 | M-2 | 25 | 32.43 | 33.48 | 34.08 | |||
| 拟合 | M-3 | 20 | 40.89 | 25.12 | 33.99 | |||
| 验证 | M-4 | 25 | 33.89 | 36.72 | 29.39 | |||
| 验证 | M-5 | 30 | 55.81 | 22.02 | 22.16 | |||
| 重度 | 拟合 | S-1 | 0 | 68.28 | 13.88 | 17.84 | ||
| 拟合 | S-2 | 0 | 75.31 | 12.32 | 12.37 | |||
| 拟合 | S-3 | 28 | 53.33 | 25.50 | 21.17 | |||
注:砂粒(2~0.02 mm),粉粒(0.02~0.002 mm),粘粒(≤0.002 mm)。 |
Fig.1 Parameters of VG model of different eroded black soils图1 不同侵蚀强度黑土VG模型参数 |
Table 2 The mean parameters of VG model of different eroded black soils表2 不同侵蚀强度黑土VG模型参数均值 |
| 侵蚀 强度 | 4指标 | 6指标 | |||||||
|---|---|---|---|---|---|---|---|---|---|
| θr(cm3/cm3) | θs(cm3/cm3) | α(1/kPa) | n | θr(cm3/cm3) | θs(cm3/cm3) | α(1/kPa) | n | ||
| 轻 | 0.08a | 0.46a | 0.12a | 1.45a | 0.09a | 0.47a | 0.26a | 1.31a | |
| 中 | 0.08a | 0.45a | 0.13a | 1.41a | 0.08a | 0.45a | 0.34a | 1.30a | |
| 重 | 0.06b | 0.39b | 0.25a | 1.52a | 0.06b | 0.39b | 0.31b | 1.37a | |
注:上标字母ab不同表示不同侵蚀强度黑土差异显著(P<0.05)。 |
Table 3 The error analysis between fitting and measured of the parameters before and after correction表3 参数修正前后拟合与实测之间误差分析 |
| 侵蚀强度 | 指标个数 | 相对误差(%) | RMSE(cm3/cm3) | 1:1线差异性 | |||||
|---|---|---|---|---|---|---|---|---|---|
| 前 | 后 | 前 | 后 | 前 | 后 | ||||
| 轻 | 4 | 33.15 | 13.13 | 0.11 | 0.05 | 显著 | 显著 | ||
| 6 | 19.72 | 5.77 | 0.06 | 0.03 | 显著 | 显著 | |||
| 中 | 4 | 29.69 | 30.34 | 0.08 | 0.08 | 显著 | 显著 | ||
| 6 | 18.70 | 7.76 | 0.06 | 0.04 | 显著 | 显著 | |||
| 重 | 4 | 37.00 | 37.66 | 0.10 | 0.09 | 显著 | 显著 | ||
| 6 | 25.42 | 15.26 | 0.06 | 0.05 | 显著 | 显著 | |||
Fig.2 The regression relations between simulation and observation data of soil moisture图2 土壤水分拟合与实测回归关系 |
Table 4 The correction of relationship of m and n表4 m与n关系修正 |
| 侵蚀强度 | 修正后方程4 | 4R2 | 修正后方程6 | 6R2 | 与原关系差异性 |
|---|---|---|---|---|---|
| 轻 | m*=0.39(1.07-1/n) | 0.54 | m*=0.53(1.05-1/n) | 0.49 | 显著 |
| 中 | m*=0.73(0.89-1/n) | 0.76 | m*=0.87(0.96-1/n) | 0.75 | 显著 |
| 重 | m*=0.44(1.04-1/n) | 0.70 | m*=0.97(0.93-1/n) | 0.21 | 显著 |
注:*表示修正后方程与原方程差异显著(P<0.05),上标4、6分别表示输入4指标和6指标。 |
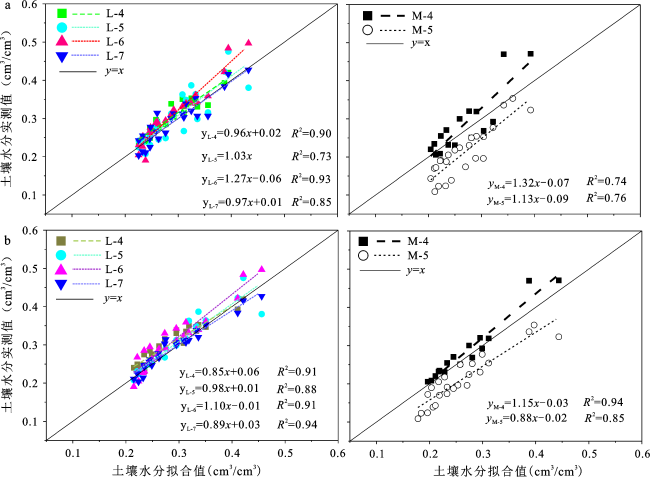
Table 5 The error analysis of the verify plot表5 验证地块误差分析 |
| 侵蚀强度 | 样点 | 相对误差(%) | RMSE(cm3/cm3) | 1:1线差异性 | |||||
|---|---|---|---|---|---|---|---|---|---|
| 4 | 6 | 4 | 6 | 4 | 6 | ||||
| 轻 | L-4 | 6.01 | 7.02 | 0.02 | 0.02 | 不显著 | 显著 | ||
| L-5 | 9.35 | 4.14 | 0.04 | 0.02 | 不显著 | 不显著 | |||
| L-6 | 8.36 | 8.10 | 0.03 | 0.03 | 显著 | 不显著 | |||
| L-7 | 6.78 | 4.37 | 0.02 | 0.02 | 不显著 | 显著 | |||
| 中 | M-4 | 11.22 | 5.91 | 0.05 | 0.02 | 不显著 | 显著 | ||
| M-5 | 33.11 | 26.25 | 0.06 | 0.05 | 显著 | 不显著 | |||
注: 4、6分别表示Rosetta模型输入4和6指标数据。 |
Fig.3 The regression relations between simulation and observation data of the verify plot图3 验证地块拟合与实测水分回归分析 |
Fig.4 The content of sand, silt and clay of the different eroded black soils图4 不同侵蚀强度黑土砂粒、粉粒、粘粒含量 |
The authors have declared that no competing interests exist.
| [1] |
[
|
| [2] |
|
| [3] |
[
|
| [4] |
|
| [5] |
|
| [6] |
|
| [7] |
[
|
| [8] |
|
| [9] |
|
| [10] |
|
| [11] |
[
|
| [12] |
[
|
| [13] |
|
| [14] |
[
|
| [15] |
[
|
| [16] |
[
|
| [17] |
[
|
| [18] |
[
|
| [19] |
[
|
| [20] |
[
|
/
| 〈 |
|
〉 |