
杭州城市人口密度对人居环境感知的影响
|
许婧雪(1994-),女,山西太原人,博士研究生,主要从事城市人居环境、健康城市研究。E-mail: xujx.16b@igsnrr.ac.cn |
收稿日期: 2021-09-12
修回日期: 2021-11-05
网络出版日期: 2022-02-20
基金资助
国家自然科学基金项目(41871170)
国家自然科学基金项目(42071215)
中国科学院战略性先导科技专项(XDA23100302)
北京市属高校高水平教师队伍建设支持计划项目(CIT&TCD201904075)
版权
Impact of Urban Population Density on Perception of Human Settlements in Hangzhou
Received date: 2021-09-12
Revised date: 2021-11-05
Online published: 2022-02-20
Supported by
National Natural Science Foundation of China(41871170)
National Natural Science Foundation of China(42071215)
Strategic Priority Research Program of the Chinese Academy of Sciences(XDA23100302)
Cultivating High Level Teachers in Colleges and Universities in Beijing(CIT&TCD201904075)
Copyright
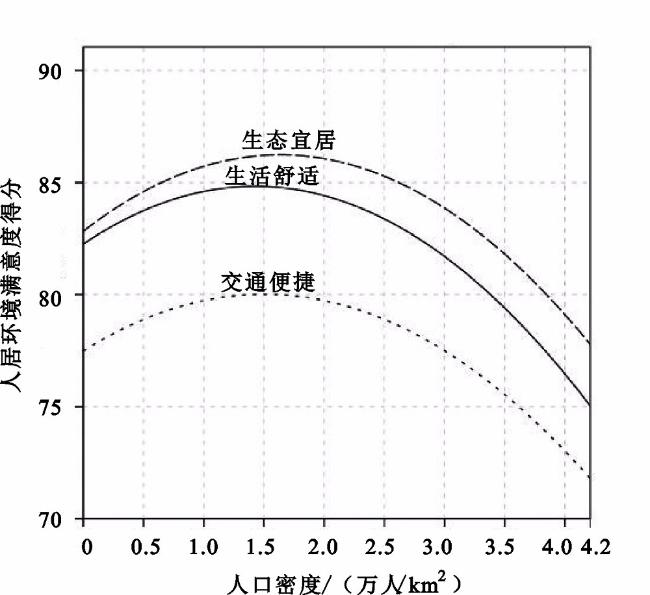
研究人口密度与人居环境感知的非线性关系对于合理控制大城市规模、制定适宜的人口密度控制标准以及寻求城镇化科学发展具有重要的现实意义。以杭州为案例城市,基于2020年住建部“城市体检”社会满意度问卷调查结果和杭州城市建成环境空间数据,利用三阶段逐步回归模型和中介效应检验重点分析了人口密度与居民生态宜居感知、健康舒适感知和交通便捷感知的非线性关系,并分析了人口密度对不同维度人居环境感知的影响路径。研究发现:人口密度与居民生态宜居感知、健康舒适感知和交通便捷感知具有显著的倒U型关联,当人口密度在(1.5~2.0)万人/km2时,居民对这3个维度的感知情况最好;在影响路径方面,人口密度对居民生态宜居感知的影响路径为部分中介,对居民健康舒适感知以及交通便捷感知的影响路径为完全中介。研究不仅可以加深对于紧凑城市理论的理解,还可以为城市体检工作中指标参照值的设置提供科学的参考依据,促进新型城镇化健康有序地发展。
许婧雪 , 张文忠 , 谌丽 . 杭州城市人口密度对人居环境感知的影响[J]. 地理科学, 2022 , 42(2) : 208 -218 . DOI: 10.13249/j.cnki.sgs.2022.02.003
The study of the nonlinear relationship between population density and human settlement environment perception is of great practical significance for the rational control of the size of big cities, the formulation of appropriate population density control standards and the scientific development of urbanization. Taking Hangzhou as a case city, based on the results of the social satisfaction questionnaire of “city health examination” of the Ministry of housing and urban rural development in 2020 and the spatial data of Hangzhou urban built environment, this paper analyzes the nonlinear relationship between population density and residents’ perception of ecological livability, health and comfort, and transportation convenience by using three-stage stepwise regression model and intermediary effect test, It also analyzes the influence path of population density on the perception of human settlements in different dimensions. The results show that: there is a significant inverted U-shaped correlation between population density and residents’ perception of ecological livability, health and comfort, and transportation convenience. When the population density is between 15 000 persons/km2 and 20 000 persons /km2, residents’ perception of these three dimensions is the best; In the aspect of impact path, the impact path of population density on Residents’ perception of ecological livability is partial intermediary, and the impact path of population density on Residents’ perception of health and comfort and traffic convenience is complete intermediary. The research can not only deepen the understanding of compact city theory, but also provide the corresponding decision-making basis for Hangzhou urban planning, and promote the healthy and orderly development of new urbanization.
Key words: city health examination; human settlements; population density; Hangzhou
表1 空间数据说明及问卷调研样本属性统计Table 1 Description of spatial data and statistics of research samples |
| 自变量 | 变量分类(占比) | 自变量 | 测量方式及数据来源 | |
| 注:①中Si为样本点1 km搜索口径内i类POI数量占总POI数量的比重。按照高德地图网站对POI的分类,选取了与居民日常生活密切相关的18.5万个POI。POI分类包括餐饮、风景名胜、公共设施、购物、交通设施、金融、科教文化、商务住宅、生活服务、体育休闲、医疗服务、政府机构及住宿服务。 | ||||
| 个人社会经济属性 | 建成环境 | |||
| 性别 | 男性(48.0%),女性(52.0%) | POI类型的熵指数 | EI=∑Si×ln(1/Si )①,POI数据来源于2019年12月高德地图网站抓取数据 | |
| 年龄 | 30岁以下(26.3%),30~39岁(34.1%),40~49岁(19.3%),50~59岁(12.0%),60岁以上(8.3%) | 人口密度/ (万人/km2) | 以 LandScan 2018全球人口栅格数据为基础,采用GIS 空间分析与数理统计方法对样本点1 km搜索口径内的人口密度进行估算 | |
| 学历 | 初中及以下(10.5%);高中(15.0%),大专(25.9%),大学(45.0%),研究生(3.5%) | 道路交叉口密度/ (个/km2) | 次干道及支路道路交叉口密度,路网数据来源于2018年11月杭州市百度地图路网抓取数据 | |
| 家庭年收入 | 10万元以下(31.4%),10~20万元(32.7%),20~30万元(20.3%),30万元以上(15.6%) | 公园广场密度/ (个/km2) | 公园广场类POI密度,POI数据来源于2019年12月高德地图网站抓取数据 | |
| 户口 | 本地人(84.2%),外地人(15.8%) | 地铁站密度/ (个/km2) | 地铁站点密度,POI数据来源于2019年12月高德地图网站抓取数据 | |
| 公交站密度/ (个/km2) | 公交站点密度,POI数据来源于2019年12月高德地图网站抓取数据 | |||
表2 居民人居环境感知的线性回归结果Table 2 Linear regression results of residents’ perception of human settlements |
| 因变量 (满意度) | 系数(标准误) | 因变量 (满意度) | 系数(标准误) | |||||
| 模型1a | 模型1b | 模型1c | 模型1a | 模型1b | 模型1c | |||
| 注:* P<0.05,**P<0.01,***P<0.001。 | ||||||||
| 建成环境变量 | 50~59岁 | -2.021 | -1.672 | -1.819 | ||||
| 人口密度 | 5.029*** | 3.879** | 1.830* | (-1.954) | (-1.662) | (-1.442) | ||
| (-4.046) | (-3.192) | (-1.209) | 学历(参照组:初中及以下学历) | |||||
| 人口密度的平方项 | -1.590*** | -1.389*** | -0.965* | 大学 | -1.128* | -0.463 | -2.192*** | |
| (-4.396) | (-3.921) | (-2.190) | (-2.103) | (-0.882) | (-3.351) | |||
| POI混合熵 | -2.087 | -1.479 | -1.435 | 研究生及以上 | -4.149** | -3.509** | -8.571*** | |
| (-0.756) | (-0.549) | (-0.425) | (-3.245) | (-2.715) | (-5.500) | |||
| 公园广场密度 | 0.558** | 0.494** | 0.101 | 家庭年收入(参照组:10万元以下) | ||||
| (-1.667) | (-1.510) | (-2.693) | 10~20万元 | -0.507 | -0.534 | -1.069 | ||
| 道路交叉口密度 | 0.002 | 0.016 | 0.019 | (-0.883) | (-0.952) | (-1.527) | ||
| (-0.067) | (-0.575) | (-0.578) | 20~30万元 | 0.214 | 0.648 | -1.406 | ||
| 公共交通站点密度 | -0.220* | -0.187 | 0.099* | (-0.322 | (-0.995 | (-1.733) | ||
| (-2.125) | (-1.848) | (-0.788) | 30万元以上 | -1.482* | -1.023 | -4.288*** | ||
| 个人社会经济属性变量 | (-2.029) | (-1.441) | (-4.844) | |||||
| 性别(参照组:男性) | 户籍(参照组:本地户籍) | |||||||
| 女 | -0.460 | -0.104 | 0.189 | 外地户籍 | -2.904*** | -3.643*** | -3.998*** | |
| (-1.006) | (-0.233) | (-0.34) | (-3.781) | (-4.780) | (-4.247) | |||
| 年龄(参照组:60岁及以上) | 常数 | 91.276*** | 90.154*** | 86.869*** | ||||
| 30岁以及下 | 1.300 | 3.278*** | 2.397* | -15.582 | -15.775 | -12.127 | ||
| -1.357 | -3.510 | -2.047 | R2 | 0.021 | 0.033 | 0.038 | ||
| 30~39岁 | -0.138 | 0.957 | -0.255 | 调整R2 | 0.017 | 0.028 | 0.034 | |
| (-0.147) | -1.051 | (-0.223) | F值 | F=5.128, P=0.000 | F=7.804, P=0.000 | F=9.425, P=0.000 | ||
| 40~49岁 | -2.092* | -1.797 | -2.607* | |||||
| (-2.185) | (-1.938) | (-2.232) | ||||||
表3 人口密度对生态宜居感知的影响路径检验Table 3 Path test of the impact of population density on residents’ ecological livability perception |
| 因变量(满意度) | 模型2a | 模型2b | 模型2c | 模型2d | 模型3a | |
| 公园绿地 | 亲水空间 | 开敞空间 | 建筑密度 | 生态宜居 | ||
| 系数(标准误) | ||||||
| 注:* P<0.05,**P<0.01,***P<0.001;空白为无此项。 | ||||||
| 建成环境变量 | ||||||
| 人口密度 | 2.625* | 4.427*** | 3.590** | 3.831** | 2.108** | |
| (-2.264) | (-3.512) | (-2.877) | (-2.598) | (-2.598) | ||
| 人口密度的平方项 | -1.085** | -1.441*** | -1.261*** | -1.521*** | -0.509* | |
| (-3.215) | (-3.928) | (-3.474) | (-3.544) | (-2.156) | ||
| 其他建成环境变量 | 控制 | 控制 | 控制 | 控制 | 控制 | |
| 中介变量 | ||||||
| 公园绿地 | 0.212*** | |||||
| (-11.343) | ||||||
| 亲水空间 | 0.190*** | |||||
| (-9.968) | ||||||
| 公共开敞空间 | 0.171*** | |||||
| (-8.742) | ||||||
| 建筑密度 | 0.238*** | |||||
| (-17.589) | ||||||
| 个人社会经济属性变量 | 控制 | 控制 | 控制 | 控制 | 控制 | |
| 常数 | 82.948*** | 78.282*** | 84.550*** | 88.061*** | 23.449*** | |
| (-15.179) | (-13.178) | (-14.378) | (-12.672) | (-5.969) | ||
| R2 | 0.020 | 0.026 | 0.026 | 0.029 | 0.585 | |
| 调整R2 | 0.016 | 0.022 | 0.022 | 0.025 | 0.583 | |
| F 值 | F=4.817, P=0.000 | F=6.264, P=0.000 | F=6.258, P=0.000 | F=6.975, P=0.000 | F=271.512, P=0.000 | |
表4 人口密度对健康舒适感知的影响路径检验Table 4 Path test of the impact of population density on residents’ health and comfort perception |
| 因变量(满意度) | 模型2e | 模型2f | 模型2g | 模型2h | 模型2i | 模型2j | 模型3b |
| 综合医院 | 社区卫生 服务中心 | 大型购物 设施 | 社区超市、 便利店等设施 | 体育场地 | 社区道路、 健身器材等维护 | 健康舒适 | |
| 系数(标准误) | |||||||
| 注:* P<0.05,**P<0.01,***P<0.001;空白为无此项。 | |||||||
| 建成环境变量 | |||||||
| 人口密度 | 4.091** | 2.917* | 4.639*** | 2.102** | 4.813** | 4.868*** | 0.420 |
| (-3.014) | (-2.207) | (-3.828) | (-1.678) | (-3.202) | (-3.346) | (-0.657) | |
| 人口密度平方项 | -1.162** | -0.914* | -1.452*** | -0.936 | -1.774*** | -1.772*** | -0.220 |
| (-2.938) | (-2.374) | (-4.111) | (-2.565) | (-4.050) | (-4.181) | (-1.179) | |
| 其他建成环境变量 | 控制 | 控制 | 控制 | 控制 | 控制 | 控制 | 控制 |
| 中介变量 | |||||||
| 综合医院 | 0.154*** | ||||||
| (-12.260) | |||||||
| 社区卫生服务中心 | 0.051*** | ||||||
| (-4.175) | |||||||
| 大型购物设施 | 0.176*** | ||||||
| (-12.120) | |||||||
| 社区超市、便利店等设施 | 0.149*** | ||||||
| (-11.45) | |||||||
| 体育场地 | 0.133*** | ||||||
| (-8.858) | |||||||
| 社区道路、健身器材等维护 | 0.217*** | ||||||
| (-17.590) | |||||||
| 个人属性变量 | 控制 | 控制 | 控制 | 控制 | 控制 | 控制 | 控制 |
| 常数 | 92.417*** | 87.631*** | 89.250*** | 84.441*** | 92.394*** | 86.282*** | 12.575*** |
| (-14.470) | (-14.100) | (-15.660) | (-14.330) | (-13.070) | (-12.610) | (-4.060) | |
| R2 | 0.040 | 0.035 | 0.037 | 0.040 | 0.036 | 0.041 | 0.735 |
| 调整R2 | 0.036 | 0.031 | 0.033 | 0.036 | 0.032 | 0.036 | 0.733 |
| F值 | F=9.709, | F=8.362, | F=8.914, | F=9.710, | F=8.660, | F=9.760, | F=478.756, |
| P=0.000 | P=0.000 | P=0.000 | P=0.000 | P=0.000 | P=0.000 | P=0.000 | |
表5 人口密度对交通便捷感知的影响路径检验Table 5 Path test of the impact of population density on residents’ traffic convenience perception |
| 因变量 (满意度) | 模型2k | 模型2l | 模型2m | 模型2n | 模型2o | 模型3c |
| >步行环境 | 骑行环境 | 公共交通出行 | 道路通畅性 | 小汽车停车 | 交通便捷 | |
| 系数(标准误) | ||||||
| 注:* P<0.05,**P<0.01,***P<0.001;空白为无此项。 | ||||||
| 建成环境变量 | ||||||
| 人口密度 | 4.303** | 3.836** | 3.050* | 2.830 | 4.030* | -1.310 |
| (-3.091) | (-2.612) | (-2.211) | (-1.612) | (-2.077) | (-1.704) | |
| 人口密度的平方项 | -1.448*** | -1.425*** | -1.188** | -1.260* | -1.814** | 0.324 |
| (-3.573) | (-3.333) | (-2.958) | (-2.464) | (-3.210) | (-1.446) | |
| 其他建成环境变量 | 控制 | 控制 | 控制 | 控制 | 控制 | 控制 |
| 步行环境 | 0.135*** | |||||
| (-8.639) | ||||||
| 骑行环境 | 0.003 | |||||
| (-0.189) | ||||||
| 公共交通出行 | 0.296*** | |||||
| (-21.490) | ||||||
| 道路通畅性 | 0.235*** | |||||
| (-19.169) | ||||||
| 小汽车停车 | 0.243*** | |||||
| (-24.751) | ||||||
| 个人属性变量 | 控制 | 控制 | 控制 | 控制 | 控制 | 控制 |
| 常数 | 93.049*** | 95.160*** | 84.914*** | 91.270*** | 96.476*** | 3.967 |
| (-14.122) | (-13.687) | (-13.003) | (-10.984) | (-10.504) | (-1.064) | |
| R2 | 0.025 | 0.028 | 0.030 | 0.034 | 0.042 | 0.753 |
| 调整R2 | 0.021 | 0.024 | 0.026 | 0.030 | 0.038 | 0.751 |
| F值 | F=6.188, P=0.000 | F=6.833, P=0.000 | F=7.247, P=0.000 | F=8.443, P=0.000 | F=10.268, P=0.000 | F=563.124, P=0.000 |
| [1] |
韩刚, 袁家冬, 张轩, 等. 紧凑城市空间结构对城市能耗的作用机制——基于江苏省的实证研究[J]. 地理科学, 2019, 39(7): 1147-1154.
Han Gang, Yuan Jiadong, Zhang Xuan et al. The mechanism of compact city spatial structure on energy consumption: An empirical research based on Jiangsu province. Scientia Geographica Sinica, 2019, 39(7): 1147-1154.
|
| [2] |
Elizabeth B. Measuring urban compactness in UK towns and cities[J]. Environment and Planning B:Planning and Design, 2002, 29(2): 219-250.
|
| [3] |
Jabareen Y R. Sustainable urban forms: Their typologies, models, and concepts[J]. Journal of Planning Education and Research, 2006, 26(1): 38-52.
|
| [4] |
Helen G. The environmental advantages of cities: Countering commonsense antiurbanism[J]. Urban Policy and Research, 2016, 34(4): 401-407.
|
| [5] |
Kostas M. Is compact city livable? The impact of compact versus sprawled neighbourhoods on neighbourhood satisfaction[J]. Urban Studies, 2018, 55(11): 2408-2430.
|
| [6] |
马丽, 金凤君. 中国城市化发展的紧凑度评价分析[J]. 地理科学进展, 2011, 30(8): 1014-1020.
Ma Li, Jin Fengjun. Evaluation of Chinese urban compactness. Progress in Geography, 2011, 30(8): 1014-1020.
|
| [7] |
赵鹏军. 土地集约利用对可持续城市交通的作用: 基于国际文献理论分析[J]. 城市发展研究, 2018, 25(9): 108-116.
Zhao Pengjun. Effect of intensive land utilization on sustainable urban traffic: Analysis based on international literature theory. Urban Development Studies, 2018, 25(9): 108-116.
|
| [8] |
史北祥, 西蒙·马尔温, 杨俊宴. 后智慧城市转型背景下高密度城区建成环境的品质提升研究[J]. 国际城市规划, 2021, 36(2): 16-21.
Shi Beixiang, Simon M, Yang Junyan. Study on quality improvement of built environment in high-density urban areas under the background of post smart city transformation. Urban Planning International, 2021, 36(2): 16-21.
|
| [9] |
牛方曲, 孙东琪. 资源环境承载力与中国经济发展可持续性模拟[J]. 地理学报, 2019, 74(12): 2604-2613.
Niu Fangqu, Sun Dongqi. Modelling the sustainability of China’s growth based on the resource and environmental carrying capacity. Acta Geographica Sinica, 2019, 74(12): 2604-2613.
|
| [10] |
王勇, 解延京, 刘荣, 等. 北上广深城市人口预测及其资源配置[J]. 地理学报, 2021, 76(2): 352-366.
Wang Yong, Xie Yanjing, Liu Rong et al. Population prediction and resource allocation in megacities from the optimum population perspective: A case study of Beijing, Shanghai, Guangzhou and Shenzhen. Acta Geographica Sinica, 2021, 76(2): 352-366.
|
| [11] |
张文忠, 许婧雪, 马仁锋, 等. 中国城市高质量发展内涵、现状及发展导向——基于居民调查视角[J]. 城市规划, 2019, 43(11): 13-19.
Zhang Wenzhong, Xu Jingxue, Ma Renfeng et al. Basic connotation, current situation and development orientation of high-quality urban development of Chinese cities: Based on the survey of residents. City Planning Review, 2019, 43(11): 13-19.
|
| [12] |
Ronita B, Kiyo K, Keisuke H. Does compact urban forms relate to good quality of life in high density cities of India? Case of Kolkata[J]. Cities, 2015, 48(4): 55-65.
|
| [13] |
曲衍波, 王霞, 王世磊, 等. 环渤海地区城市规模扩张与质量增长的时空演变及耦合特征[J]. 地理研究, 2021, 40(3): 762-778.
Qu Yanbo, Wang Xia, Wang Shilei et al. Spatio-temporal evolution and coupling characteristics of urban scale expansion and quality growth in Bohai Rim. Geographical Research, 2021, 40(3): 762-778.
|
| [14] |
陈明星, 叶超, 陆大道, 等. 中国特色新型城镇化理论内涵的认知与建构[J]. 地理学报, 2019, 74(4): 633-647.
Chen Mingxing, Ye Chao, Lu Dadao et al. Cognition and construction of the theoretical connotation for new type urbanization with Chinese characteristics. Acta Geographica Sinica, 2019, 74(4): 633-647.
|
| [15] |
Cramer V, Kringlen T E. Quality of life in a city: The effect of population density[J]. Social Indicators Research, 2004, 69(1): 103-116.
|
| [16] |
Mouratidis K. Compact city, urban sprawl, and subjective well-being[J]. Cities, 2019, 92(4): 261-272.
|
| [17] |
Walton D, Murray S J, Thomas J A. Relationships between population density and the perceived quality of neighbourhood[J]. Social Indicators Research, 2008, 89(3): 405-420.
|
| [18] |
Drew J, Dollery B, Kortt M A. Can’t get no satisfaction? The association between community satisfaction and population size for Victoria[J]. Australian Journal of Public Administration, 2016, 75(1): 65-77.
|
| [19] |
党云晓, 余建辉, 张文忠, 等. 环渤海地区城市居住环境满意度评价及影响因素分析[J]. 地理科学进展, 2016, 35(2): 184-194.
Dang Yunxiao, Yu Jianhui, Zhang Wenzhong et al. Satisfaction evaluation of living environment and influencing factors in the Bohai Rim area. Progress in Geography, 2016, 35(2): 184-194.
|
| [20] |
冯健, 林文盛. 苏州老城区衰退邻里居住满意度及影响因素[J]. 地理科学进展, 2017, 36(2): 159-170.
Feng Jian, Lin Wensheng. Residential satisfaction level and influencing factors of declining old town residents in Suzhou. Progress in Geography, 2017, 36(2): 159-170.
|
| [21] |
刘义, 刘于琪, 刘晔, 等. 邻里环境对流动人口主观幸福感的影响——基于广州的实证[J]. 地理科学进展, 2018, 37(7): 986-998.
Liu Yi, Liu Yuqi, Liu Ye et al. Impacts of neighborhood environments on migrants’ subjective wellbeing: A case study of Guangzhou, China. Progress in Geography, 2018, 37(7): 986-998.
|
| [22] |
申悦, 傅行行. 社区主客观特征对社区满意度的影响机理——以上海市郊区为例[J]. 地理科学进展, 2019, 38(5): 686-697.
Shen Yue, Fu Xingxing. Impact of the built environment and perceived neighborhood characteristics on residents’ satisfaction: Evidence from the Shanghai suburbs. Progress in Geography, 2019, 38(5): 686-697.
|
| [23] |
林雄斌, 杨家文. 北美都市区建成环境与公共健康关系的研究述评及其启示[J]. 规划师, 2015, 31(6): 12-19.
Lin Xiongbin, Yang Jiawen. Built environment and public health review and planning in North American metropolitan areas. Planners, 2015, 31(6): 12-19.
|
| [24] |
张文忠, 何炬, 谌丽. 面向高质量发展的中国城市体检方法体系探讨[J]. 地理科学, 2021, 41(1): 1-12.
Zhang Wenzhong, He Ju, Chen Li. Method system of urban physical examination for high quality development in China. Scientia Geographica Sinica, 2021, 41(1): 1-12.
|
| [25] |
韩峰, 李玉双. 产业集聚、公共服务供给与城市规模扩张[J]. 经济研究, 2019, 54(11): 149-164.
Han Feng, Li Yushuang. Industrial agglomeration, public service supply and urban expansion. Economic Research Journal, 2019, 54(11): 149-164.
|
| [26] |
夏怡然, 陆铭. 城市间的“孟母三迁”——公共服务影响劳动力流向的经验研究[J]. 管理世界, 2015(10): 78-90.
Xia Yiran, Lu Ming. "Mengmu Sanqian" among cities: Study on the impact of public service on labor migration[J]. Management World, 2015(10): 78-90.
|
| [27] |
赵可, 徐唐奇, 张安录. 城市用地扩张、规模经济与经济增长质量[J]. 自然资源学报, 2016, 31(3): 390-401.
Zhao Ke, Xu Tangqi, Zhang Anlu. Urban land expansion, scale economy and quality of economic growth. Journal of Natural Resources, 2016, 31(3): 390-401.
|
| [28] |
张庆华. 城市“集聚效应”驱动中国经济高质量发展[J]. 智慧中国, 2019(6): 39-40.
Zhang Qinghua. Urban “agglomeration effect” drives China’s economic development. Wisdom China, 2019(6): 39-40.
|
| [29] |
Travisi C M, Camagni R, Nijkamp P. Impacts of urban sprawl and commuting: A modelling study for Italy[J]. Journal of Transport Geography, 2010, 18(3): 382-392.
|
| [30] |
Rbbel N. Green spaces: An invaluable resource for delivering sustainable urban health[J]. UN Chronicle, 2016, 53(3): 37-39.
|
| [31] |
Hernandez J, Pallagst K, Hammer P. Urban green spaces as a component of an ecosystem functions, services, users, community involvement, initiatives and actions[J]. International Journal of Environmental Sciences & Natural Resources, 2018, 8(1): 550-730.
|
| [32] |
Kondo M C, Fluehr J M, Mckeon T et al. Urban green space and its impact on human health[J]. International Journal of Environmental Research and Public Health, 2018, 15(3): 445
|
| [33] |
Xu J, Wang F, Chen L et al. Perceived urban green and residents’ health in Beijing[J]. SSM-Population Health, 2021, 14(4): 100790
|
| [34] |
修春亮, 魏冶, 王绮. 基于“规模-密度-形态”的大连市城市韧性评估[J]. 地理学报, 2018, 73(12): 2315-2328.
Xiu Chunliang, Wei Ye, Wang Qi. Evaluation of urban resilience of Dalian City based on the perspective of "Size-Density-Morphology". Acta Geographica Sinica, 2018, 73(12): 2315-2328.
|
| [35] |
洪成, 王伟强. 住区密度与居住满意度相关性研究——以上海曹杨新村为例[J]. 上海城市规划, 2021(1): 105-112.
Hong Cheng, Wang Weiqiang. Correlation between residential density and residence satisfaction: A case study of Caoyang new village in Shanghai. Shanghai Urban Planning Review, 2021(1): 105-112.
|
/
| 〈 |
|
〉 |
