
中国城市土地绿色利用效率驱动因素及空间分异
|
卢新海(1965-),男,湖北洪湖人,教授,博导,主要研究方向为土地利用与城市管理。E-mail: xinhailu@163.com |
收稿日期: 2021-04-15
修回日期: 2021-08-05
录用日期: 2021-11-24
网络出版日期: 2022-04-20
基金资助
国家自然科学基金项目(71673096)
国家自然科学基金项目(41901256)
国家自然科学基金项目(42101282)
中央高校基本科研业务费专项基金项目(CCNU20XJ020)
版权
Driving Factors and Spatial Differentiation of the Urban Land Green Use Efficiency in China
Received date: 2021-04-15
Revised date: 2021-08-05
Accepted date: 2021-11-24
Online published: 2022-04-20
Supported by
National Natural Science Foundation of China(71673096)
National Natural Science Foundation of China(41901256)
National Natural Science Foundation of China(42101282)
Fundamental Research Funds for the Central Universities(CCNU20XJ020)
Copyright
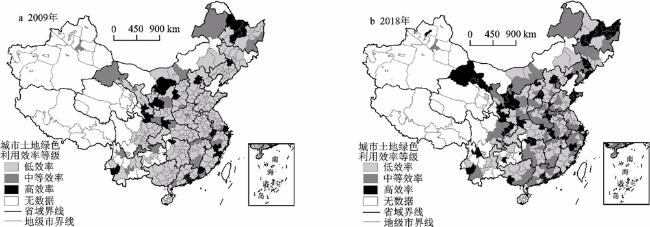
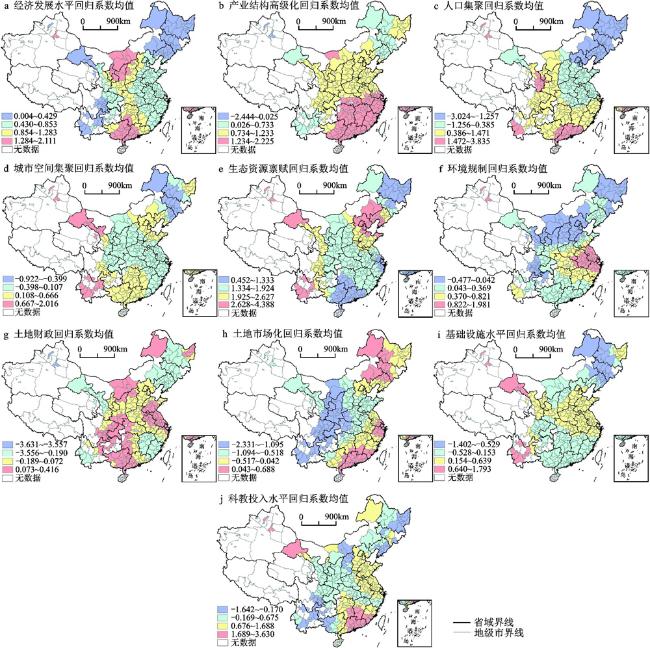
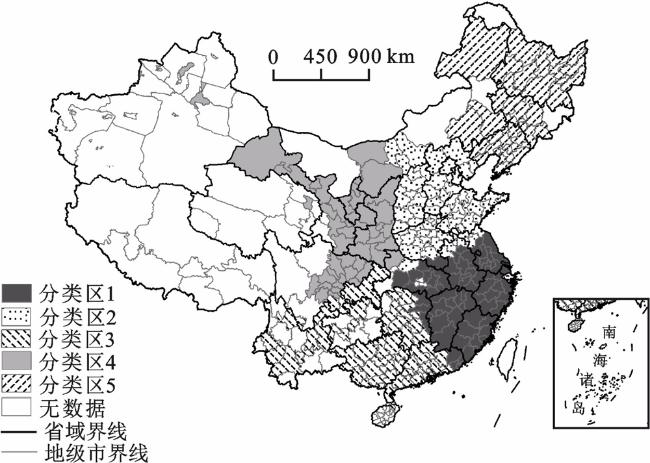
以2009—2018年中国285个地级及以上城市为研究对象,测算各城市的城市土地绿色利用效率,对其驱动因素的空间异质性进行探究与分区。结果表明:① 城市土地绿色利用效率总体呈波动上升趋势,集聚特征显著,省际、省内差异明显;区域上,呈现西部>东部>中部的格局;规模等级上,随着城市规模等级降低而递增。② 城市土地绿色利用效率是众多因素交互驱动的结果,且各驱动因素均具有明显的空间异质性特征,呈现出空间带状或片状分布规律。③ 根据城市土地绿色利用效率驱动因素的空间异质性特征,可划分为产业结构高级化、环境规制和科技投入水平主导的东南地区;生态资源禀赋主导的华北地区;经济发展水平、城市空间集聚主导的西南地区;土地市场化主导的西北地区;人口集聚、土地财政、基础设施水平主导的东北地区。未来应因城施策、因地制宜,采取差异化的措施来提升城市土地绿色利用效率。
关键词: 城市土地绿色利用效率; 非期望超效率SBM; 时空地理加权回归
卢新海 , 李佳 , 刘超 , 匡兵 , 蔡大伟 , 侯娇 . 中国城市土地绿色利用效率驱动因素及空间分异[J]. 地理科学, 2022 , 42(4) : 611 -621 . DOI: 10.13249/j.cnki.sgs.2022.04.006
Improving urban land green use efficiency (ULGUE) is of great significance to achieve new progress in constructing ecological civilization, implementing the goal of peak carbon emissions and the prospect of carbon neutrality, and promoting high-quality economic development. This article first measures the ULGUE in 285 cities in China from 2009 to 2018 by using the undesired super-efficiency SBM model, then, based on the study of driving factors of ULGUE, including high efficiency of economic development, intensive urban development, ecological environment friendly, transparency of government behavior and social development equity, spatial and temporal geographical weighted regression and K-means clustering methods are used to identify and partition the spatial heterogeneity of these influencing factors to provide targeted suggestions on how to improve ULGUE. The research results show that: 1) From 2009 to 2018, ULGUE in 285 cities showed a fluctuating increase, and there are both significant agglomeration characteristics and significant inter-provincial and intra-provincial differences. On the region level, it presents a pattern of western > eastern > central China. On the scale level, it increases with the decline of the scale of the city. 2) ULGUE is interactively driven by many factors, with each influential factor having its apparent spatial heterogeneity, and these factors all show spatial banding or flake distribution pattern. Among these factors, the level of economic development, advanced industrial structure, ecological resource endowment, and environmental regulation have a positive impact on ULGUE; land marketization and land finance mainly play a negative effect; the positive and negative effect of population agglomeration, urban spatial agglomeration, the level of infrastructure, the level of scientific and educational input are all significant. 3) According to the spatial heterogeneity characteristics of ULGUE driving factors, it can be divided into five areas. They are southeast region, which is dominated by advanced industrial structure, environmental regulation, and scientific and technological investment levels; North China dominated by ecological resource endowments; southwest region dominated by economic development level and urban spatial agglomeration; northwest region dominated by land marketization; and northeast regions dominated by population agglomeration, land finance, and infrastructure levels. In the future, differentiated measures should be taken to improve the ULUE according to the city’s strategy and local conditions.
表1 ULGUE驱动因素体系Table 1 Variables of ULGUE driving factors |
表2 2009—2018年分区域、分等级城市ULGUE值Table 2 ULGUE value of cities by region and size in 2009-2018 |
| 区域 | 城市 等级 | 个数 | 年份 | 均值 | ||||||||||||
| 2009 | 2010 | 2011 | 2012 | 2013 | 2014 | 2015 | 2016 | 2017 | 2018 | 年度 | 地区 | 全国 | ||||
| 注:不含西藏、港澳台数据;空白为无此项。 | ||||||||||||||||
| 东部 | 特大 | 19 | 0.604 | 0.612 | 0.665 | 0.683 | 0.679 | 0.710 | 0.615 | 0.717 | 0.755 | 0.742 | 0.678 | 0.580 | 0.564 | |
| 大 | 53 | 0.464 | 0.476 | 0.508 | 0.535 | 0.569 | 0.570 | 0.426 | 0.486 | 0.566 | 0.585 | 0.519 | ||||
| 中 | 24 | 0.509 | 0.510 | 0.534 | 0.575 | 0.684 | 0.653 | 0.567 | 0.609 | 0.680 | 0.656 | 0.598 | ||||
| 小 | 5 | 0.773 | 0.692 | 0.700 | 0.820 | 0.940 | 0.846 | 0.699 | 0.724 | 0.729 | 0.726 | 0.765 | ||||
| 平均值 | 0.516 | 0.520 | 0.553 | 0.586 | 0.636 | 0.630 | 0.508 | 0.570 | 0.637 | 0.638 | ||||||
| 中部 | 特大 | 6 | 0.376 | 0.380 | 0.417 | 0.435 | 0.485 | 0.501 | 0.326 | 0.551 | 0.584 | 0.557 | 0.461 | 0.527 | ||
| 大 | 38 | 0.371 | 0.365 | 0.386 | 0.448 | 0.510 | 0.526 | 0.373 | 0.475 | 0.505 | 0.533 | 0.449 | ||||
| 中 | 42 | 0.459 | 0.475 | 0.505 | 0.551 | 0.609 | 0.579 | 0.532 | 0.562 | 0.656 | 0.641 | 0.557 | ||||
| 小 | 14 | 0.544 | 0.524 | 0.718 | 0.684 | 0.677 | 0.755 | 0.712 | 0.714 | 0.749 | 0.711 | 0.679 | ||||
| 平均值 | 0.432 | 0.435 | 0.484 | 0.523 | 0.573 | 0.579 | 0.484 | 0.549 | 0.607 | 0.604 | ||||||
| 西部 | 特大 | 4 | 0.362 | 0.373 | 0.390 | 0.395 | 0.432 | 0.457 | 0.329 | 0.484 | 0.530 | 0.510 | 0.426 | 0.590 | ||
| 大 | 34 | 0.418 | 0.410 | 0.478 | 0.578 | 0.609 | 0.585 | 0.530 | 0.558 | 0.596 | 0.610 | 0.537 | ||||
| 中 | 23 | 0.436 | 0.421 | 0.500 | 0.506 | 0.584 | 0.581 | 0.410 | 0.517 | 0.587 | 0.551 | 0.509 | ||||
| 小 | 23 | 0.678 | 0.728 | 0.723 | 0.752 | 0.838 | 0.841 | 0.619 | 0.817 | 0.917 | 0.877 | 0.779 | ||||
| 平均值 | 0.491 | 0.498 | 0.547 | 0.597 | 0.656 | 0.648 | 0.512 | 0.614 | 0.678 | 0.662 | ||||||
| 全国 | 285 | 0.480 | 0.484 | 0.527 | 0.567 | 0.620 | 0.617 | 0.501 | 0.576 | 0.639 | 0.633 | |||||
图3 2009—2018年ULGUE影响区划分审图号:GS(2020)4632(自然资源部监制),底图无修改;不含西藏、港澳台数据 Fig. 3 ULGUE impact area division from 2009 to 2018 |
表3 ULGUE驱动因素K均值聚类结果Table 3 K average clustering results of ULGUE's driving factors |
| 驱动因素 | 分类区1 | 分类区2 | 分类区3 | 分类区4 | 分类区5 |
| 注:加黑数值为各驱动因素绝对值的最大值,即该因素为对应分类区的主导因素;不含西藏、港澳台数据。 | |||||
| 经济发展水平 | 0.711 | 0.849 | 1.132 | 0.813 | 0.196 |
| 产业结构高级化 | 1.426 | 0.945 | 1.292 | 0.834 | 0.730 |
| 人口集聚 | 0.490 | –0.468 | 1.521 | 1.195 | –2.328 |
| 城市空间集聚 | –0.019 | 0.071 | 0.302 | 0.226 | –0.132 |
| 生态资源禀赋 | 1.559 | 2.164 | 1.437 | 2.030 | 1.912 |
| 环境规制 | 0.750 | 0.141 | 0.216 | 0.105 | –0.024 |
| 土地财政 | –0.083 | 0.056 | 0.071 | -0.130 | –0.293 |
| 土地市场化 | –0.185 | –0.724 | –0.452 | –1.206 | 0.007 |
| 基础设施水平 | 0.218 | 0.342 | 0.045 | 0.271 | –0.456 |
| 科教投入水平 | 1.081 | 0.575 | 0.846 | 0.415 | 0.036 |
| 城市个数 | 72 | 67 | 59 | 49 | 37 |
| [1] |
卢新海, 杨喜, 陈泽秀. 中国城市土地绿色利用效率测度及其时空演变特征[J]. 中国人口·资源与环境, 2020, 30(8): 83-91.
Lu Xinhai, Yang Xi, Chen Zexiu. Measurement and temporal-spatial evolution characteristics of urban land green use efficiency in China. China Population, Resources and Environment, 2020, 30(8): 83-91.
|
| [2] |
姬志恒, 张鹏. 环境约束下中国城市土地利用效率空间差异及驱动机制——基于285个地级及以上城市的研究[J]. 中国土地科学, 2020, 34(8): 72-79.
Ji Zhiheng, Zhang Peng. Spatial difference and driving mechanism of urban land use efficiency under the environmental constraints: Based on 285 cities in China. China Land Science, 2020, 34(8): 72-79.
|
| [3] |
胡碧霞, 李菁, 匡兵. 绿色发展理念下城市土地利用效率差异的演进特征及影响因素[J]. 经济地理, 2018, 38(12): 183-189.
Hu Bixia, Li Jing, Kuang Bing. Evolution characteristics and influencing factors of urban land use efficiency difference under the concept of green development. Economic Geography, 2018, 38(12): 183-189.
|
| [4] |
王德起, 庞晓庆. 京津冀城市群绿色土地利用效率研究[J]. 中国人口·资源与环境, 2019, 29(4): 68-76.
Wang Deqi, Pang Xiaoqing. Research on green land-use efficiency of Beijing-Tianjin-Hebei Urban Agglomeration. China Population, Resources and Environment, 2019, 29(4): 68-76.
|
| [5] |
梁流涛, 雍雅君, 袁晨光. 城市土地绿色利用效率测度及其空间分异特征——基于284个地级以上城市的实证研究[J]. 中国土地科学, 2019, 33(6): 80-87.
Liang Liutao, Yong Yajun, Yuan Chenguang. Measurement of urban land green use efficiency and its spatial differentiation characteristics: An empirical study based on 284 cities. China Land Science, 2019, 33(6): 80-87.
|
| [6] |
樊鹏飞, 冯淑怡, 苏敏, 等. 基于非期望产出的不同职能城市土地利用效率分异及驱动因素探究[J]. 资源科学, 2018, 40(5): 946-957.
Fan Pengfei, Feng Shuyi, Su Min et al. Differential characteristics and driving factors of land use efficiency in different functional cities based on undesirable outputs. Resource Science, 2018, 40(5): 946-957.
|
| [7] |
张英浩, 陈江龙, 高金龙, 等. 经济转型视角下长三角城市土地利用效率影响机制[J]. 自然资源学报, 2019, 34(6): 1157-1170.
Zhang Yinghao, Chen Jianglong, Gao Jinlong et al. The impact mechanism of urban land use efficiency in the Yangtze River Delta from the perspective of economic transition. Journal of Natural Resources, 2019, 34(6): 1157-1170.
|
| [8] |
王海军, 张彬, 刘耀林, 等. 基于重心-GTWR模型的京津冀城市群城镇扩展格局与驱动力多维解析[J]. 地理学报, 2018, 73(6): 1076-1092.
Wang Haijun, Zhang Bin, Liu Yaolin et al. Multi-dimensional analysis of urban expansion patterns and their driving forces based on the center of gravity-GTWR model: A case study of the Beijing-Tianjin-Hebei urban agglomeration. Acta Geographica Sinica, 2018, 73(6): 1076-1092.
|
| [9] |
郭付友, 佟连军, 仇方道, 等. 黄河流域生态经济走廊绿色发展时空分异特征与影响因素识别[J]. 地理学报, 2021, 76(3): 726-739.
Guo Fuyou, Tong Lianjun, Qiu Fangdao et al. Spatio-temporal differentiation characteristics and influencing factors of green development in the eco-economic corridor of the Yellow River Basin. Acta Geographica Sinica, 2021, 76(3): 726-739.
|
| [10] |
任嘉敏, 马延吉. 地理学视角下绿色发展研究进展与展望[J]. 地理科学进展, 2020, 39(7): 1196-1209.
Ren Jiamin, Ma Yanji. Research progress and prospects of green development from the perspective of geography. Progress in Geography, 2020, 39(7): 1196-1209.
|
| [11] |
姜磊, 周海峰, 柏玲. 外商直接投资对空气污染影响的空间异质性分析——以中国150个城市空气质量指数(AQI)为例[J]. 地理科学, 2018, 38(3): 351-360.
Jiang Lei, Zhou Haifeng, Bai Ling. Spatial heterogeneity analysis of impacts of foreign direct investment on air pollution: Empirical evidence from 150 cities in China based on AQI. Scientia Geographica Sinica, 2018, 38(3): 351-360.
|
| [12] |
Zhang R, Matsushima K, Kobayashi K. Can land use planning help mitigate transport-related carbon emissions? A case of Changzhou[J]. Land Use Policy, 2018, 74: 32-40.
|
| [13] |
陈大峰, 闫周府, 王文鹏. 城市人口规模、产业集聚模式与城市创新——来自271个地级及以上城市的经验证据[J]. 中国人口科学, 2020(5): 27-40+126.
Chen Dafeng, Yan Zhoufu, Wang Wenpeng. Urban population, industrial agglomeration pattern and urban innovation: Evidence from 271 cities in China. Chinese Journal of Population Science, 2020(5): 27-40+126.
|
| [14] |
成超男, 胡杨, 赵鸣. 城市绿色空间格局时空演变及其生态系统服务评价的研究进展与展望[J]. 地理科学进展, 2020, 39(10): 1770-1782.
Cheng Chaonan, Hu Yang, Zhao Ming. Progress and prospect of the spatiotemporal change and ecosystem services evaluation of urban green space pattern. Progress in Geography, 2020, 39(10): 1770-1782.
|
| [15] |
吴磊, 贾晓燕, 吴超, 等. 异质型环境规制对中国绿色全要素生产率影响研究[J]. 中国人口·资源与环境, 2020(10): 82-92.
Wu Lei, Jia Xiaoyan, Wu Chao et al. Impact of heterogeneous environmental regulation on green total factors productivity. China Population, Resources and Environment, 2020(10): 82-92.
|
| [16] |
范建双, 周琳, 虞晓芬. 土地财政和土地市场发育对城市房价的影响[J]. 地理科学, 2021, 41(5): 863-871.
Fan Jianshuang, Zhou Lin, Yu Xiaofen. Impact of land finance and land market development on urban housing price. Scientia Geographica Sinica, 2021, 41(5): 863-871.
|
| [17] |
李汝资, 刘耀彬, 王文刚, 等. 中国城市土地财政扩张及对经济效率影响路径[J]. 地理学报, 2020, 75(10): 2126-2145.
Li Ruzi, Liu Yaobin, Wang Wengang et al. China’s urban land finance expansion and the transmission routes to economic efficiency. Acta Geographica Sinica, 2020, 75(10): 2126-2145.
|
| [18] |
赵林, 刘焱序, 曹乃刚, 等. 中国包容性绿色效率时空格局与溢出效应分析[J]. 地理科学进展, 2021, 40(3): 382-396.
Zhao Lin, Liu Yanxu, Cao Naigang et al. Spatiotemporal pattern and spillover effects of inclusive green efficiency in China. Progress in Geography, 2021, 40(3): 382-396.
|
| [19] |
Tone K. A slacks-based measure of super-efficiency in data envelopment analysis[J]. European Journal of Operational Research, 2002(1): 32-41.
|
| [20] |
Tone K. Dealing with undesirable outputs in DEA: A slacks based measure (SBM) approach[J]. Grips Research Report Series, 2003(8): 44-45.
|
| [21] |
Brunsdon C, Fotheringham A S, Charlton M E. Geographically weighted regression: A method for exploring spatial nonstationarity[J]. Geographical Analysis, 1996, 28(4): 281-298.
|
| [22] |
Huang B, Wu B, Barry M. Geographically and temporally weighted regression for modeling spatio-temporal variation in house prices[J]. International Journal of Geographical Information Science, 2010, 24(3): 383-401.
|
| [23] |
尹鹏, 王富喜, 段佩利. 中国基本公共服务效率与城镇化质量的时空耦合关系研究[J]. 地理科学, 2020, 40(2): 272-288.
Yin Peng, Wang Fuxi, Duan Peili. Spatial-temporal coupling relationship between basic public service efficiency and urbanization quality in China. Scientia Geographica Sinica, 2020, 40(2): 272-288.
|
| [24] |
徐升艳, 陈杰, 赵刚. 土地出让市场化如何促进经济增长[J]. 中国工业经济, 2018(3): 44-61.
Xu Shengyan Chen Jie, Zhao Gang. How does the land leasing marketization affect the economic growth. China Industrial Economics, 2018(3): 44-61.
|
| [25] |
徐丽婷, 姚士谋, 陈爽, 等. 高质量发展下的生态城市评价——以长江三角洲城市群为例[J]. 地理科学, 2019, 39(8): 1228-1237.
Xu Liting, Yao Shimou, Chen Shuang et al. Evaluation of eco-city under the concept of high-quality development: A case study of the Yangtze River Delta Urban Agglomeration. Scientia Geographica Sinica, 2019, 39(8): 1228-1237.
|
| [26] |
国家统计局. 中国城市统计年鉴[M]. 北京: 中国统计出版社, 2010-2019.
National Bureau of Statistics. China city statistical yearbook. Beijing: China Statistics Press, 2010-2019.
|
| [27] |
自然资源部. 中国国土资源统计年鉴(2004-2018)[M]. 北京: 地质出版社, 2004-2018.
Ministry of Natural Resources. China land and resources statistical yearbook (2004-2018). Beijing: Geological Publishing House, 2004-2018.
|
| [28] |
王磊, 李黎. 资源型产业生态化发展影响因素研究——以新疆为例[J]. 经济管理, 2016, 38(2): 34-46.
Wang Lei, Li Li. Study on influence factors of the resource-based industry ecological development—Take Xinjiang for example. Business Management Journal, 2016, 38(2): 34-46.
|
| [29] |
李雨潼. 中国东北地区人口发展研究[M]. 北京: 社会科学文献出版社, 2018.
Li Yutong. Population development research in northeast China. Beijing: Social Sciences Academic Press, 2018.
|
| [30] |
宋洋, 朱道林, Yeung Godfrey, 等. 收缩情境下城市用地结构时空格局演变及动力机制——以中国东北地区为例[J]. 地理研究, 2021, 40(5): 1387-1403.
Song Yang, Zhu Daolin, Yeung Godfrey et al. Spatio-temporal evolution and driving mechanism of urban land use structure with the context of urban shrinkage: Evidence from Northeast China. Geographical Research, 2021, 40(5): 1387-1403.
|
| [31] |
包国宪, 关斌. 财政压力会降低地方政府环境治理效率吗——一个被调节的中介模型[J]. 中国人口·资源与环境, 2019, 29(4): 38-48.
Bao Guoxian, Guan Bin. Does fiscal pressure reduce the environmental governance efficiency of local governments: A moderated mediationg model. China Population, Resources and Environment, 2019, 29(4): 38-48.
|
| [32] |
Kumar A, Nikhil K. Environmental impact assessment study of non-metal mines: A critical review[J]. International Journal of Engineering and Technical Research, 2014, 2(5): 324-326.
|
| [33] |
王岳龙, 邹秀清. 土地出让: 以地生财还是招商引资——基于居住-工业用地价格剪刀差的视角[J]. 经济评论, 2016(5): 68-82.
Wang Yuelong, Zou Xiuqin. Land transfer in China: To obtain land revenue or attract business and investment?. Economic Review, 2016(5): 68-82.
|
| [34] |
车德欣, 吴传清, 任晓怡, 等. 财政科技支出如何影响企业技术创新?——异质性特征、宏微观机制与政府激励结构破解[J]. 中国软科学, 2020(3): 171-182.
Che Dexin, Wu Chuanqing, Ren Xiaoyi et al. How does fiscal technology expenditure affect enterprise technology innovation?—Heterogeneity, macro-micro mechanism and government incentive structure. China Soft Science, 2020(3): 171-182.
|
/
| 〈 |
|
〉 |