
国家重点生态功能区生态系统服务时空格局及其变化特征
作者简介:刘璐璐(1988-)女,山东济宁人,博士,讲师,主要研究方向为生态系统服务评估。E-mail: liull.11s@igsnrr.ac.cn
收稿日期: 2017-08-20
要求修回日期: 2017-12-28
网络出版日期: 2018-09-10
基金资助
国家重点研发计划项目(2017YFC0506404)、国家自然科学基金项目(41501117,41571504) 资助
Temporal and Spatial Variations of Ecosystem Services in National Key Ecological Function Zones
Received date: 2017-08-20
Request revised date: 2017-12-28
Online published: 2018-09-10
Supported by
National Key R&D Program of China (2017YFC0506404), National Natural Science Foundation of China (41501117,41571504).
Copyright
基于遥感数据及地理信息系统平台,利用生态模型,定量分析中国国家重点生态功能区在实施转移支付前(2000~2010年)、后(2010~2015年)生态系统宏观格局及关键生态系统服务的时空分布格局及其变化特征。研究结果表明:在气候变化与转移支付政策的共同影响下,中国国家重点生态功能区生态系统宏观结构总体好转,荒漠化得到有效控制,水体与湿地得到有效恢复,但森林及草地生态系统发生退化,农田与聚落生态系统面积进一步扩大;水土流失及土壤风蚀得到有效遏制,水源涵养及土壤保持服务得到大幅提升,但防风固沙服务整体有所下降,同时人类活动对生物多样性维护功能的威胁程度基本持衡。
刘璐璐 , 曹巍 , 吴丹 , 黄麟 . 国家重点生态功能区生态系统服务时空格局及其变化特征[J]. 地理科学, 2018 , 38(9) : 1508 -1515 . DOI: 10.13249/j.cnki.sgs.2018.09.014
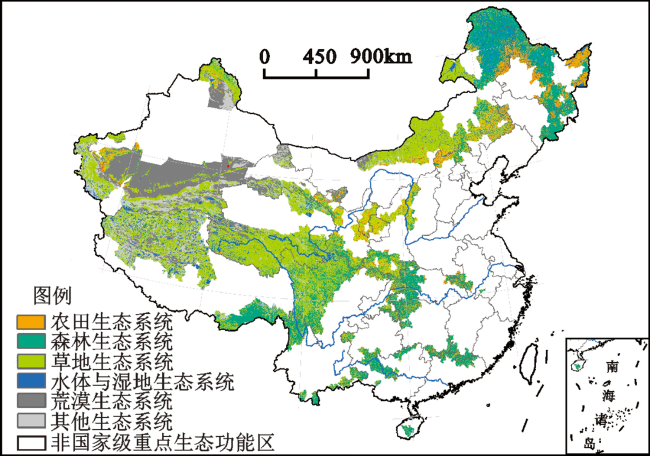
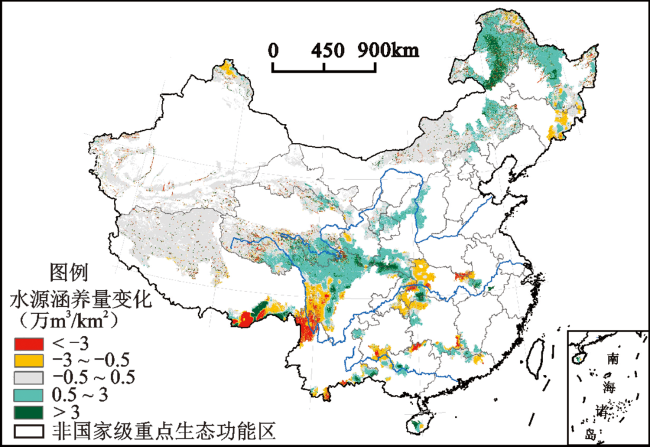
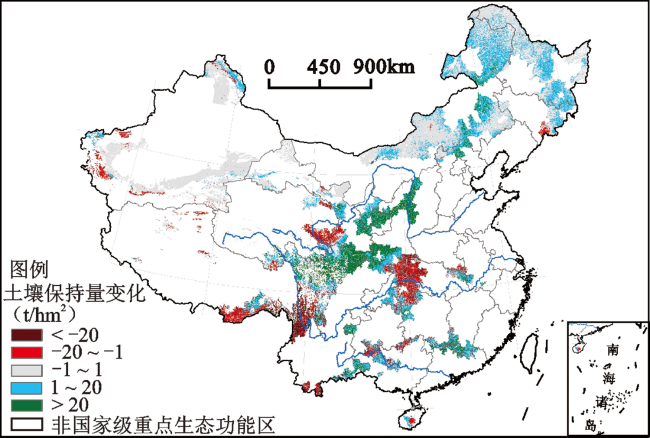
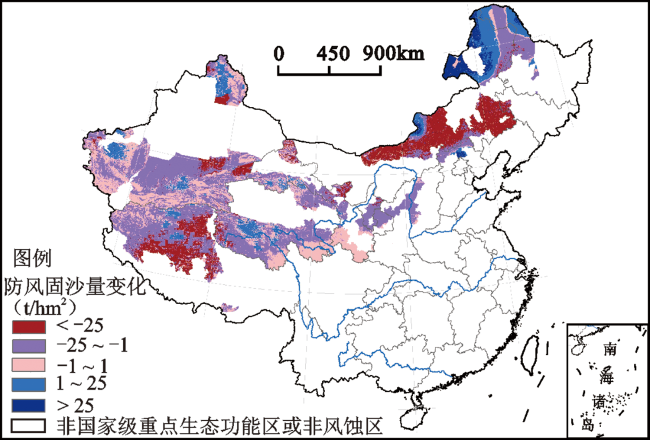
In order to improve ecosystem services and protect national ecological security in China, national key ecological function zones (NKEFZ) were designated, and the policy of financial transfer payment was established to protect ecosystems and environment in those zones. In order to evaluate the ecological effects of financial transfer payment policy, this study analyzed the dynamics of ecosystem macrostructure and key ecosystem services quantitatively before (2000-2010) and after (2010-2015) the implementation of financial transfer payment policy based on remote sensing data, Geographic Information System and ecological models in the NKEFZ. Water regulation service was simulated based on precipitation storage method, soil conservation service was simulated by Revised Universal Soil Loss Equation, and sand fixation service was simulated by Revised Wind Erosion Equation. The results showed that: grassland and forest were main ecosystem types in NKEFZ. After implementation of the financial transfer payment policy, the ecosystem condition of NKEFZ has been improved overall. Desertification has been effectively controlled, with an area decrease of 1 976.44 km2. Water and wetlands have been restored with an area expansion of 514.32 km2. However, ecological degradation still existed in some local NKEFZ. The area of forest and grassland ecosystems in NKEFZ have slightly decreased by 0.13% and 0.29%, respectively, and farmland and settlements areas have expanded significantly by 1.2% and 17.03%. In terms of ecosystem services, water regulation service has been improved, with water conservation volume increasing by 1.37%; Soil water erosion has been curbed and soil conservation service has been improved dramatically, with the soil loss and conservation volume changed by -9.06% and 10.78%, especially those NKEFZ located in the northeast and central regions of China; Soil wind erosion has also been curbed, with soil loss decreasing by 26.46%, however, the sand fixation service has declined by 26.59% overall. The threat of human activities on biodiversity maintenance remained relatively stable, with human disturbance index increasing 0.000 9. Under the joint effects of climate change and the implementation of financial transfer payment policy, the ecosystem conditions in the NKEFZ have been generally improved, which meant the policy has achieved ecological benefits to a certain extent. However, the increase of cultivated land and settlement area, reduction of grassland and forest area, the decrease of sand fixation service, and the acceleration of the increase of human disturbance all indicated that the ecological degradation still existed. In order to protect the NKEFZ effectively and realize the planning objectives, continuous efforts are still needed.
Fig.1 Spatial distribution of terrestrial ecosystem in national key ecological function zones in 2015图1 2015年国家重点生态功能区陆地生态系统空间分布 |
Fig.2 Change of water conservation volume in national key ecological function zones before and after transfer payment图2 转移支付前后国家重点生态功能区水源涵养量变化 |
Fig.3 Change of soil conservation volume per area in national key ecological function zones before and after transfer payment图3 转移支付前后国家重点生态功能区土壤保持量变化 |
Fig.4 Change of sand fixation volume per area in national key ecological function zones before and after transfer payment图4 转移支付前后国家重点生态功能区防风固沙量变化 |
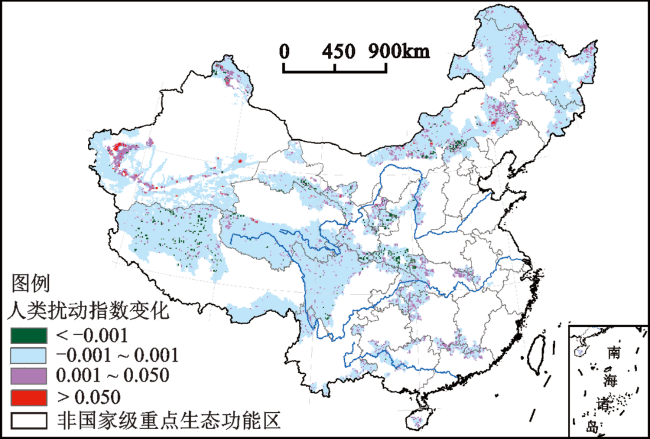
Fig.5 Distribution of human disturbance index change in national key ecological function zones after transfer payment图5 转移支付后国家重点生态功能区生态系统综合人类扰动指数变化空间分布 |
| [1] |
|
| [2] |
[
|
| [3] |
[
|
| [4] |
[
|
| [5] |
[
|
| [6] |
[
|
| [7] |
[
|
| [8] |
|
| [9] |
[
|
| [10] |
[
|
| [11] |
[
|
| [12] |
[
|
| [13] |
[
|
| [14] |
[
|
| [15] |
|
| [16] |
|
| [17] |
[
|
| [18] |
[
|
| [19] |
[
|
| [20] |
[
|
| [21] |
[
|
| [22] |
[
|
| [23] |
|
| [24] |
|
| [25] |
[
|
| [26] |
[
|
| [27] |
|
| [28] |
|
| [29] |
[
|
| [30] |
|
| [31] |
|
| [32] |
[
|
| [33] |
|
| [34] |
|
| [35] |
[
|
| [36] |
[
|
| [37] |
[
|
/
| 〈 |
|
〉 |