
Landsat 5 MSS和TM地表反射率和植被指数一致性分析与纠正
|
赵聪(1995— ),男,辽宁铁岭人,博士研究生,主要从事历史遥感数据处理研究。E-mail: zhaocong2013@pku.edu.cn |
收稿日期: 2022-05-24
修回日期: 2022-08-20
网络出版日期: 2023-06-26
基金资助
国家自然科学基金项目(42071314)
版权
Consistency analysis and correction of surface reflectance and vegetation indices of Landsat 5 MSS and TM
Received date: 2022-05-24
Revised date: 2022-08-20
Online published: 2023-06-26
Supported by
National Natural Science Foundation of China(42071314)
Copyright
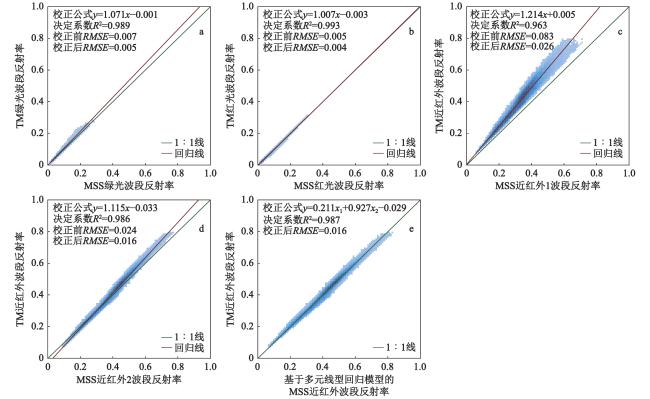
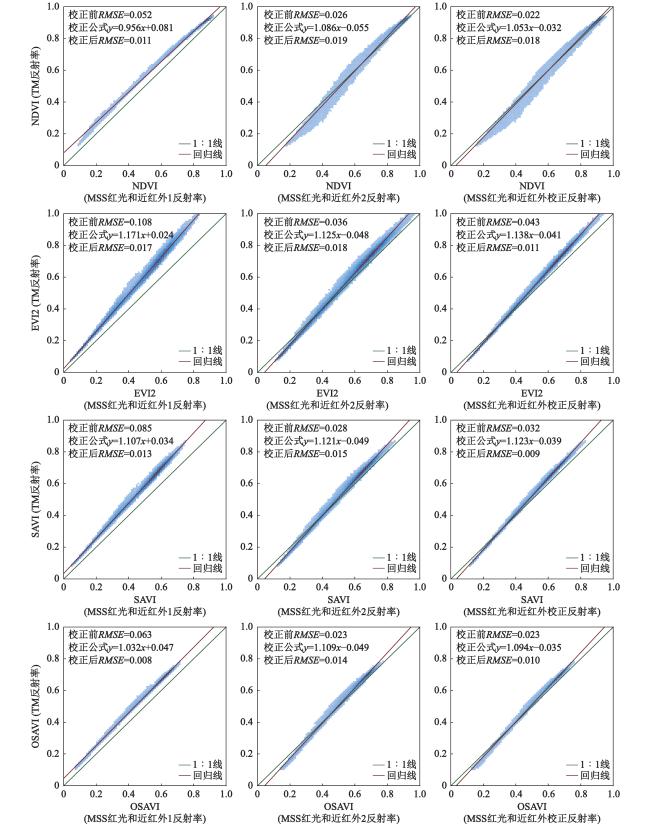
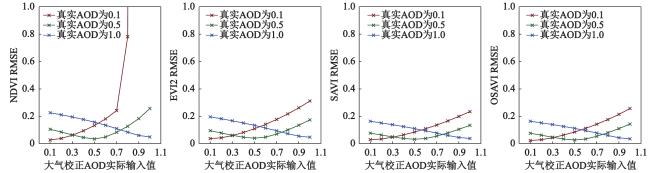
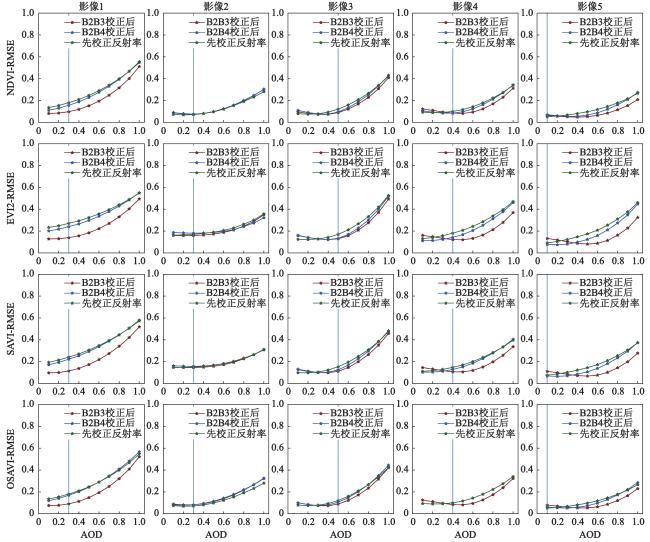
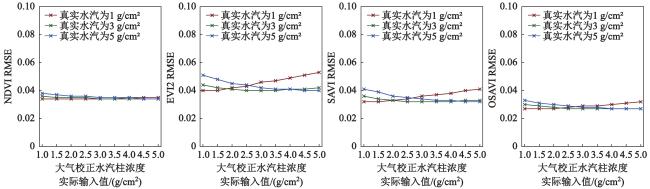
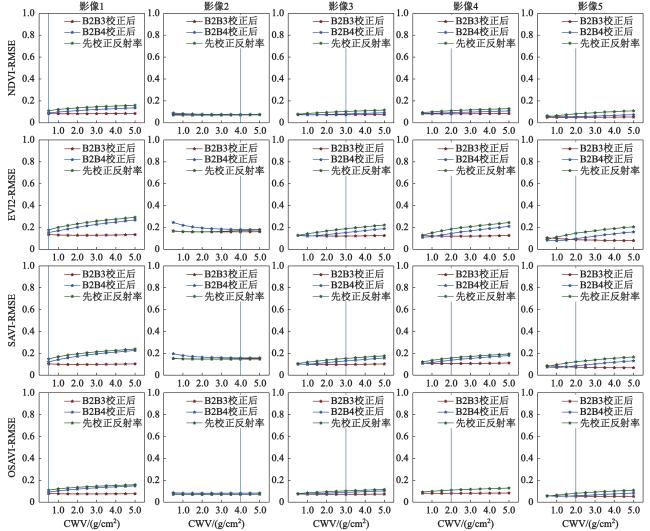
基于PROSAIL模型模拟数据,分析Landsat 5 MSS和TM地表反射率及4种植被指数(NDVI,EVI2,SAVI和OSAVI)的一致性并提出纠正方法,最后使用真实的MSS和TM数据进行验证。本文进一步讨论了大气因素对二者植被指数之间的一致性的影响。研究结果表明,对于地表反射率,线性回归模型和多元线性回归模型可以将基于模拟数据计算得到的Landsat MSS等效反射率数据较为理想地纠正至Landsat TM波段上,但对于真实MSS遥感数据,反射率纠正模型在MSS传感器的绿光、红光和近红外2波段上效果不明显;对于植被指数一致性和纠正问题,使用MSS红光波段和近红外1波段先计算植被指数再使用线性回归模型进行纠正不论在模拟数据还是真实数据上均取得了最好的效果;植被指数的一致性容易受大气参数中气溶胶光学厚度估算误差影响,而受到水汽柱浓度估算误差的影响较小。
关键词: Landsat MSS; Landsat TM; 地表反射率; 植被指数; 一致性分析
赵聪 , 秦其明 , 吴自华 . Landsat 5 MSS和TM地表反射率和植被指数一致性分析与纠正[J]. 地理科学, 2023 , 43(6) : 1078 -1087 . DOI: 10.13249/j.cnki.sgs.2023.06.014
The Landsat MSS dataset is an important historical dataset in the early development of remote sensing and almost the only earth observation remote sensing dataset in the 1970s. However, due to the difference between the Landsat MSS sensor and subsequent Landsat TM sensor, their observation results have systematic bias. It is necessary to study the consistency of surface reflectance and vegetation indices of Landsat 5 MSS and TM. Based on PROSAIL model simulation data, this paper analyzes the consistency of Landsat 5 MSS and TM surface reflectance by resampling the hyperspectral reflectance to broadband reflectance with the relative spectral responses. This article also calculates four vegetation indices (NDVI, EVI2, SAVI, and OSAVI) by the above broadband reflectance. Because the MSS sensor has two NIR bands, three correction methods are proposed. The first is to calculate the vegetation indices by MSS Red and NIR-1 reflectance and correct it with the linear regression model. The second is to calculate the vegetation indices by MSS Red and NIR-2 reflectance and convert it with the linear regression model. The third is to calculate the vegetation indices by the corrected Red and NIR reflectance. This paper finally validates the three correction methods by the real MSS and TM data of Landsat 5. This paper further discusses the influence of atmospheric factors on the consistency between the vegetation indices by the Second Simulation of the Satellite Signal in the Solar Spectrum (6S model). The results show that for the consistency and correction of reflectivity, the linear regression model and multiple linear regression model can correct the Landsat MSS equivalent reflectivity data calculated based on the simulated data to the Landsat TM band, but for the real MSS remote sensing data, the effect of the reflectance correction model is not as apparent as in simulated data. For the consistency and correction of vegetation indices, the MSS red light band and NIR-1 band are used to calculate the vegetation indices first, and then the linear regression model is used to correct it, which has achieved the best results in both simulated data and real data; Vegetation indices are easily affected by the estimation error of aerosol optical thickness in atmospheric parameters, but not by the estimation error of column water vapor. The method is sensitive to the input AOD of the atmospheric correction model and insensitive to the input CWV.
表1 PROSAIL模型输入参数Table 1 Input parameters of PROSAIL model |
| 参数 | 取值或取值范围 |
| 叶面积指数 | [0, 5] |
| 干湿土因子 | [0, 1] |
| 土壤亮度因子 | 1 |
| 太阳天顶角/(°) | 30 |
| 观测天顶角/(°) | 0 |
| 相对方位角/(°) | [0, 360] |
| 叶片叶绿素a、b浓度/(ug/cm2) | [10, 80] |
| 叶片类胡萝卜素浓度/(ug/cm2) | [0, 20] |
| 叶片等效水厚度/cm | [0.02, 0.08] |
| 叶片干物质量/(g/cm2) | [0.002, 0.01] |
| 叶片结构参数 | [0.8, 2.5] |
| 褐色素浓度 | 0 |
| 热点效应系数 | 0.1 |
| 叶倾角分布 | 统一型,球面型,平面型, 竖直型,倾斜型,极端型 |
表2 本研究使用的Landsat MSS和TM影像Table 2 Image pairs of Landsat MSS and TM used in this research |
| 编号 | MSS | TM |
| 1 | LM05_L1TP_123035_19950612_20180314_01_T2 | LT05_L1TP_123035_19950612_20170107_01_T1 |
| 2 | LM05_L1TP_123032_19841003_20180411_01_T2 | LT05_L1TP_123032_19841003_20170220_01_T1 |
| 3 | LM05_L1TP_119032_19840719_20180410_01_T2 | LT05_L1TP_119032_19840719_20170220_01_T1 |
| 4 | LM05_L1TP_132042_19871230_20180330_01_T2 | LT05_L1TP_132042_19871230_20170210_01_T1 |
| 5 | LM05_L1TP_120039_19841030_20180411_01_T2 | LT05_L1TP_120039_19841030_20170220_01_T1 |
表3 基于真实MSS和TM数据的地表反射率纠正模型比较Table 3 Comparison of surface reflectance correction models using real images pairs of MSS and TM |
| 自变量X | 因变量Y | 纠正前RMSE | 纠正后RMSE |
| 注:加粗表示取得验证最低RMSE,即最高精度;-表示无此项。 | |||
| MSS绿光 | TM绿光 | 0.017 | 0.016 |
| MSS红光 | TM红光 | 0.018 | 0.019 |
| MSS近红外1 | TM近红外 | 0.067 | 0.040 |
| MSS近红外2 | TM近红外 | 0.041 | 0.044 |
| MSS近红外 (多元线性回归) | TM近红外 | - | 0.046 |
表4 基于真实MSS和TM数据的植被指数的纠正模型比较Table 4 Comparison of vegetation indices correction models using real images pairs of MSS and TM |
| 植被指数 | 基于MSS红光波段和近红外1 波段的植被指数 | 基于MSS红光波段和近红外2 波段的植被指数 | 基于MSS纠正反射率 计算的植被指数 | ||||
| 纠正前RMSE | 纠正后RMSE | 纠正前RMSE | 纠正后RMSE | RMSE | |||
| 注:加粗表示取得验证最低RMSE,即最高精度。 | |||||||
| NDVI | 0.0991 | 0.0728 | 0.0873 | 0.0870 | 0.0972 | ||
| EVI2 | 0.1654 | 0.1277 | 0.1543 | 0.1642 | 0.1797 | ||
| SAVI | 0.1377 | 0.1075 | 0.1318 | 0.1413 | 0.1514 | ||
| OSAVI | 0.0991 | 0.0740 | 0.0837 | 0.0884 | 0.0972 | ||
| [1] |
Zhang H K, Roy D P, Yan L, et al. Characterization of Sentinel-2A and Landsat-8 top of atmosphere, surface, and nadir BRDF adjusted reflectance and NDVI differences[J]. Remote Sensing of Environment, 2018, 215: 482-494.
|
| [2] |
Nie Z, Chan K K Y, Xu B. Preliminary evaluation of the consistency of Landsat 8 and Sentinel-2 time series products in an urban area—An example in Beijing, China[J]. Remote Sensing, 2019, 11(24): 2957
|
| [3] |
Chen J, Zhu W. Comparing Landsat-8 and Sentinel-2 top of atmosphere and surface reflectance in high latitude regions: Case study in Alaska[J]. Geocarto International, 2022, 37(20): 6052-6071.
|
| [4] |
Chen F, Lou S, Fan Q, et al. Normalized difference vegetation index continuity of the Landsat 4-5 MSS and TM: Investigations based on simulation[J]. Remote Sensing, 2019, 11(14): 1681
|
| [5] |
Chen F, Wang C, Zhang Y, et al. Inconsistency among Landsat sensors in land surface mapping: A comprehensive investigation based on simulation[J]. Remote Sensing, 2021, 13(7): 1383
|
| [6] |
Pinto C T, Haque M O, Micijevic E, et al. Landsats 1–5 Multispectral scanner system sensors radiometric calibration update[J]. IEEE Transactions on Geoscience and Remote Sensing, 2019, 57(10): 7378-7394.
|
| [7] |
Vermote E F, Tanré D, Deuze J L, et al. Second simulation of the satellite signal in the solar spectrum, 6S: An overview[J]. IEEE Transactions on Geoscience and Remote Sensing, 1997, 35(3): 675-686.
|
| [8] |
Zhao C, Wu Z, Qin Q, et al. A framework of generating land surface reflectance of China early Landsat MSS images by visibility data and its evaluation[J]. Remote Sensing, 2022, 14(8): 1802
|
| [9] |
Jacquemoud S, Verhoef W, Baret F, et al. PROSPECT+ SAIL models: A review of use for vegetation characterization[J]. Remote Sensing of Environment, 2009, 113: S56-S66.
|
| [10] |
Jiang Z, Huete A R, Didan K, et al. Development of a two-band enhanced vegetation index without a blue band[J]. Remote Sensing of Environment, 2008, 112(10): 3833-3845.
|
| [11] |
Huete A R. A soil-adjusted vegetation index (SAVI)[J]. Remote Sensing of Environment, 1988, 25(3): 295-309.
|
| [12] |
Rondeaux G, Steven M, Baret F. Optimization of soil-adjusted vegetation indices[J]. Remote Sensing of Environment, 1996, 55(2): 95-107.
|
/
| 〈 |
|
〉 |