
流动人口再流动的空间选择特征及影响因素
|
林赛南(1987—),女,浙江永嘉人,博士,副教授,博导,主要研究方向为人口流动与城镇化、城市地理。E-mail: sainan.lin@whu.edu.cn |
收稿日期: 2022-09-14
修回日期: 2023-02-02
网络出版日期: 2023-10-12
基金资助
国家自然科学基金项目(42171205)
版权
Migrants' spatial choice in onward migration: Features and mechanisms
Received date: 2022-09-14
Revised date: 2023-02-02
Online published: 2023-10-12
Supported by
National Natural Science Foundation of China(42171205)
Copyright
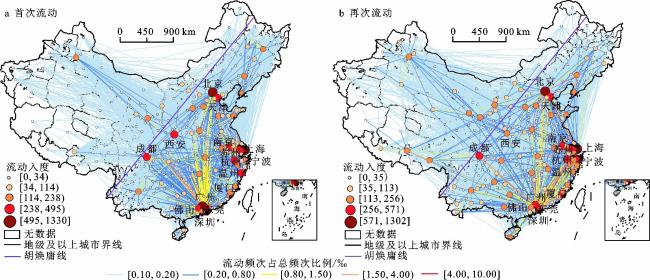
基于2017年全国流动人口动态监测数据,刻画中国城市流动人口再流动的轨迹与网络特征,并借助嵌套Logit模型探究流动人口在再次流动时空间选择的影响因素。研究发现:① 再流动样本大多于首次流动后的10 a内发生第二次流动,并缩小流动范围;再次流动时多数已婚且家庭化流动趋势明显;两次流动过程的跨等级流动路径不会始终向上而呈现出多样化的选择结果。② 首次流动网络格局呈现出明显的重心偏东、偏南的十字菱形结构,而再次流动时横向联系变弱,城市流向相对变少。③ 个体和城市因素对再次流入地的选择产生影响,其中工资水平的影响力最大,其次是个人特征,再是其他城市经济属性和生活品质变量。
林赛南 , 冯馨 , 王雨 . 流动人口再流动的空间选择特征及影响因素[J]. 地理科学, 2023 , 43(9) : 1537 -1547 . DOI: 10.13249/j.cnki.sgs.2023.09.004
The number and direction of China's population movements have changed substantially in the last few decades, which caused constant spatial restructuring. Migration is often a multi-stage process that migrants that migrantes may continue an onward migration after their fiyst spatial movement. However, existing studies have paid little attention to such dynamic processes. To fill this research gap, this paper analyzes the dynamic trajectory of migration and the network features of the spatial pattern, and further explores the influencing factors of the spatial choice of the onward migration by using social network analysis and the nested Logit model. The main findings are as followings: 1) The onward migration often occurs within ten years after the primary migration, with a decreasing migration distance. The majority of these onward migrants are married and tend to mirgate with family when they move again. It is also important to note that the onward migration does not always involve movement from cities in a lower hierarchy to a higher one, but presenting diversified patterns; 2) The primary migration network shows a very obvious cross-shaped diamond structure with the center of gravity to the east and south, while in the onward migration, the horizontal linkage becomes weaker, showing fewer pair cities with flows; 3) Spatial choices of onward migration are influenced by both individual and urban factors, among which the average wage in the destination city has the most significant influence, followed by individual characteristics and other urban factors. The higher the education level, the higher the administrative rank of migrants' place of origin, and the younger the onward migrants are in occupations requiring higher professional and technical knowledge and within the working age, the more they tend to flow to a Tier-one city. Based on the above empirical findings, the study further proposes relevant recommendations for different types of cities considering the characteristics of migration process: First, the cities with strong population attractiveness should actively improve facilities, public service conditions and enhance governance to increase the carrying capacity of the population. Second, different cities should be clear about the differences between themselves and other popular cities where the migrants tend to move. Given that migrants are more likely to choose destinations within the urban cluster in onward migration, the cities belonging to the cluster should utilize the population spillover effect of the core cities. They should actively adjust the industrial structure to promote the development of industries with obvious income pulling effect, strengthen the comprehensive urban governance capacity, and create ample urban amenities to attract the population. In view of the visible trend of family migration, cities should introduce corresponding policies in public services.
Key words: migrant; onward migration; spatial choice; nested Logit model
表1 流动人口再流动空间选择影响因素回归模型中各变量的描述统计Table 1 Descriptive statistics of the variables in the regression model of the spatial choice in onward migration |
| 变量类型 | 变量含义 | 变量说明及赋分 | 均值 | 标准差 |
| 注:*表示变量取对数后加入模型;**表示变量标准化取平均值后加入模型;-为被解释变量无均值和标准差;不含港澳台数据。 | ||||
| 被解释变量 | 是否选择j城市 | 否=0,是=1 | - | - |
| 人口学特征 | 性别 | 男性=1,女性=2 | 1.46 | 0.50 |
| 年龄 | 1~29岁=1,30~44岁=2,45~59岁=3,≥60岁=4 | 32.28 | 8.80 | |
| 受教育程度 | 小学及以下=1,初中=2,高中及中专=3,大专及以上=4 | 2.63 | 1.00 | |
| 户口类型 | 农业户口=1,非农业户口=2 | 1.15 | 0.36 | |
| 职业类型 | 农业及制造业从业人员=1,商业、服务业从业人员=2, 专业技术及办公人员=3,无固定职业或其他=4 | 1.97 | 0.76 | |
| 流动特征 | 家庭式迁移 | 独自流动=1,家庭式流动=2 | 1.68 | 0.46 |
| 户籍所在地 | 农村=1,乡镇、县城=2,地级市=3,省会(首府、直辖市)、计划单列市=4 | 1.28 | 0.57 | |
| 较首次流入地流动距离* | 选择的j城市与首次流入地之间的最短公路距离/km | 924.29 | 840.99 | |
| 较户籍地流动距离* | 选择的j城市与户籍地之间的最短公路距离/km | 864.83 | 760.63 | |
| 城市经济 属性 | 人均GDP* | 人均GDP/元 | 48981.92 | 29412.77 |
| GDP增长率 | GDP增长率/% | 7.85 | 3.09 | |
| 失业率 | 城镇失业率/% | 2.70 | 1.67 | |
| 产业结构 | 三产与二产的比值 | 1.02 | 0.58 | |
| 工资水平* | 在岗职工平均年工资/元 | 54460.73 | 11866.03 | |
| 房价收入比 | 住宅每平方米平均售价与当年城镇居民人均可支配收入的比值 | 0.20 | 0.09 | |
| 城市生活 品质 | 教育服务水平** | 每万名学生拥有的小学专任教师数/人 | 617.89 | 146.24 |
| 每万名学生拥有的中学专任教师数/人 | 833.53 | 181.76 | ||
| 医疗服务水平** | 每万人医院及卫生院床位数/张 | 48.24 | 15.07 | |
| 每万人医生数/人 | 22.62 | 12.21 | ||
| 建成区绿化率 | 建成区绿化率/% | 37.61 | 8.02 | |
| 空气质量 | PM2.5年均质量浓度/(μg/m3) | 33.70 | 19.35 | |
表2 再流动人口样本群体特征统计Table 2 Characteristics statistics of onward migration population sample group |
| 特征指标 | 占比均值/% | 特征指标 | 占比均值/% | |
| 注:不含港澳台数据。 | ||||
| 个人社会经济属性 | 阶段性流动特征 | |||
| 性别 | 首次流动时长/a | |||
| 女性 | 43.56 | <5 | 35.85 | |
| 男性 | 56.44 | [5, 11) | 36.85 | |
| 年龄/岁 | [11, 20] | 23.33 | ||
| 15~29 | 35.80 | >20 | 3.97 | |
| 30~44 | 48.98 | 均值 | 7.85 | |
| 45~59 | 14.69 | 首次流动范围 | ||
| ≥60 | 0.53 | 省域内流动 | 25.39 | |
| 均值 | 34.24 | 省域际流动 | 74.61 | |
| 户口类型 | 再次流动范围(相较户籍地) | |||
| 农业户口 | 82.32 | 省域内流动 | 30.44 | |
| 非农业户口 | 17.68 | 省域际流动 | 69.56 | |
| 婚姻状况 | 首次流动家庭化程度 | |||
| 未婚 | 15.99 | 独自流动 | 75.81 | |
| 已婚 | 82.23 | 家庭式流动 | 24.19 | |
| 离异或丧偶 | 1.78 | 再次流动家庭化程度 | ||
| 受教育程度 | 独自流动 | 25.68 | ||
| 小学及以下 | 13.14 | 家庭式流动 | 74.32 | |
| 初中 | 41.63 | 跨等级流动路径 | ||
| 高中及中专 | 21.02 | 先向上后向下 | 44.29 | |
| 大专及以上 | 24.21 | 一直向上 | 20.18 | |
| 职业类型 | 先向上后不变 | 15.11 | ||
| 农业及制造业从业人员 | 25.40 | 先不变后向上 | 6.92 | |
| 商业、服务业从业人员 | 56.13 | 先向下后向上 | 6.02 | |
| 专业技术及办公人员 | 14.11 | 先不变后向下 | 2.14 | |
| 无固定职业或其他 | 4.36 | 先向下后不变 | 2.11 | |
| 一直不变 | 1.87 | |||
| 一直向下 | 1.35 | |||
表3 首次和再次流动网络中出入度排名前10的城市Table 3 Top 10 cities by in-degree and out-degree in the primary and onward migration network |
| 首次出度 | 首次入度(再次出度) | 再次入度 | |
| 注:不含港澳台数据。 | |||
| 1 | 重庆市 | 深圳市 | 上海市 |
| 2 | 阜阳市 | 广州市 | 北京市 |
| 3 | 周口市 | 东莞市 | 天津市 |
| 4 | 邵阳市 | 北京市 | 苏州市 |
| 5 | 南阳市 | 上海市 | 杭州市 |
| 6 | 信阳市 | 苏州市 | 南京市 |
| 7 | 六安市 | 杭州市 | 深圳市 |
| 8 | 南充市 | 温州市 | 无锡市 |
| 9 | 安庆市 | 西安市 | 厦门市 |
| 10 | 上饶市 | 成都市 | 宁波市 |
表4 首次和再次流动中流动频次最高的12组城市Table 4 Top 12 city groups by migrantion frequency and distance |
| 首次流向对 | 频次/次 | 流动距离/km | 再次流向对 | 频次/次 | 流动距离/km | |
| 注:不含港澳台数据。 | ||||||
| 重庆→深圳 | 52 | 1322.20 | 北京→天津 | 142 | 150.83 | |
| 重庆→东莞 | 50 | 1287.31 | 苏州→上海 | 99 | 100.26 | |
| 重庆→广州 | 46 | 1220.87 | 上海→苏州 | 86 | 96.98 | |
| 邵阳→深圳 | 44 | 738.32 | 深圳→东莞 | 86 | 41.74 | |
| 阜阳→上海 | 44 | 1364.5 | 深圳→上海 | 86 | 1423.75 | |
| 邵阳→广州 | 43 | 643.34 | 深圳→广州 | 84 | 105.30 | |
| 六安→上海 | 43 | 584.55 | 南京→上海 | 82 | 309.43 | |
| 六安→苏州 | 39 | 498.00 | 北京→上海 | 81 | 1251.51 | |
| 衡阳→广州 | 38 | 518.44 | 广州→佛山 | 77 | 99.23 | |
| 淮南→上海 | 35 | 561.01 | 东莞→深圳 | 73 | 41.84 | |
| 盐城→上海 | 35 | 327.45 | 上海→南京 | 69 | 309.14 | |
| 南充→深圳 | 35 | 1665.65 | 广州→东莞 | 69 | 77.26 | |
表5 再流动空间选择影响因素嵌套Logit模型回归结果Table 5 Nested Logit model regression results for onward migration spatial choice |
| 变量 | 模型1 | 模型2 | 模型3 | 模型4 | |||||||
| 一类城市 | 二类城市 | 一类城市 | 二类城市 | 一类城市 | 二类城市 | 一类城市 | 二类城市 | ||||
| 注:括号内为标准误差;*** 、** 、* 分别为P<0.001、P<0.01、P<0.05;τ 1、τ 2、τ 3分别为一类城市组、二类城市组、三类城市组的不相似参数;-为指标未带进模型; 模型参照组为流动人口选择三类城市为目的地;不含港澳台数据。 | |||||||||||
| 女性(参照组=男性) | -0.061 (0.061) | 0.040 (0.042) | -0.134* (0.061) | 0.017 (0.042) | -0.149* (0.060) | 0.007 (0.042) | -0.199** (0.060) | 0.004 (0.042) | |||
| 年龄(参照组=15~29岁) | |||||||||||
| 30~44岁 | -0.193** (0.067) | 0.192*** (0.046) | -0.301*** (0.067) | 0.151*** (0.046) | -0.306*** (0.066) | 0.148** (0.046) | -0.376*** (0.067) | 0.134** (0.046) | |||
| 45~59岁 | -0.165 (0.118) | 0.294*** (0.070) | -0.365** (0.118) | 0.205** (0.070) | -0.370** (0.117) | 0.209** (0.070) | -0.502*** (0.117) | 0.174* (0.070) | |||
| ≥60岁 | -0.038 (0.557) | 0.458 (0.319) | -0.370 (0.564) | 0.385 (0.320) | -0.268 (0.558) | 0.370 (0.317) | -0.488 (0.563) | 0.338 (0.318) | |||
| 非农业户口(参照组=农业户口) | 0.100 (0.105) | 0.006 (0.079) | 0.045 (0.107) | 0.011 (0.080) | 0.139 (0.106) | 0.023 (0.079) | 0.085 (0.107) | 0.025 (0.080) | |||
| 职业类型(参照组=农业及制造业从业人员) | |||||||||||
| 商业服务业从业人员 | 0.128 (0.075) | 0.575*** (0.049) | 0.034 (0.074) | 0.538*** (0.049) | 0.062 (0.074) | 0.538*** (0.049) | -0.006 (0.073) | 0.521*** (0.049) | |||
| 专业技术及办公人员 | 0.678*** (0.100) | 0.416*** (0.078) | 0.574*** (0.100) | 0.380*** (0.078) | 0.623*** (0.099) | 0.379*** (0.078) | 0.547*** (0.099) | 0.365*** (0.078) | |||
| 无固定职业或其他 | 0.492*** (0.149) | 0.427*** (0.110) | 0.379* (0.150) | 0.394*** (0.110) | 0.425** (0.148) | 0.379*** (0.110) | 0.347* (0.149) | 0.382*** (0.110) | |||
| 户籍地等级(参照组=农村) | |||||||||||
| 乡镇、县城 | 0.199* (0.091) | 0.088 (0.064) | 0.214* (0.092) | 0.077 (0.064) | 0.187* (0.091) | 0.082 (0.064) | 0.201* (0.092) | 0.073 (0.064) | |||
| 一般地级市 | 0.733*** (0.161) | 0.041 (0.137) | 0.761*** (0.163) | 0.019 (0.137) | 0.757*** (0.161) | 0.052 (0.137) | 0.775*** (0.163) | 0.030 (0.137) | |||
| 省会(首府、直辖市)、 计划单列市 | 0.878** (0.295) | 0.107 (0.267) | 0.910** (0.300) | 0.179 (0.270) | 0.931** (0.296) | 0.171 (0.267) | 0.933** (0.300) | 0.209 (0.269) | |||
| 受教育程度(参照组=小学及以下) | |||||||||||
| 初中 | 0.071 (0.091) | 0.571*** (0.060) | -0.309*** (0.089) | 0.459*** (0.059) | -0.287*** (0.086) | 0.437*** (0.059) | -0.546*** (0.086) | 0.402*** (0.059) | |||
| 高中及大专 | 0.529*** (0.101) | 0.901*** (0.069) | 0.118 (0.098) | 0.776*** (0.068) | 0.152 (0.096) | 0.753*** (0.068) | -0.136 (0.096) | 0.709*** (0.068) | |||
| 大专及以上 | 1.260*** (0.108) | 1.076*** (0.076) | 0.754*** (0.104) | 0.932*** (0.075) | 0.893*** (0.103) | 0.916*** (0.075) | 0.521*** (0.101) | 0.851*** (0.075) | |||
| 家庭式迁移(参照组=独自流动) | 0.236*** (0.066) | 0.192*** (0.046) | 0.160* (0.066) | 0.146** (0.046) | 0.152* (0.065) | 0.144** (0.046) | 0.102 (0.065) | 0.123** (0.046) | |||
| 与首次流入地距离 | -0.527***(0.020) | -0.727***(0.026) | -0.582***(0.022) | -0.690***(0.024) | |||||||
| 与户籍地距离 | -0.598***(0.023) | -1.071***(0.039) | -0.700***(0.028) | -1.073***(0.040) | |||||||
| 产业结构 | - | 0.172***(0.018) | - | 0.162***(0.018) | |||||||
| 工资水平 | - | 2.561***(0.112) | - | 2.755***(0.118) | |||||||
| 失业率 | - | -0.026***(0.007) | - | -0.010(0.006) | |||||||
| 人均GDP | - | 0.294***(0.026) | - | 0.317***(0.031) | |||||||
| GDP增长率 | - | 0.006(0.004) | - | -0.007(0.004) | |||||||
| 房价收入比 | - | -0.019*(0.008) | - | -0.004(0.007) | |||||||
| PM2.5年均质量浓度 | - | - | -0.007***(0.000) | -0.012***(0.001) | |||||||
| 建成区绿化率 | - | - | -0.004***(0.001) | -0.010***(0.001) | |||||||
| 医疗服务水平 | - | - | 0.012***(0.001) | 0.006***(0.001) | |||||||
| 教育服务水平 | - | - | -0.000(0.001) | -0.020***(0.002) | |||||||
| 参照组=三类城市 | |||||||||||
| τ 1 | 0.640***(0.034) | 0.882***(0.043) | 0.862***(0.048) | 0.897***(0.044) | |||||||
| τ 2 | 0.445***(0.018) | 0.764***(0.030) | 0.503***(0.021) | 0.701***(0.028) | |||||||
| τ 3 | 0.541***(0.019) | 0.829***(0.028) | 0.579***(0.021) | 0.798***(0.028) | |||||||
| Loglikelihood | -47948.437 | -46307.047 | -47273.000 | -45699.032 | |||||||
| Wald Chi2 | 1820.82 | 1850.53 | 1625.62 | 1827.49 | |||||||
| Prob>chi2 | 0.000 | 0.000 | 0.000 | 0.000 | |||||||
| IIA检验 | 0.000 | 0.000 | 0.000 | 0.000 | |||||||
| [1] |
刘涛, 彭荣熙, 卓云霞, 等. 2000—2020年中国人口分布格局演变及影响因素[J]. 地理学报, 2022, 77(2): 381-394.
Liu Tao, Peng Rongxi, Zhuo Yunxia et al. China's changing population distribution and influencing factors: Insights from the 2020 census data. Acta Geographica Sinica, 2022, 77(2): 381-394.
|
| [2] |
朱宇, 林李月. 中国人口迁移流动的时间过程及其空间效应研究: 回顾与展望[J]. 地理科学, 2016, 36(6): 820-828.
Zhu Yu, Lin Liyue. Studies on the temporal processes of migration and their spatial effects in China: Progress and prospect. Scientia Geographica Sinica, 2016, 36(6): 820-828.
|
| [3] |
国家卫生健康委员会. 中国流动人口发展报告(2018)[M]. 北京: 中国人口出版社, 2018: 3-11.
National Health Commission. Report on China's migrant population development 2018. Beijing: China Population Publishing House, 2018: 3-11.
|
| [4] |
田明. 中国东部地区流动人口城市间横向迁移规律[J]. 地理研究, 2013, 32(8): 1486-1496.
Tian Ming. The migration patterns of floating population across cities in eastern China. Geographical Research, 2013, 32(8): 1486-1496.
|
| [5] |
林李月, 朱宇. 流动人口初次流动的空间类型选择及其影响因素——基于福建省的调查研究[J]. 地理科学, 2014, 34(5): 539-546.
Lin Liyue, Zhu Yu. The choices of the destination's spatial types in the floating population's first-time migration and their determinants: Case studies of Fujian Province. Scientia Geographica Sinica, 2014, 34(5): 539-546.
|
| [6] |
刘建波, 王桂新, 魏星. 基于嵌套Logit模型的中国省际人口二次迁移影响因素分析[J]. 人口研究, 2004(4): 48-56.
Liu Jianbo, Wang Guixin, Wei Xing. Determinants of inter-provincial migration in China: Nested Logit models. Population Research, 2004(4): 48-56.
|
| [7] |
刘涛, 卓云霞, 王洁晶. 邻近性对人口再流动目的地选择的影响[J]. 地理学报, 2020, 75(12): 2716-2729.
Liu Tao, Zhuo Yunxia, Wang Jiejing. How multi-proximity affects destination choice in onward migration: A nested Logit model. Acta Geographica Sinica, 2020, 75(12): 2716-2729.
|
| [8] |
Tian M, Tian Z, Cushing B. Inter-city migration in China: A recurrent-event duration analysis of repeat migration[J]. Cambridge Journal of Regions Economy and Society, 2016, 9(3): 551-569.
|
| [9] |
王录仓, 刘海洋, 刘清. 基于腾讯迁徙大数据的中国城市网络研究[J]. 地理学报, 2021, 76(4): 853-869.
Wang Lucang, Liu Haiyang, Liu Qing. China's city network based on Tencent's migration big data. Acta Geographica Sinica, 2021, 76(4): 853-869.
|
| [10] |
林赛南, 王雨, 马海涛. 中国高学历流动人口流动的空间特征及形成机制[J]. 地理研究, 2022, 41(12): 3229-3244.
Lin Sainan, Wang Yu, Ma Haitao. Spatial mobility pattern of highly educated migrants and its mechanisms in China. Geographical Research, 2022, 41(12): 3229-3244.
|
| [11] |
王珏, 陈雯, 袁丰. 基于社会网络分析的长三角地区人口迁移及演化[J]. 地理研究, 2014, 33(2): 385-400.
Wang Jue, Chen Wen, Yuan Feng. Human mobility and evolution based on social network: An empirical analysis of Yangtze River Delta. Geographical Research, 2014, 33(2): 385-400.
|
| [12] |
古恒宇, 沈体雁. 1995—2015年中国省际人口迁移网络的演化特征——基于异质性劳动力视角[J]. 地理研究, 2021, 40(6): 1823-1839.
Gu Hengyu, Shen Tiyan. Evolution patterns of China's interprovincial migration networks between 1995 and 2015: Based on labour heterogeneity. Geographical Research, 2021, 40(6): 1823-1839.
|
| [13] |
Liu Y, Shen J. Jobs or amenities? Location choices of interprovincial skilled migrants in China, 2000—2005[J]. Population, Space and Place, 2014, 20(7): 592-605.
|
| [14] |
S L E. A theory of migration[J]. Demography, 1966, 3(1): 47-57.
|
| [15] |
Sjaastad L A. The costs and returns of human migration[J]. Journal of Political Economy, 1962, 70(S5): 80-93.
|
| [16] |
Diamond R. The determinants and welfare implication of US workers' diverging location choice by skill: 1980—2000[J]. American Economic Review, 2016(3): 479-524.
|
| [17] |
张亚丽, 方齐云. 城市舒适度对劳动力流动的影响[J]. 中国人口·资源与环境, 2019, 29(3): 118-125.
Zhang Yali, Fang Qiyun. The impact of city amenity on labor migration. China Population, Resources and Environment, 2019, 29(3): 118-125.
|
| [18] |
李拓, 李斌. 中国跨地区人口流动的影响因素——基于286个城市面板数据的空间计量检验[J]. 中国人口科学, 2015(2): 73-83+127.
Li Tuo, Li Bin. Factor analysis of cross regional population flow in China: An empirical study with spatial econometrics models and panel data of 286 cities in China. Chinese Journal of Population Science, 2015(2): 73-83+127.
|
| [19] |
卓云霞, 刘涛, 古维迎. 多维邻近性与城-城流动人口的流入地选择——基于嵌套Logit模型的实证分析[J]. 地理科学, 2021, 41(7): 1210-1218.
Zhuo Yunxia, Liu Tao, Gu Weiying. How multi-proximity affects destination choice in urban-urban migration: An analysis based on nested Logit model. Scientia Geographica Sinica, 2021, 41(7): 1210-1218.
|
| [20] |
马志飞, 尹上岗, 张宇, 等. 中国城城流动人口的空间分布、流动规律及形成机制[J]. 地理研究, 2019, 38(4): 926-936.
Ma Zhifei, Yin Shanggang, Zhang Yu et al. Spatial distribution, flowing rules and forming mechanism of inter-cities floating population in China. Geograchical Research, 2019, 38(4): 926-936.
|
| [21] |
Hao P, Tang S. Migration destinations in the urban hierarchy in China: Evidence from Jiangsu[J]. Population Space and Place, 2018, 24(2): e2083
|
| [22] |
蒋小荣, 汪胜兰. 中国地级以上城市人口流动网络研究——基于百度迁徙大数据的分析[J]. 中国人口科学, 2017(2): 35-46+127.
Jiang Xiaorong, Wang Shenglan. Research on China's urban population mobility network: Based on Baidu Migration Big Data. Chinese Journal of Population Science, 2017(2): 35-46+127.
|
| [23] |
潘竟虎, 赖建波. 中国城市间人口流动空间格局的网络分析——以国庆-中秋长假和腾讯迁徙数据为例[J]. 地理研究, 2019, 38(7): 1678-1693.
Pan Jinghu, Lai Jianbo. Research on spatial pattern of population mobility among cities: A case study of "Tencent Migration" big data in "National Day–Mid-Autumn Festival" vacation. Geographical Research, 2019, 38(7): 1678-1693.
|
| [24] |
杜鹏, 张文娟. 对中国流动人口“梯次流动”的理论思考[J]. 人口学刊, 2010(3): 25-29.
Du Peng, Zhang Wenjuan. On the laddering migration of China's floating population. Population Journal, 2010(3): 25-29.
|
| [25] |
刘涛, 齐元静, 曹广忠. 中国流动人口空间格局演变机制及城镇化效应——基于2000和2010年人口普查分县数据的分析[J]. 地理学报, 2015, 70(4): 567-581.
Liu Tao, Qi Yuanjing, Cao Guangzhong. China's floating population in the 21st century: Uneven landscape, influencing factors, and effects on urbanization. Acta Geographica Sinica, 2015, 70(4): 567-581.
|
| [26] |
周皓, 刘文博. 流动人口的流入地选择机制[J]. 人口研究, 2022, 46(1): 37-53.
Zhou Hao, Liu Wenbo. Destination selection mechanism of migrants in China. Population Research, 2022, 46(1): 37-53.
|
| [27] |
国家统计局. 中国城市统计年鉴[M]. 北京: 中国统计出版社, 2016.
National Bureau of Statistics. China city statistical yearbook. Beijing: China Statistics Press, 2016.
|
| [28] |
住房和城乡建设部. 中国城市建设统计年鉴[M]. 北京: 中国统计出版社, 2016.
Ministry of Housing and Urban-Rural Development. China urban construction statistical yearbook. Beijing: China Statistics Press, 2016.
|
| [29] |
国家民族事务委员会, 国家统计局. 中国民族统计年鉴[M]. 北京: 中国统计出版社, 2016.
National Ethnic Affairs Commission, National Bureau of Statistics. China's ethnic statistical yearbook. Beijing: China Statistics Press, 2016.
|
| [30] |
陈艳如, 谷跃, 宋伟轩. 中国城市房价、收入与房价收入比的时空分异格局[J]. 地理研究, 2021, 40(9): 2442-2458.
Chen Yanru, Gu Yue, Song Weixuan. The spatiotemporal differentiation pattern of Chinese urban housing price, income and housing price-to-income ratio. Geographical Research, 2021, 40(9): 2442-2458.
|
| [31] |
童玉芬, 王莹莹. 中国流动人口的选择: 为何北上广如此受青睐?——基于个体成本收益分析[J]. 人口研究, 2015, 39(4): 49-56.
Tong Yufen, Wang Yingying. The choice of floating migrants in China: Why megacities are always preferred? A cost-benefit analysis. Population Research, 2015, 39(4): 49-56.
|
| [32] |
林赛南, 卢婷婷, 田明. 流动人口家庭化迁移与住房选择分异研究——基于全国25个城市的实证分析[J]. 经济地理, 2021, 41(5): 95-102.
Lin Sainan, Lu Tingting, Tian Ming. Family migration and housing tenure choice: Empirical evidences from 25 Chinese cities. Economic Geography, 2021, 41(5): 95-102.
|
/
| 〈 |
|
〉 |