
中国数字经济空间网络结构演化及其驱动因素
|
王胜鹏(1996—),安徽池州人,博士研究生,主要研究方向为经济地理与区域发展。E-mail: wangshengpeng1996@foxmail.com |
收稿日期: 2023-02-20
修回日期: 2023-07-11
网络出版日期: 2024-05-17
基金资助
国家自然科学基金重点项目(42130510)
上海市社会科学规划项目(2021BJL002)
中国博士后基金面上项目资助(2023M731090)
版权
Evolution and driving factors of spatial network structure of digital economy in China
Received date: 2023-02-20
Revised date: 2023-07-11
Online published: 2024-05-17
Supported by
Key Program of National Natural Science Foundation of China(42130510)
Shanghai Social Science Planning(2021BJL002)
China Postdoctoral Science Foundation(2023M731090)
Copyright
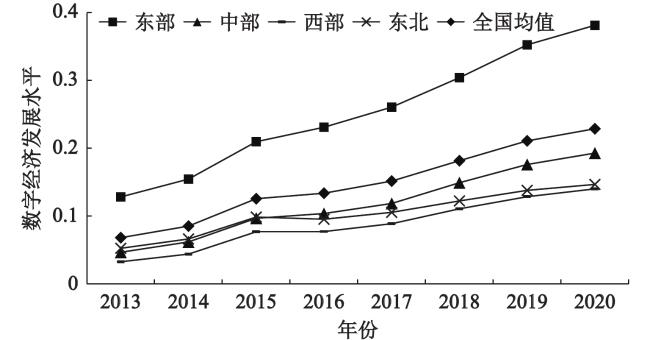
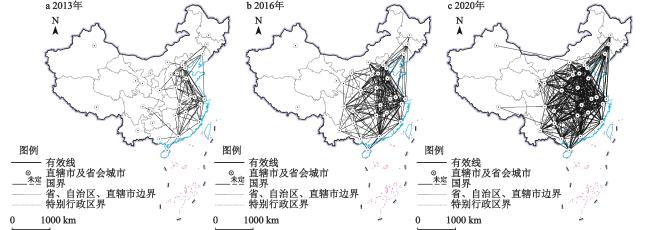
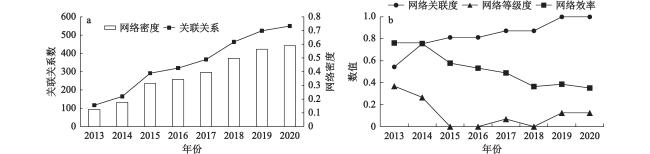
本文运用修正的CRITIC评价法测度了2013—2020年中国省域数字经济发展水平,运用社会网络分析方法探究了数字经济空间网络结构演化特征及其成因。结果表明:①中国数字经济发展水平总体呈现稳步上升态势,空间格局上表现为东高西低的特征。②研究期内,中国省域数字经济的空间关联网络呈现出多线程与稠密化的复杂结网态势,网络密度有所提升,整体不存在等级森严的空间结构。③经济发达地区在空间网络结构中的优势地位显著,西部及边陲地区与其他地区的互联互通能力有待提升;凝聚子群空间分布逐渐形成有序的团块化分布。④数字经济空间网络结构是多因素综合作用的结果,科技创新水平、政府支持力度及地理空间距离始终表现出显著作用,而经济发展水平、产业结构水平和城镇化水平的效应则体现出先强后弱的阶段性特征,上述因素共同驱动着中国省域数字经济空间网络结构的优化与重组。
王胜鹏 , 滕堂伟 , 胡森林 , 李炜 . 中国数字经济空间网络结构演化及其驱动因素[J]. 地理科学, 2024 , 44(5) : 743 -753 . DOI: 10.13249/j.cnki.sgs.20230132
In the era of digitalization, it is of great practical significance to explore the spatial network structure of digital economy and its driving factors for promoting the construction of “digital China”. The research applied the modified CRITIC evaluation method to measure the development level of digital economy of China from 2013 to 2020, and explored the evolution characteristics and causes of the spatial network structure of the digital economy by social network analysis. The results show that: 1) The overall level of digital economy development has shown a steady upward trend, and the spatial pattern is characterized by high in the east and low in the west. 2) During the study period, the spatial connection network of the provincial digital economy in China shows a complex situation of multi-threaded and dense networking. The network density is improved, and there is no hierarchical spatial structure as a whole. 3) The economically developed regions have a significant advantage in the spatial network structure, and the connections between the western and border regions and other regions needs to be improved; the condensed subgroup spatial distribution gradually forms an orderly agglomerated distribution. 4) The spatial correlation network of digital economy is affected by the joint action of multiple factors. The level of scientific and technological innovation, government support and geographical distance have always played a significant role, while the effects of economic development level, industrial structure level and urbanization level reflect the stage characteristics by strong first and weak later. The above factors together drive the optimization and restructuring of the provincial digital economy spatial network structure in China.
表1 2013—2020年中国数字经济发展水平空间关联网络中心性特征Table 1 Centrality of spatial correlation network of China’s digital economy level from 2013 to 2020 |
| 地区 | 2013年 | 2016年 | 2020年 | ||||||||||||||
| Do | Di | CRD | CRP | CRB | Do | Di | CRD | CRP | CRB | Do | Di | CRD | CRP | CRB | |||
| 注:Do、Di、CRD、CRP和CRB分别表示点出度、点入度、度数中心度、接近中心度和中介中心度;港澳台数据暂缺。 | |||||||||||||||||
| 京 | 14 | 9 | 46.667 | 10.601 | 12.597 | 24 | 15 | 80.000 | 24.390 | 10.821 | 29 | 22 | 96.667 | 96.774 | 8.998 | ||
| 津 | 4 | 6 | 23.333 | 10.345 | 0.520 | 14 | 13 | 50.000 | 22.727 | 0.764 | 23 | 21 | 76.667 | 81.081 | 0.833 | ||
| 冀 | 5 | 7 | 23.333 | 10.345 | 0.367 | 13 | 14 | 46.667 | 22.556 | 0.351 | 24 | 21 | 80.000 | 78.947 | 0.993 | ||
| 晋 | 3 | 5 | 16.667 | 10.000 | 0.038 | 8 | 13 | 46.667 | 22.556 | 0.551 | 19 | 21 | 70.000 | 76.923 | 0.239 | ||
| 内蒙古 | 1 | 1 | 3.333 | 9.868 | 0.000 | 5 | 9 | 30.000 | 21.583 | 0.000 | 10 | 16 | 56.667 | 68.182 | 0.068 | ||
| 辽 | 3 | 4 | 16.667 | 10.274 | 0.724 | 8 | 9 | 30.000 | 21.583 | 0.725 | 14 | 16 | 53.333 | 68.182 | 0.247 | ||
| 吉 | 1 | 2 | 6.667 | 9.901 | 0.000 | 2 | 7 | 23.333 | 21.277 | 0.362 | 6 | 12 | 40.000 | 61.224 | 0.046 | ||
| 黑 | 0 | 0 | 0.000 | 0.000 | 0.000 | 2 | 3 | 10.000 | 20.408 | 0.000 | 3 | 10 | 33.333 | 58.824 | 0.000 | ||
| 沪 | 14 | 7 | 46.667 | 10.753 | 8.760 | 23 | 14 | 76.667 | 24.194 | 5.581 | 28 | 19 | 93.333 | 90.909 | 2.331 | ||
| 苏 | 13 | 8 | 43.333 | 10.714 | 6.120 | 20 | 14 | 66.667 | 23.622 | 2.073 | 27 | 18 | 90.000 | 90.909 | 1.636 | ||
| 浙 | 11 | 8 | 36.667 | 10.638 | 3.684 | 22 | 13 | 73.333 | 24.000 | 4.193 | 28 | 20 | 93.333 | 90.909 | 2.331 | ||
| 皖 | 4 | 6 | 20.000 | 10.309 | 0.000 | 15 | 14 | 50.000 | 22.727 | 0.266 | 25 | 20 | 83.333 | 83.333 | 0.939 | ||
| 闽 | 6 | 4 | 20.000 | 10.309 | 0.000 | 14 | 11 | 46.667 | 22.556 | 0.955 | 22 | 19 | 73.333 | 78.947 | 0.394 | ||
| 赣 | 2 | 7 | 23.333 | 10.345 | 0.038 | 9 | 11 | 36.667 | 22.059 | 0.000 | 20 | 20 | 66.667 | 75.000 | 0.135 | ||
| 鲁 | 11 | 7 | 36.667 | 10.490 | 1.712 | 21 | 15 | 70.000 | 23.810 | 3.019 | 27 | 21 | 90.000 | 90.909 | 1.636 | ||
| 豫 | 5 | 8 | 30.000 | 10.417 | 2.517 | 18 | 17 | 63.333 | 23.438 | 1.569 | 26 | 23 | 86.667 | 85.714 | 1.139 | ||
| 鄂 | 6 | 10 | 33.333 | 10.601 | 3.076 | 18 | 16 | 60.000 | 23.256 | 0.890 | 25 | 22 | 83.333 | 85.714 | 0.778 | ||
| 湘 | 2 | 7 | 23.333 | 10.345 | 0.038 | 13 | 14 | 53.333 | 22.901 | 0.824 | 23 | 21 | 76.667 | 81.081 | 0.418 | ||
| 粤 | 10 | 4 | 33.333 | 10.490 | 17.793 | 21 | 15 | 70.000 | 23.810 | 4.856 | 29 | 20 | 96.667 | 96.774 | 5.894 | ||
| 桂 | 0 | 1 | 3.333 | 9.772 | 0.000 | 4 | 9 | 30.000 | 21.277 | 0.561 | 16 | 18 | 60.000 | 71.429 | 0.042 | ||
| 琼 | 0 | 1 | 3.333 | 9.772 | 0.000 | 2 | 5 | 16.667 | 20.690 | 0.000 | 9 | 17 | 56.667 | 68.182 | 0.029 | ||
| 渝 | 1 | 2 | 6.667 | 9.836 | 4.828 | 9 | 14 | 50.000 | 22.727 | 1.396 | 24 | 23 | 80.000 | 83.333 | 0.908 | ||
| 川 | 1 | 1 | 3.333 | 9.202 | 0.000 | 10 | 12 | 50.000 | 22.727 | 2.753 | 26 | 22 | 86.667 | 88.235 | 3.961 | ||
| 贵 | 0 | 0 | 0.000 | 0.000 | 0.000 | 5 | 10 | 33.333 | 21.898 | 0.556 | 15 | 19 | 63.333 | 71.429 | 0.088 | ||
| 云 | 0 | 0 | 0.000 | 0.000 | 0.000 | 4 | 5 | 16.667 | 20.548 | 0.052 | 9 | 16 | 53.333 | 68.182 | 0.014 | ||
| 藏 | 0 | 0 | 0.000 | 0.000 | 0.000 | 0 | 0 | 0.000 | 0.000 | 0.000 | 0 | 2 | 6.667 | 50.847 | 0.000 | ||
| 陕 | 0 | 2 | 6.667 | 9.901 | 0.000 | 12 | 17 | 56.667 | 23.077 | 1.954 | 24 | 23 | 80.000 | 83.333 | 0.926 | ||
| 甘 | 0 | 0 | 0.000 | 0.000 | 0.000 | 2 | 4 | 13.333 | 20.690 | 0.000 | 7 | 19 | 63.333 | 71.429 | 0.349 | ||
| 青 | 0 | 0 | 0.000 | 0.000 | 0.000 | 0 | 0 | 0.000 | 0.000 | 0.000 | 1 | 8 | 26.667 | 55.556 | 0.000 | ||
| 宁 | 0 | 0 | 0.000 | 0.000 | 0.000 | 2 | 7 | 23.333 | 21.127 | 0.215 | 11 | 18 | 60.000 | 71.429 | 0.029 | ||
| 新 | 0 | 0 | 0.000 | 0.000 | 0.000 | 0 | 0 | 0.000 | 0.000 | 0.000 | 0 | 1 | 3.333 | 50.000 | 0.000 | ||
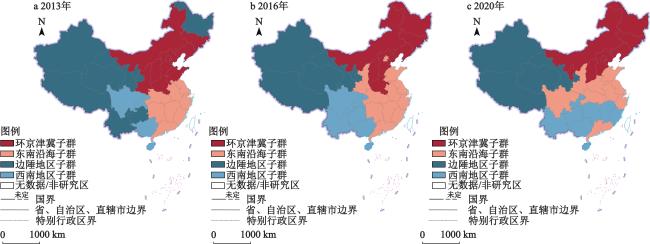
图4 2013—2020年中国省域数字经济空间关联网络的凝聚子群构成及其动态演变基于自然资源部标准地图服务网站下载的审图号GS (2020)4619标准地图制作,底图无修改;港澳台数据暂缺 Fig. 4 Composition of cohesive subgroups of China’s provincial digital economy spatial correlation network and its evolution from 2013 to 2020 |
表2 2013—2020年中国数字经济发展凝聚子群网络密度Table 2 Network density of cohesive subgroups of China’s digital economy development from 2013 to 2020 |
| 环京津冀子群 | 东南沿海子群 | 边陲地区子群 | 西南地区子群 | |
| 注:数据依次对应2013年、2016年和2020年,港澳台数据暂缺。 | ||||
| 环京津冀子群 | 0.400/0.548/0.778 | 0.122/0.308/0.600 | 0.000/0.029/0.222 | 0.000/0.000/0.292 |
| 东南沿海子群 | 0.167/0.495/0.889 | 0.694/0.917/1.000 | 0.000/0.092/0.425 | 0.083/0.462/0.975 |
| 边陲地区子群 | 0.000/0.000/0.056 | 0.000/0.031/0.075 | 0.000/0.100/0.167 | 0.000/0.000/0.031 |
| 西南地区子群 | 0.000/0.000/0.264 | 0.000/0.167/0.788 | 0.000/0.067/0.094 | 0.167/0.633/0.946 |
表3 2013—2020年QAP回归分析结果Table 3 Results of QAP regression analysis in 2013—2020 |
| 2013年 | 2014年 | 2015年 | 2016年 | 2017年 | 2018年 | 2019年 | 2020年 | |
| 注:回归分析系数为标准化系数;RE为经济发展水平、TI为科技创新、IS为产业结构、UL为城镇化水平、GS为政府支持、ICL为基础设施建设水平、HC为人力资本、GD为地理距离;样本数为930;*、**和***分别表示在10%、5%和1%水平上显著;港澳台数据暂缺。 | ||||||||
| RE | –0.289*** | –0.254*** | –0.236*** | –0.166*** | –0.042 | 0.016 | 0.011 | 0.012 |
| TI | 0.232*** | 0.235*** | 0.186*** | 0.201*** | 0.198*** | 0.175*** | 0.171*** | 0.175*** |
| IS | 0.153** | 0.128** | 0.126** | 0.102* | 0.113** | 0.104* | 0.088 | 0.084 |
| UL | 0.216** | 0.258** | 0.284*** | 0.199** | 0.115 | 0.097 | 0.078 | 0.059 |
| GS | –0.232** | –0.202** | –0.167** | –0.172** | –0.122* | –0.144** | –0.171*** | –0.188*** |
| ICL | –0.052 | –0.066* | –0.026 | –0.039 | –0.016 | –0.051 | –0.018 | 0.001 |
| HC | 0.154 | 0.102 | –0.009 | 0.038 | –0.010 | –0.028 | –0.013 | –0.004 |
| GD | –0.390*** | –0.451*** | –0.586*** | –0.595*** | –0.606*** | –0.629** | –0.649*** | –0.641*** |
| R2 | 0.287 | 0.338 | 0.457 | 0.468 | 0.489 | 0.554 | 0.580 | 0.577 |
| Adj R2 | 0.282 | 0.333 | 0.453 | 0.464 | 0.485 | 0.551 | 0.577 | 0.574 |
| [1] |
习近平. 不断做强做优做大中国数字经济[J]. 中国信息安全, 2022(1): 16-20.
Xi Jinping. Constantly strengthen, optimize and expand China’s digital economy. China Information Security, 2022(1): 16-20.
|
| [2] |
Tapscott D. The digital economy: Promise and peril in the age of networked intelligence [M]. New York: Mc Graw-Hill, 1996.
|
| [3] |
Remeikiene R, Gaspareniene L, Schneider F G. The definition of digital shadow economy[J]. Technological & Economic Development of Economy, 2017, 24(2): 696-717.
|
| [4] |
Vu K, Nguyen T. Exploring the contributors to the digital economy: Insights from Vietnam with comparisons to Thailand[J]. Telecommunications Policy, 2024, 48(1): 102664.
|
| [5] |
林跃勤. 新兴国家数字经济发展与合作[J]. 深圳大学学报(人文社会科学版), 2017, 34(4): 105-108.
Lin Yueqin. Development and collaboration in digital economy among emerging countries. Journal of Shenzhen University (Humanities & Social Sciences), 2017, 34(4): 105-108.
|
| [6] |
汪凡, 汪明峰. 基于格网的淘宝村集聚特征及影响因素分析[J]. 地理科学, 2020, 40(2): 229-237.
Wang Fan, Wang Mingfeng. Spatial aggregation characteristics and influencing factors of Taobao village based on grid in China. Scientia Geographica Sinica, 2020, 40(2): 229-237.
|
| [7] |
宋周莺, 刘卫东. 中国信息化发展进程及其时空格局分析[J]. 地理科学, 2013, 33(3): 257-265.
Song Zhouying, Liu Weidong. Spatio-temporal analysis of regional and provincial informatization in China. Scientia Geographica Sinica, 2013, 33(3): 257-265.
|
| [8] |
王彬燕, 田俊峰, 程利莎, 等. 中国数字经济空间分异及影响因素[J]. 地理科学, 2018, 38(6): 859-868.
Wang Binyan, Tian Junfeng, Cheng Lisha et al. Spatial differentiation of digital economy and its influencing factors in China. Scientia Geographica Sinica, 2018, 38(6): 859-868.
|
| [9] |
田俊峰, 王彬燕, 王士君, 等. 中国东北地区数字经济发展空间分异及成因[J]. 地域研究与开发, 2019, 38(6): 16-21.
Tian Junfeng, Wang Binyan, Wang Shijun et al. Spatial differentiation of urban digital economic development and its causes in Northeast China. Areal Research and Development, 2019, 38(6): 16-21.
|
| [10] |
郭峰, 王靖一, 王芳, 等. 测度中国数字普惠金融发展: 指数编制与空间特征[J]. 经济学(季刊), 2020, 19(4): 1401-1418.
Guo Feng, Wang Jingyi, Wang Fang et al. Measuring China’s digital financial inclusion: Index compilation and spatial characteristics. China Economic Quarterly, 2020, 19(4): 1401-1418.
|
| [11] |
王军, 朱杰, 罗茜. 中国数字经济发展水平及演变测度[J]. 数量经济技术经济研究, 2021, 38(7): 26-42.
Wang Jun, Zhu Jie, Luo Xi. Research on the measurement of China’s digital economy development and the characteristics. Journal of Quantitative & Technological Economics, 2021, 38(7): 26-42.
|
| [12] |
潘为华, 贺正楚, 潘红玉. 中国数字经济发展的时空演化和分布动态[J]. 中国软科学, 2021(10): 137-147.
Pan Weihua, He Zhengchu, Pan Hongyu. Research on spatiotemporal evolution and distribution dynamics of digital economy development in China. China Soft Science, 2021(10): 137-147.
|
| [13] |
Li Z Q, Liu Y. Research on the spatial distribution pattern and influencing factors of digital economy development in China[J]. IEEE Access, 2021(9): 63094-63106.
|
| [14] |
钟业喜, 毛炜圣. 长江经济带数字经济空间格局及影响因素[J]. 重庆大学学报(社会科学版), 2020, 26(1): 19-30.
Zhong Yexi, Mao Weisheng. Spatial differentiation of digital economy and its influencing factors in the Yangtze River Economic Belt. Journal of Chongqing University (Social Science Edition), 2020, 26(1): 19-30.
|
| [15] |
王胜鹏, 滕堂伟, 夏启繁, 等. 中国数字经济发展水平时空特征及其创新驱动机制[J]. 经济地理, 2022, 42(7): 33-43.
Wang Shengpeng, Teng Tangwei, Xia Qifan et al. The spatio-temporal characteristics of China’s digital economy development level and its driving mechanism of innovation. Economic Geography, 2022, 42(7): 33-43.
|
| [16] |
徐维祥, 周建平, 刘程军. 数字经济发展对城市碳排放影响的空间效应[J]. 地理研究, 2022, 41(1): 111-129.
Xu Weixiang, Zhou Jianping, Liu Chengjun. The impact of digital economy on urban carbon emissions: Based on the analysis of spatial effects. Geographical Research, 2022, 41(1): 111-129.
|
| [17] |
赵涛, 张智, 梁上坤. 数字经济、创业活跃度与高质量发展——来自中国城市的经验证据[J]. 管理世界, 2020, 36(10): 65-76.
Zhao Tao, Zhang Zhi, Liang Shangkun. Digital economy, entrepreneurship, and high-quality economic development: Empirical evidence from urban china. Journal of Management World, 2020, 36(10): 65-76.
|
| [18] |
陈修颖, 苗振龙. 数字经济增长动力与区域收入的空间分布规律[J]. 地理学报, 2021, 76(8): 1882-1894.
Chen Xiuying, Miao Zhenlong. Spatial distribution of digital economic growth dynamics and regional income. Acta Geographica Sinica, 2021, 76(8): 1882-1894.
|
| [19] |
杨炎. 国际对比视角下中国数字经济发展战略探索[J]. 科技管理研究, 2019, 39(19): 33-42.
Yang Yan. Exploration on development strategy of China’s digital economy from perspective of international comparison. Science and Technology Management Research, 2019, 39(19): 33-42.
|
| [20] |
余海华. 中国数字经济空间关联及其驱动因素研究[J]. 统计与信息论坛, 2021, 36(9): 23-34+44.
Yu Haihua. Study on spatial correlation of digital economy and its driving factors in China. Journal of Statistics and Information, 2021, 36(9): 23-34+44.
|
| [21] |
胡艳, 栗明钰, 唐睿. 长三角数字经济网络结构特征及影响因素[J]. 华东经济管理, 2022, 36(12): 26-34.
Hu Yan, Su Mingyu, Tang Rui. The structural characteristics and influencing factors of digital economy network in the Yangtze River Delta. East China Economic Management, 2022, 36(12): 26-34.
|
| [22] |
Bai C, Zhou L, Xia M et al. Analysis of the spatial association network structure of China’s transportation carbon emissions and its driving factors[J]. Journal of Environmental Management, 2020, 253: 109765.
|
| [23] |
王淑婧, 李俊峰. 长三角城市群高质量绿色发展的均衡性特征及障碍因素[J]. 自然资源学报, 2022, 37(6): 1540-1554.
Wang Shujing, Li Junfeng. Balanced characteristics and obstacle factors of high-quality green development in Yangtze River Delta Urban Agglomeration. Journal of Natural Resources, 2022, 37(6): 1540-1554.
|
| [24] |
王凯, 张淑文, 甘畅, 等. 中国旅游业碳排放效率的空间网络结构及其效应研究[J]. 地理科学, 2020, 40(3): 344-353.
Wang Kai, Zhang Shuwen, Gan Chang et al. Spatial network structure of carbon emission efficiency of tourism industry and its effects in China. Scientia Geographica Sinica, 2020, 40(3): 344-353.
|
| [25] |
张明斗, 翁爱华. 长江经济带城市水资源利用效率的空间关联网络及形成机制[J]. 地理学报, 2022, 77(9): 2353-2373.
Zhang Mingdou, Wen Aihua. Spatial correlation network and its formation mechanism of urban water utilization efficiency in the Yangtze River Economic Belt. Acta Geographica Sinica, 2022, 77(9): 2353-2373.
|
| [26] |
蔡海亚, 赵永亮, 南永清. 中国“互联网+”发展的空间关联网络及其影响因素——基于社会网络分析视角的实证研究[J]. 地理科学, 2021, 41(6): 933-940.
Cai Haiya, Zhao Yongliang, Nan Yongqing. The spatial correlation network of China’s ‘Internet plus’ development and its influencing factors: An empirical study based on the perspective of social network analysis. Scientia Geographica Sinica, 2021, 41(6): 933-940.
|
| [27] |
王珏, 陈雯, 袁丰. 基于社会网络分析的长三角地区人口迁移及演化[J]. 地理研究, 2014, 33(2): 385-400.
Wang Jue, Chen Wen, Yuan Feng. Human mobility and evolution based on social network: An empirical analysis of Yangtze River Delta. Geographical Research, 2014, 33(2): 385-400.
|
| [28] |
师博, 胡西娟. 高质量发展视域下数字经济推进共同富裕的机制与路径[J]. 改革, 2022(8): 76-86.
Shi Bo, Hu Xijuan. Mechanisms and paths of promoting common prosperity in digital economy from the perspective of high-quality development. Reform, 2022(8): 76-86.
|
| [29] |
张晨霞, 李荣林. 人口老龄化、数字经济与经济高质量发展[J]. 经济经纬, 2022, 39(5): 3-13.
Zhang Chenxia, Li Ronglin. Population aging, digital economy and high-quality economic development. Economic Survey, 2022, 39(5): 3-13.
|
| [30] |
李娟, 刘爱峰. 中国区域数字产业发展的平衡性分析[J]. 统计与信息论坛, 2022, 37(1): 3-12.
Li Juan, Liu Aifeng. Analysis on the balance of China’s regional digital industry development. Journal of Statistics and Information, 2022, 37(1): 3-12.
|
| [31] |
邱娟, 汪明峰. 进入21世纪以来中国互联网发展的时空差异及其影响因素分析[J]. 地域研究与开发, 2010, 29(5): 28-32+38.
Qiu Juan, Wang Mingfeng. The temporal-spatial differences and influencing factors of internet development in China since 2000. Areal Research and Development, 2010, 29(5): 28-32+38.
|
| [32] |
李彦龙, 沈艳. 数字普惠金融与区域经济不平衡[J]. 经济学(季刊), 2022, 22(5): 1805-1828.
Li Yanlong, Shen Yan. Digital financial inclusion and regional economic imbalance. China Economic Quarterly, 2022, 22(5): 1805-1828.
|
| [33] |
曾祥炎, 李姣, 曾小明. 要素禀赋与中西部地区数字经济可持续发展——基于机器学习方法[J]. 湖南科技大学学报(社会科学版), 2021, 24(6): 80-89.
Zeng Xiangyan, Li Jiao, Zeng Xiaoming. Factor endowment and the sustainable development of digital economy in the middle and west of China: Based on machine learning methods. Journal of Hunan University of Science and Technology (Social Science Edition), 2021, 24(6): 80-89.
|
| [34] |
杨文溥. 数字经济促进高质量发展: 生产效率提升与消费扩容[J]. 上海财经大学学报, 2022, 24(1): 48-60.
Yang Wenpu. Digital economy drives high-quality economic development: Efficiency improvement and consumption promotion. Journal of Shanghai University of Finance and Economics, 2022, 24(1): 48-60.
|
/
| 〈 |
|
〉 |