
双循环视域下制造业服务化与双重价值链及其提升效应的时空分异研究
|
王蓓(1989—),女,湖北武汉人,讲师,博士,主要从事产业经济与贸易研究。E-mail: 13640135@qq.com |
收稿日期: 2023-09-30
修回日期: 2023-12-02
网络出版日期: 2025-01-16
基金资助
湖北省教育厅基金项目(2024GB343)
江汉大学基金项目(XXZK04)
江汉大学基金项目(08660001)
版权
Spatio-temporal differences and enhancement effects of manufacturing servitization and double value chain under the perspectives of double circulation
Received date: 2023-09-30
Revised date: 2023-12-02
Online published: 2025-01-16
Supported by
Foundation of Hubei Provincial Department of Education(2024GB343)
Foundation of Jianghan University(XXZK04)
Foundation of Jianghan University(08660001)
Copyright
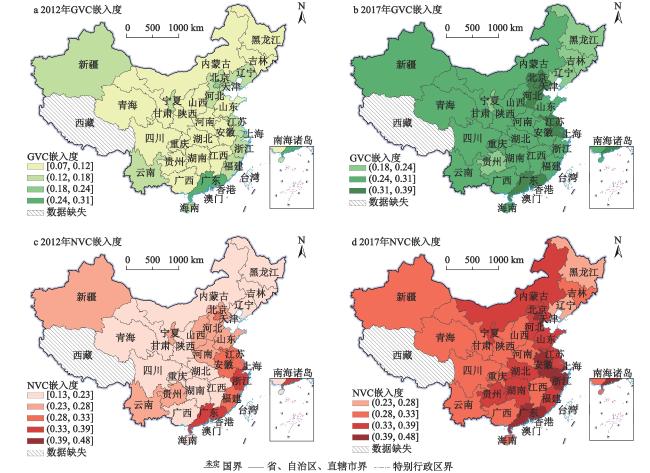
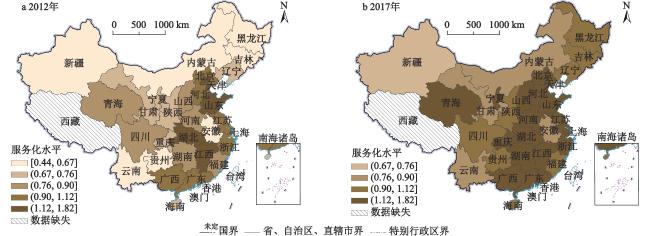
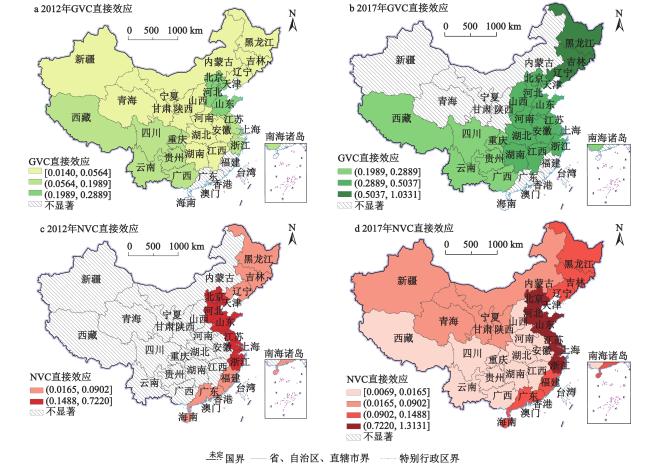
将中国各省域服务化、全球价值链(Global Value Chain, GVC)与国内价值链(National Value Chain, NVC)嵌入度纳入同一个测量框架下进行测量,实现服务化提升GVC与NVC双重嵌入度在双循环视域下的时空分异对比分析。结果表明:中国各省域制造业服务化与制造业GVC、NVC呈现高−高、低−低聚集的正向关联模式,服务化通过创新效率与生产成本中介而提升中国各省域的制造业GVC与NVC,对大部分区域NVC的提升效应较GVC的提升效应更高,中国京津冀及北部、东部地区等经济发展的极值地区的制造业GVC与NVC的服务化提升效应较为显著,源自亚洲其他国家的制造业服务化提升效应相较于源自其他地区的服务化更为显著。
王蓓 , 陈虹 . 双循环视域下制造业服务化与双重价值链及其提升效应的时空分异研究[J]. 地理科学, 2024 , 44(12) : 2123 -2133 . DOI: 10.13249/j.cnki.sgs.20230482
This study aims to delve into the intricate relationship between the service-oriented transformation of manufacturing industries and their integration within the global value chain (GVC) and national value chain (NVC) across Chinese provinces. Utilizing a unified measurement framework, this research incorporates data from Chinese provinces to analyze service-oriented transformation, GVC embedding, and NVC embedding. The findings reveal a distinct positive association pattern of high-high and low-low clustering between the service-oriented transformation of manufacturing industries and their positions within the GVC and NVC across Chinese provinces. The service-oriented transformation significantly enhances the GVC and NVC of manufacturing industries in Chinese provinces, primarily through the mediation effects of innovation efficiency and production costs. Notably, the enhancement effect on the NVC is higher than that on the GVC in most regions, suggesting a stronger internal dynamic within China’s economic structure. The service-oriented enhancement effect is most pronounced in economic pole areas, such as the Beijing-Tianjin-Hebei region and the northern and eastern parts of China. Additionally, service-oriented transformation originating from other Asian countries has a more significant enhancement effect on manufacturing industries compared to that from other regions.By considering the spatial and temporal effects, this study provides a comprehensive understanding of the service-oriented transformation's impact on the GVC and NVC of Chinese manufacturing industries.
表1 主要变量的统计性描述Table 1 Statistical description of the main variables |
| 变量 | 年份 | 均值 | 最大值 | 最小值 | 标准差 |
| 注:不含港澳台、西藏数据。 | |||||
| 国内价值链 | 2012 | 0.23 | 0.35 | 0.02 | 0.13 |
| 2015 | 0.34 | 0.75 | 0.07 | 0.10 | |
| 2017 | 0.41 | 0.94 | 0.03 | 0.15 | |
| 全球价值链 | 2012 | 0.66 | 0.72 | 0.07 | 0.58 |
| 2015 | 0.69 | 0.71 | 0.08 | 0.57 | |
| 2017 | 0.75 | 0.83 | 0.01 | 0.57 | |
| 服务化水平 | 2012 | 0.42 | 0.48 | 0.04 | 0.33 |
| 2015 | 0.50 | 0.67 | 0.01 | 0.26 | |
| 2017 | 0.57 | 0.72 | 0.01 | 0.57 | |
表2 服务化提升国内外价值链嵌入度的基本回归结果Table 2 Basic regression results of the enhancement of GVC and NVC through servicization |
| 2012年 | 全球价值链嵌入度模型 | 国内价值链嵌入度模型 | |||||
| 总效应 | 直接 | 间接 | 总效应 | 直接 | 间接 | ||
| 注:上述结果采取Matlab7.0、Stata15测算。*** 、** 、*表示在1% 、5% 、10%水平显著;括号内的数值为标准误;各组实证加入了控制变量,均通过了Hausman、Wald和LR检验;直接效应简称为直接、间接效应简称为间接;港澳台、西藏数据暂缺。 | |||||||
( | ( | – ( | ( | ( | – ( | ||
| – ( | – ( | – ( | ( | ( | ( | ||
( | ( | – ( | – ( | – ( | – ( | ||
( | ( | ( | ( | ( | ( | ||
| – ( | – ( | – ( | – ( | – ( | – ( | ||
| – ( | – ( | – ( | ( | ( | ( | ||
( | ( | ( | ( | ( | ( | ||
| 常数项 | ( | ( | |||||
| 观测值数量 | 496 | 496 | 496 | 496 | 496 | 496 | |
| R2 | |||||||
| 2015年 | 全球价值链嵌入度模型 | 国内价值链嵌入度模型 | |||||
| 总效应 | 直接 | 间接 | 总效应 | 直接 | 间接 | ||
( | ( | – ( | ( | ( | ( | ||
| – ( | ( | – ( | – ( | – ( | – ( | ||
| – ( | – ( | – ( | ( | ( | ( | ||
| – ( | – ( | – ( | ( | ( | ( | ||
| – ( | ( | – ( | ( | ( | ( | ||
| – ( | – ( | – ( | – ( | – ( | – ( | ||
( | ( | – ( | ( | ( | ( | ||
| 常数项 | ( | ( | |||||
| 观测值数量 | 553 | 553 | 553 | 553 | 553 | 553 | |
| R2 | |||||||
| 2017年 | 全球价值链嵌入度模型 | 国内价值链嵌入度模型 | |||||
| 总效应 | 直接 | 间接 | 总效应 | 直接 | 间接 | ||
( | ( | − ( | ( | ( | ( | ||
( | ( | ( | ( | ( | ( | ||
( | ( | – ( | ( | ( | – ( | ||
( | ( | – ( | ( | ( | ( | ||
| – ( | ( | – ( | ( | ( | – ( | ||
| – ( | – ( | ( | ( | ( | – ( | ||
| – ( | ( | – ( | ( | ( | – ( | ||
| 常数项 | ( | ( | |||||
| 观测值数量 | 522 | 522 | 522 | 522 | 522 | 522 | |
| R2 | |||||||
表3 服务投入来源异质性回归结果Table 3 Regression results with enhanced heterogeneity of servitization sources |
| 地区 | 国内价值链嵌入度NVC | 全球价值链嵌入度GVC | |||||
| 2012年 | 2015年 | 2017年 | 2012年 | 2015年 | 2017年 | ||
| 注:在置信区间为1% 、5% 、10%的显著性分别表示为*** 、** 、*。各组检验均控制了变量、通过Hausman、Wald、LR、Sobel的检验,因篇幅原因表中仅汇报直接效应回归结果;港澳台、西藏数据暂缺;括号内的数值为标准误。 | |||||||
| 美国 | ( | ( | ( | − ( | ( | ( | |
| 欧盟国家 | ( | ( | ( | ( | ( | ( | |
| 亚洲国家 | ( | ( | ( | ( | ( | ( | |
表4 影响机制回归结果Table 4 Regression results of impact mechanisms |
| 变量 | 全球价值链嵌入度模型 | 国内价值链嵌入度模型 | 全球价值链 嵌入度模型a | 国内价值链 嵌入度模型a | |||||||
| Inv为中 介变量 | Inv非中 介变量 | Cost为中 介变量 | Cost非中 介变量 | Inv为中 介变量 | Inv非中 介变量 | Cost为中 介变量 | Cost非中 介变量 | ||||
| 注:a表示Inv与Cost皆为中介变量;在置信区间为1% 、5% 、10%的显著性分别表示为*** 、** 、*;各组检验均控制了变量、通过Hausman、Wald、LR、Sobel的检验;港澳台、西藏数据暂缺;括号内的数值为标准误。 | |||||||||||
( | ( | ( | ( | ( | ( | ( | ( | ( | ( | ||
( | ( | ( | ( | ||||||||
( | ( | ( | ( | ||||||||
表5 稳健性检验回归结果Table 5 Robustness test regression results |
| 全样本 | 东部 | 京津冀及北部 | 南部 | 中部 | 西北部 | 西南部 | 东北部 | |
| 注:在置信区间为1% 、5% 、10%的显著性分别表示为*** 、** 、*;各组检验均控制了变量、通过Hausman、Wald、LR、Sobel的检验,因篇幅原因表中仅汇报直接效应回归结果;港澳台、西藏数据暂缺;括号内的数值为标准误。 | ||||||||
( | ( | ( | ( | ( | ( | ( | ( | |
| 全样本 | 东部 | 京津冀及北部 | 南部 | 中部 | 西北部 | 西南部 | 东北部 | |
( | ( | ( | ( | ( | ( | ( | ( | |
| [1] |
盛斌, 苏丹妮, 邵朝对. 全球价值链、国内价值链与经济增长: 替代还是互补[J]. 世界经济, 2020, 43(4): 3-27.
Sheng Bin, Su Danni, Shao Chaodui. Global value chain, national value chain and economic growth: Substitution or complementarity. The Journal of World Economy, 2020, 43(4): 3-27
|
| [2] |
黎峰. 增加值视角下的中国国家价值链分工——基于改进的区域投入产出模型[J]. 中国工业经济, 2016(3): 52-67.
Li Feng. Division of China’s national value chain on the perspective of value-added—Based on the modified regional input-output model. China Industrial Economics, 2016(3): 52-67
|
| [3] |
程大中. 中国服务业增长的特点、原因及影响——鲍莫尔·富克斯假说及其经验研究[J]. 中国社会科学, 2004(2): 18-32+204 [Cheng Dazhong. Features‚ causes and effects of service industry growth: Baumol-Fuchs Hypothesis and an empirical study. Social Sciences in China, 2004(2): 18-32+204.]
Cheng Dazhong. Features‚ causes and effects of service industry growth: Baumol-Fuchs Hypothesis and an empirical study. Social Sciences in China, 2004(2): 18-32+204.
|
| [4] |
吕云龙, 吕越. 制造业出口服务化与国际竞争力——基于增加值贸易的视角[J]. 国际贸易问题, 2017(5): 25-34.
Lyu Yunlong, Lyu Yue. Servitization of manufacturing export and international competitiveness—Based on the perspective of value added trade. Journal of International Trade, 2017(5): 25-34
|
| [5] |
金凤君, 姚作林. 新全球化与中国区域发展战略优化对策[J]. 世界地理研究, 2021, 30(1): 1-11
Jin Fengjun, Yao Zuolin. New globalization and China’s regional development strategy optimization. World Regional Studies, 2021, 30(1): 1-11
|
| [6] |
Koopman R, Zhi W, Wei S J. Tracing value-added and double counting in gross exports[J]. American Economic Review, 2014, 104(2): 459-494.
|
| [7] |
Wang Z, Wei S, Yu X et al. Characterizing global value chains: Production length and upstreamness[R]. Cambridge, England: NBER Working Paper, 2017.
|
| [8] |
孙立成, 程发新, 李群. 区域碳排放空间转移特征及其经济溢出效应[J]. 中国人口·资源与环境, 2014, 24(8): 17-23
Sun Licheng, Cheng Faxin, Li Qun. Characteristics and economic spillover effect of the regional carbon emissions transfer, China. Population Resource and Environment, 2014, 24(8): 17-23.
|
| [9] |
黄晓东, 杜德斌, 刘承良. 全球跨境并购网络的空间格局演化及形成机制[J]. 地理学报, 2021, 76(10): 2536-2550
Huang Xiaodong, Du Debin, Liu Chengliang. The evolution process and growth mechanism of global cross-border M&A network. Acta Geographica Sinica, 2021, 76(10): 2536-2550
|
| [10] |
贺灿飞, 任卓然, 王文宇. “双循环”新格局与京津冀高质量协同发展——基于价值链分工和要素流动视角[J]. 地理学报, 2022, 77(6): 1339-1358
He Canfei, Ren Zhuoran, Wang Wenyun. “Dual circulation” and Beijing-Tianjin-Hebei high-quality coordinated development: From the division in the value chain and factor mobility perspective[J]. Acta Geographica Sinica, 2022, 77(6): 1339-1358
|
| [11] |
Vandermerwe S, Rada J. Servitization of business: Adding value by adding services[J]. European Management Journal, 1988, 6(4): 314-324
|
| [12] |
刘斌, 赵晓斐. 制造业投入服务化、服务贸易壁垒与全球价值链分工[J]. 经济研究, 2020, 55(7): 159-174.
Liu Bin, Zhao Xiaofei. Servitization of manufacturing input, barriers to trade in services and division of the global value chains. Economic Research Journal, 2020, 55(7): 159-174
|
| [13] |
张涵嵋. 中国服务业国内价值链对“一带一路”区域价值链的影响研究[J]. 宏观经济研究, 2021(6): 50-61.
Zhang Hanmei. A study on the impact of China’s service industry domestic value chain on the regional value chain of ‘the Belt and Road’. Macroeconomics, 2021(6): 50-61
|
| [14] |
刘鹏, 夏炎. 我国各省增加值出口及其价值链嵌入研究——基于全球和国内价值链双视角[J]. 国际贸易问题, 2021(5): 109-126.
Liu Peng, Xia Yan. China’s provinces’ value-added export and embedding in value chains—From the perspective of global value chain and national value chain. Journal of International Trade, 2021(5): 109-126
|
| [15] |
李善同, 何建武, 刘云中. 全球价值链视角下中国国内价值链分工测算研究[J]. 管理评论, 2018, 30(5): 9-18.
Li Shantong, He Jianwu, Liu Yunzhong. Research on division of labor of China’sdomestic value chain from the perspective of global value chain. Management Review, 2018, 30(5): 9-18
|
| [16] |
黄群慧, 霍景东. 全球制造业服务化水平及其影响因素——基于国际投入产出数据的实证分析[J]. 经济管理, 2014, 36(1): 1-11
Huang Qunhui, Huo Jingdong. The servitization intensity of manufacturing and its influencing factors: Based on the world input-output data analysis. Economic Management, 2014, 36(1): 1-11.
|
| [17] |
Jones R W, Kierzkowski H. A framework for fragmentation[J]. New Production Patterns in the World Economy, 2001, 17-34.
|
| [18] |
White A L, Stoughton M, Feng L. Servicizing: The quiet transition to extended product responsibility[M]. Boston: Tellus Institute, 1999.
|
| [19] |
Reiskin E D, White A L, Johnson J. K. Servicizing the chemical supply chain[J]. Journal of Industrial Ecology, 1999, 3(2-3): 19-31
|
| [20] |
刘斌, 王乃嘉. 制造业投入服务化与企业出口的二元边际——基于中国微观企业数据的经验研究[J]. 中国工业经济, 2016(9): 59-74.
Liu Bin, Wang Naijia. Input servitization of manufacturing and dual margins of firms’ export—An empirical study based on the data of Chinese micro-enterprise. China Industrial Economics, 2016(9): 59-74
|
| [21] |
Wamba S F, Gunasekara A, Akter S et al. Big data analytics and firm performance: Effects of dynamic capabilities[J]. Journal of Business Research, 2017, 70(2): 356-365.
|
| [22] |
简兆权, 陈键宏, 郑雪云. 网络能力、关系学习对服务创新绩效的影响研究[J]. 管理工程学报, 2014, 28(3): 91-99
Jian Zhaoquan, Chen Jianhong, Zheng Xueyun. The impact of network competence and relationship learning on service innovation performance. Journal of Industrial Engineering and Engineering Management, 2014, 28(3): 91-99
|
| [23] |
窦大鹏, 匡增杰. 制造业服务化与全球价值链位置提升——基于制造业企业的分析[J]. 国际商务研究, 2022, 13(1): 46-58
Dou Dapeng, Kuang Zengjie. Servitization of manufacturing and upgrading of global value chain position: An analysis based on manufacturing companies. International Business Research, 2022, 13(1): 46-58
|
| [24] |
陈虹, 王蓓. 生产性服务化对制造业出口技术复杂度提升的影响研究——来自中国的经验分析[J]. 经济问题探索, 2021(9): 117-129.
Chen Hong, Wang Bei. Research on the impact of productive servicization on the increase of technical complexity of manufacturing exports —An empirical analysis from China. Inquiry Into Economic Issues, 2021(9): 117-129
|
| [25] |
李平, 张静婷, 王春晖. 生产性服务进口技术复杂度与企业生产率: 来自制造业上市公司的微观证据[J]. 世界经济研究, 2022(2): 104-136.
Li Ping, Zhang Jingting, Wang Chunhui. Technological sophistication of the import of producer services and firm productivity: Microscopic evidence from listed manufacturing firms. World Economy Studies, 2022(2): 104-136
|
| [26] |
国家统计局, 科学技术部. 中国科技统计年鉴[M]. 2013, 2016, 2018. 北京:中国统计出版社, 2013, 2016, 2018
National Bureau of Statistics, Ministry of Science and Technology. China statistical yearbook on science and technology. 2013, 2016, 2018. Beijing: China Statistics Press, 2013, 2016, 2018.
|
| [27] |
国家统计局,工业统计司.中国工业统计年鉴[M]. 2013, 2016. 北京: 中国统计出版社, 2013, 2016
National Bureau of Statistics, Department of Industrial Statistics. China industry statistical yearbook. 2013, 2016. Beijing: China Statistics Press, 2013, 2016.
|
| [28] |
国家统计局.中国统计年鉴2018[M]. 北京: 中国统计出版社, 2018
National Bureau of Statistics. China statistical yearbook 2018. Beijing:China Statistics Press, 2018.
|
| [29] |
陈虹, 王蓓. 生产性服务业进口技术复杂度对制造业出口质量的影响研究[J]. 国际贸易问题, 2020(9): 97-112.
Chen Hong, Wang Bei. Influence of technology complexity in producer service imports on the quality of manufacturing exports. Journal of International Trade, 2020(9): 97-112
|
| [30] |
余泳泽, 刘大勇, 宣烨. 生产性服务业集聚对制造业生产效率的外溢效应及其衰减边界——基于空间计量模型的实证分析[J]. 金融研究, 2016(2): 23-36.
Yu Yongze, Liu Dayong, Xuan Ye. The spatial spillover effect and regional damping boundary of productive services agglomeration on manufacturing productivity—Empirical research based on spatial econometric model. Journal of Financial Research, 2016(2): 23-36
|
| [31] |
潘文卿, 李跟强. 中国制造业国家价值链存在“微笑曲线”吗?——基于供给与需求双重视角[J]. 管理评论, 2018, 30(5): 19-28.
Pan Wenqing, Li Genqiang. Do the smile curves exist along the national value chains of Chinese manufacturing industries? A dual perspective of supply and demand linkages. Management Review, 2018, 30(5): 19-28
|
| [32] |
蔡海亚, 徐盈之. 贸易开放是否影响了中国产业结构升级?[J]. 数量经济技术经济研究, 2017, 34(10): 3-22.
Cai Haiya, Xu Yingzhi. Does trade openness affect the upgrading of China’s industrial structure. The Journal of Quantitative& Technical Economic, 2017, 34(10): 3-22
|
| [33] |
张陈宇, 孙浦阳, 谢娟娟. 生产链位置是否影响创新模式选择——基于微观角度的理论与实证[J]. 管理世界, 2020, 36(1): 45-59+233
Zhang Chenyu, Sun Puyang, Xie Juanjuan. Does the position of the production chain affect the choice of innovation modes? Theory and evidence based on micro perspective. Management World, 2020, 36(1): 45-59+233
|
/
| 〈 |
|
〉 |