
基于地表温度和遥感云平台的中国城市水体提取与时空演化研究
|
李楠(1991—),河南郑州人,女,博士研究生,主要从事土地利用遥感精细化提取和气候变化研究。E-mail: linan0716@henu.edu.cn |
收稿日期: 2023-07-10
修回日期: 2023-12-05
网络出版日期: 2025-01-16
基金资助
国家自然科学基金项目(42071415)
中原青年拔尖人才项目、河南省高校科技创新团队项目资助
版权
Urban surface water extraction and its spatial-temporal changes based on land surface temperature and remote sensing cloud platform in China
Received date: 2023-07-10
Revised date: 2023-12-05
Online published: 2025-01-16
Supported by
National Natural Science Foundation of China(42071415)
Central Plains Youth Top Talent Project, University Science and Technology Innovation Team Project in Henan Province
Copyright
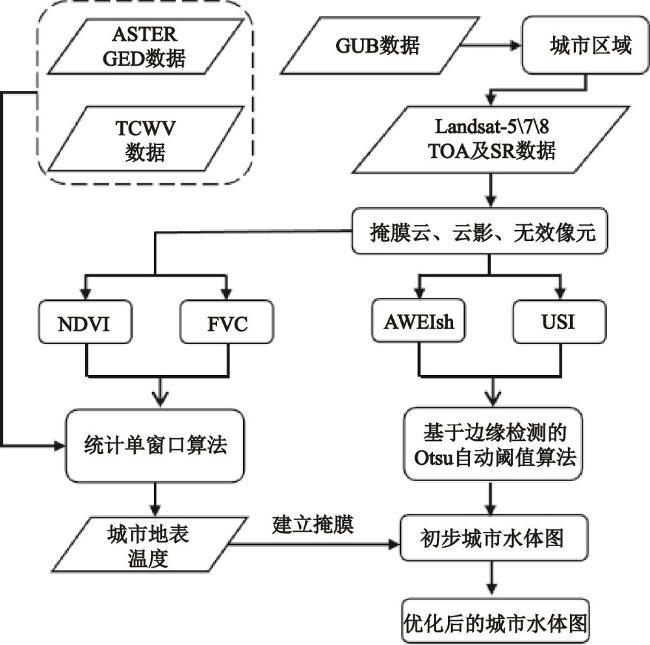
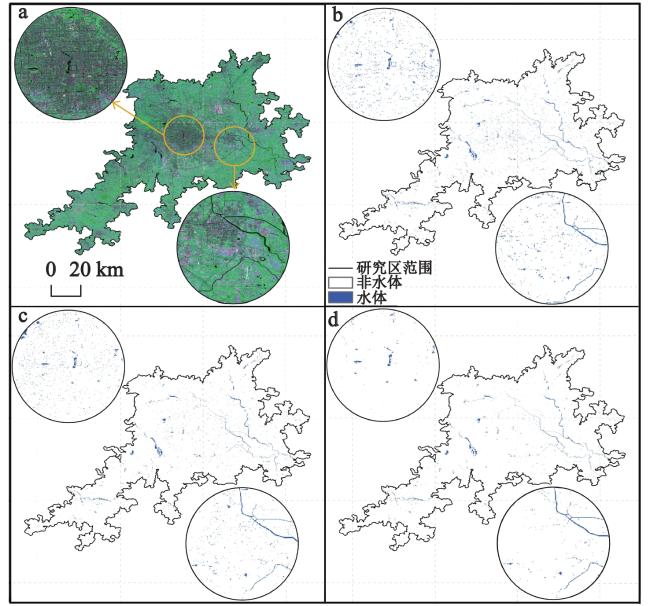
本文选取中国32个省会及以上城市建成区和香港特别行政区为研究区,基于Google Earth Engine(GEE)遥感大数据云平台技术,通过长时序Landsat遥感影像,结合传统水体指数和城市阴影指数构建了一个基于地表温度和混合指数的水体自动提取方法,并在
李楠 , 崔耀平 , 付一鸣 , 冉立山 , 刘小燕 , 史志方 , 周岩 . 基于地表温度和遥感云平台的中国城市水体提取与时空演化研究[J]. 地理科学, 2024 , 44(12) : 2205 -2214 . DOI: 10.13249/j.cnki.sgs.20230620
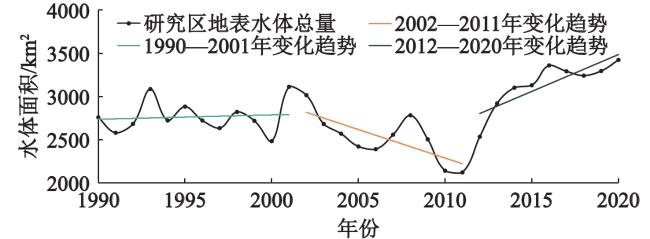
Urban surface water is increasingly important to urban ecology and development, but complex urban surface environment, shadow, and other noise interferences always restrict the extraction of urban surface water, and long time series urban surface water data sets are especially scarce. In order to reveal the real changes of surface water in major cities in China, this study selected 33 built-up areas of provincial capitals in China, inclding Hong Kong Special Administrative Region, as the study area. Based on Google Earth Engine (GEE) cloud computing platform for remote sensing big data, long time series Landsat remote sensing images were used. Combining traditional water index and urban shadow index, an automatic water extraction method with Land Surface Temperature (LST) was constructed. Based on 24 894 Landsat remote sensing images, annual surface water data with 30 m spatial resolution in major cities in China during 1990—2020 were automatically produced. The results showed that the overall accuracy of urban surface water extracted in this study was above 93%. During this study period, surface water showed an overall increasing trend, increasing from
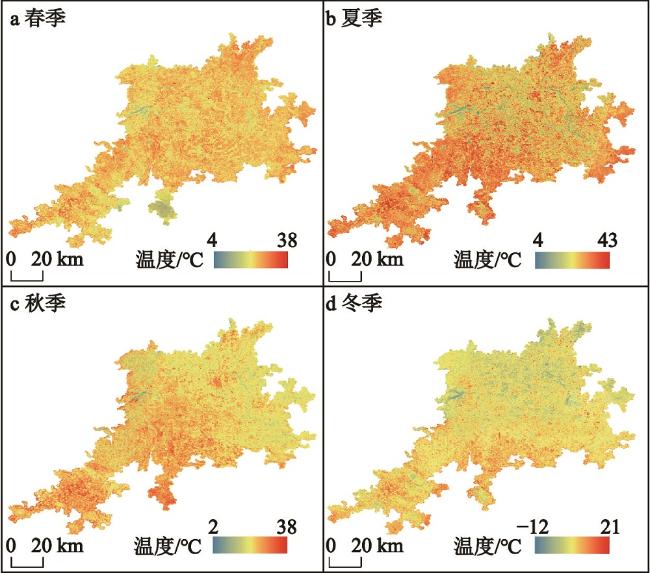
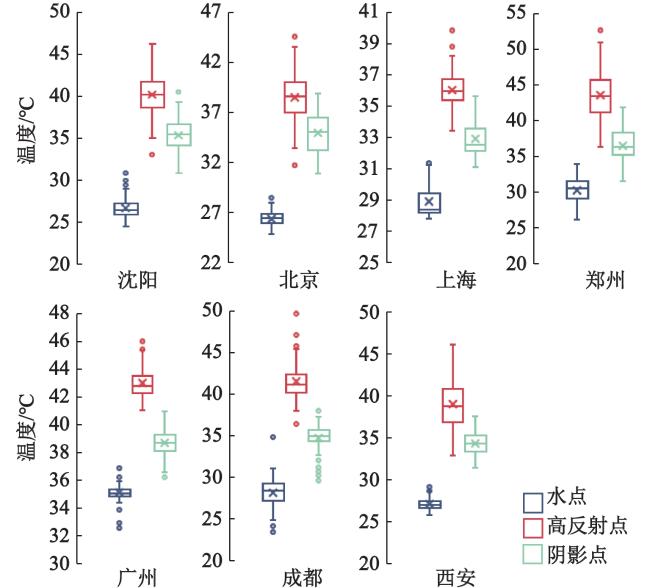
表1 北京四季地表温度反演结果对比/℃Table 1 Comparison of 4 seasons LST inversion in Beijing/℃ |
| 季节 | 春季 | 夏季 | 秋季 | 冬季 |
| 注: “差值绝对值”为高反射点和阴影点与水点均值之差的绝对值。 | ||||
| 最小值 | 3.96 | 4.15 | 2.19 | −12.08 |
| 最大值 | 37.75 | 42.71 | 37.59 | 20.80 |
| 均值 | 24.20 | 24.58 | 22.29 | 8.48 |
| 水点均值 | 17.25 | 23.49 | 19.07 | 9.58 |
| 高反射点均值 | 30.02 | 39.07 | 27.51 | 13.27 |
| 差值绝对值 | 12.77 | 15.58 | 8.43 | 3.69 |
| 阴影点均值 | 26.02 | 36.85 | 23.86 | 12.53 |
| 差值绝对值 | 8.78 | 13.36 | 4.79 | 2.95 |
表2 3种水体提取方法的精度对比Table 2 Precision comparison of three water extraction methods |
| 城市 | 方法 | 用户精度/% | 生产者精度/% | 总体精度/% | Kappa系数 | |||
| 水点 | 非水点 | 水点 | 非水点 | |||||
| 沈阳 | AWEIsh | 77.35 | 85.39 | 84.98 | 77.92 | 81.24 | 0.625 | |
| AWEIsh∩USI | 81.81 | 89.19 | 88.73 | 82.50 | 85.43 | 0.709 | ||
| AWEIsh∩USI+LST | 91.36 | 94.85 | 94.37 | 92.08 | 93.16 | 0.863 | ||
| 北京 | AWEIsh | 79.60 | 92.46 | 90.34 | 83.65 | 86.42 | 0.726 | |
| AWEIsh∩USI | 82.02 | 94.73 | 93.26 | 85.56 | 88.74 | 0.773 | ||
| AWEIsh∩USI+LST | 92.58 | 96.60 | 95.28 | 94.60 | 94.88 | 0.895 | ||
| 上海 | AWEIsh | 81.57 | 87.20 | 86.67 | 82.26 | 84.36 | 0.687 | |
| AWEIsh∩USI | 85.91 | 90.71 | 90.21 | 86.60 | 88.32 | 0.766 | ||
| AWEIsh∩USI+LST | 95.32 | 97.69 | 97.50 | 95.66 | 96.54 | 0.931 | ||
| 郑州 | AWEIsh | 73.39 | 81.82 | 81.14 | 74.25 | 77.47 | 0.550 | |
| AWEIsh∩USI | 82.07 | 87.44 | 86.29 | 83.50 | 84.80 | 0.696 | ||
| AWEIsh∩USI+LST | 94.63 | 96.98 | 95.71 | 96.20 | 96.00 | 0.918 | ||
| 广州 | AWEIsh | 83.64 | 87.72 | 86.83 | 84.71 | 85.71 | 0.714 | |
| AWEIsh∩USI | 87.31 | 90.35 | 89.52 | 88.29 | 88.87 | 0.777 | ||
| AWEIsh∩USI+LST | 96.45 | 95.49 | 94.92 | 96.86 | 95.94 | 0.919 | ||
| 成都 | AWEIsh | 86.25 | 90.38 | 89.23 | 87.67 | 88.39 | 0.767 | |
| AWEIsh∩USI | 89.93 | 93.49 | 92.69 | 91.00 | 91.79 | 0.835 | ||
| AWEIsh∩USI+LST | 95.11 | 97.62 | 97.31 | 95.67 | 96.43 | 0.928 | ||
| 西安 | AWEIsh | 88.15 | 92.41 | 91.54 | 89.33 | 90.36 | 0.807 | |
| AWEIsh∩USI | 92.05 | 94.26 | 93.46 | 93.00 | 93.21 | 0.864 | ||
| AWEIsh∩USI+LST | 96.17 | 96.99 | 96.54 | 96.67 | 96.61 | 0.932 | ||
表3 1990—2020年中国七大分区内省会城市地表水体面积变化情况/km2Table 3 Area changes of surface water bodies in provincial capitals in China’s 7 major sub-regions from 1990 to 2020/km2 |
| 年份 | 东北 | 华北 | 华中 | 华东 | 西南 | 西北 | 华南 |
| 1990 | 96.93 | 374.80 | 489.11 | 577.86 | 103.39 | 49.38 | |
| 1991 | 99.86 | 367.92 | 462.79 | 546.57 | 85.25 | 42.85 | 974.67 |
| 1992 | 89.56 | 334.97 | 436.71 | 609.71 | 79.23 | 39.58 | |
| 1993 | 70.88 | 334.59 | 504.57 | 623.34 | 111.70 | 49.2 | |
| 1994 | 77.48 | 324.62 | 358.60 | 624.60 | 101.39 | 44.29 | |
| 1995 | 88.24 | 318.08 | 454.87 | 560.98 | 112.54 | 46.64 | |
| 1996 | 87.97 | 319.57 | 425.45 | 539.51 | 90.13 | 43.33 | |
| 1997 | 95.29 | 297.99 | 372.32 | 593.52 | 88.74 | 32.23 | |
| 1998 | 82.07 | 297.14 | 476.13 | 542.01 | 106.39 | 64.23 | |
| 1999 | 87.90 | 351.74 | 410.65 | 570.02 | 112.34 | 50.92 | |
| 2000 | 81.61 | 360.36 | 403.50 | 569.32 | 107.83 | 61.66 | 898.29 |
| 2001 | 72.67 | 383.65 | 427.96 | 644.85 | 100.96 | 45.38 | |
| 2002 | 76.30 | 337.16 | 402.68 | 686.12 | 102.86 | 47.74 | |
| 2003 | 76.13 | 312.52 | 423.22 | 612.54 | 98.62 | 55.67 | |
| 2004 | 90.34 | 331.22 | 421.68 | 640.44 | 97.36 | 40.47 | 947.79 |
| 2005 | 95.62 | 332.25 | 324.21 | 590.88 | 81.58 | 52.27 | 944.63 |
| 2006 | 101.58 | 303.04 | 330.12 | 592.57 | 79.90 | 48.99 | 934.31 |
| 2007 | 103.54 | 294.72 | 331.69 | 496.84 | 87.47 | 49.09 | |
| 2008 | 95.70 | 272.61 | 412.10 | 602.79 | 104.45 | 66.84 | |
| 2009 | 92.20 | 228.99 | 367.14 | 626.10 | 121.46 | 47.90 | |
| 2010 | 99.01 | 195.40 | 354.25 | 528.04 | 103.51 | 56.93 | 802.85 |
| 2011 | 104.28 | 178.49 | 291.96 | 548.41 | 116.22 | 44.78 | 837.01 |
| 2012 | 104.59 | 187.79 | 353.60 | 513.50 | 131.01 | 57.25 | |
| 2013 | 115.31 | 219.09 | 422.83 | 640.20 | 148.50 | 81.72 | |
| 2014 | 137.54 | 287.52 | 400.20 | 734.56 | 197.86 | 85.61 | |
| 2015 | 145.02 | 312.38 | 419.98 | 790.82 | 172.37 | 98.39 | |
| 2016 | 137.26 | 393.18 | 467.52 | 829.46 | 181.57 | 85.63 | |
| 2017 | 146.99 | 377.04 | 449.44 | 801.22 | 186.11 | 91.59 | |
| 2018 | 149.10 | 376.32 | 417.19 | 786.04 | 187.54 | 100.66 | |
| 2019 | 145.41 | 385.30 | 421.49 | 795.78 | 185.54 | 97.47 | |
| 2020 | 158.10 | 398.03 | 458.21 | 824.98 | 184.86 | 104.71 |
| [1] |
Yang X C, Qin Q M, Grussenmeyer P et al. Urban surface water body detection with suppressed built-up noise based on water indices from Sentinel-2 MSI imagery[J]. Remote Sensing of Environment, 2018, 219: 259-270
|
| [2] |
Chen F, Chen X Z, Van de Voorde T et al. Open water detection in urban environments using high spatial resolution remote sensing imagery[J]. Remote Sensing of Environment, 2020, 242: 111706.
|
| [3] |
Marlow D R., Moglia M, Cook S et al. Towards sustainable urban water management: A critical reassessment[J]. Water Research, 2013, 47(20): 7150-7161
|
| [4] |
Yang X Y, Chen Y, Wang J Z. Combined use of Sentinel-2 and Landsat 8 to monitor water surface area dynamics using Google Earth Engine[J]. Remote Sensing Letters, 2020, 11(7): 687-696
|
| [5] |
Fisher A, Flood N, Danaher D. Comparing landsat water index methods for automated water classification in eastern Australia[J]. Remote Sensing of Environment, 2016, 175: 167-182
|
| [6] |
Aires F, Prigent E, Fluet-Chouinard D et al. Comparison of visible and multi-satellite global inundation datasets at high-spatial resolution[J]. Remote Sensing of Environment, 2018, 216: 427-441
|
| [7] |
Lu S L, Ma J, Ma X Q et al. Time series of the Inland Surface Water Dataset in China (ISWDC) for 2000—2016 derived from MODIS archives[J]. Earth System Science Data, 2019, 11(3): 1099-1108
|
| [8] |
Murray N J, Phinn S R, Dewitt M et al. The global distribution and trajectory of tidal flats[J]. Nature, 2019, 565(7738): 222-225
|
| [9] |
Wang X, Xiao X M, Zhou Z H et al. Gainers and losers of surface and terrestrial water resources in China during 1989—2016[J]. Nature Communications, 2020, 11(1): 1-12
|
| [10] |
Goldblatt R, Stuhlmacher M, Tellman B et al. Using Landsat and nighttime lights for supervised pixel-based image classification of urban land cover[J]. Remote Sensing of Environment, 2018, 205: 253-275
|
| [11] |
Arvor D, Daher Felipe R G, Briand D et al. Monitoring thirty years of small water reservoirs proliferation in the southern Brazilian Amazon with landsat time series[J]. ISPRS Journal of Photogrammetry and Remote Sensing, 2018, 145: 225-237
|
| [12] |
Tulbure M G, Broich M. Spatiotemporal dynamic of surface water bodies using landsat time-series data from 1999 to 2011[J]. ISPRS Journal of Photogrammetry and Remote Sensing, 2013, 79: 44-52
|
| [13] |
Zhou Y, Dong J W, Xiao X M et al. Continuous monitoring of lake dynamics on the Mongolian Plateau using all available Landsat imagery and Google Earth Engine[J]. Science of the Total Environment, 2019, 689: 366-380
|
| [14] |
Pekel J F, Cottam A, Gorelick N et al. High-resolution mapping of global surface water and its long-term changes[J]. Nature, 2016, 540: 418-422
|
| [15] |
Wang X B, Xie S P, Zhang X L et al. A robust Multi-Band Water Index (MBWI) for automated extraction of surface water from Landsat 8 OLI imagery[J]. International Journal of Applied Earth Observation and Geoinformation, 2018, 68: 73-91
|
| [16] |
Wu W, Li Q, Zhang Y et al. Two-Step Urban Water Index (TSUWI): A new technique for high-resolution mapping of urban surface water[J]. Remote Sensing, 2018, 10(11): 1704.
|
| [17] |
Xu H. Modification of normalised difference water index (NDWI) to enhance open water features in remotely sensed imagery[J]. International Journal of Remote Sensing, 2006, 27(14): 3025-3033
|
| [18] |
Wang S, Baig M H A, Zhang L F et al. A simple Enhanced Water Index (EWI) for percent surface water estimation using Landsat data[J]. IEEE Journal of Selected Topics in Applied Earth Observations and Remote Sensing, 2015, 8(1): 90-97
|
| [19] |
Xie C, Huang X, Zeng W X et al. A novel water index for urban high-resolution eight-band WorldView-2 imagery[J]. International Journal of Digital Earth, 2016, 9(10): 925-941
|
| [20] |
Gorelick N, Hancher M, Dixon M et al. Google Earth Engine: Planetary-scale geospatial analysis for everyone[J]. Remote Sensing of Environment, 2017, 202: 18-27
|
| [21] |
李丹, 吴保生, 陈博伟, 等. 基于卫星遥感的水体信息提取研究进展与展望[J]. 清华大学学报: 自然科学版, 2020, 60(2): 147-161.
Li Dan, Wu Baosheng, Chen Bowei et al. Review of water body information extraction based on satellite remote sensing. Journal of Tsinghua University: Science and Technology, 2020, 60(2): 147-161
|
| [22] |
Seto K C, Güneralp B, Hutyra L R. Global forecasts of urban expansion to 2030 and direct impacts on biodiversity and carbon pools[J]. Proceedings of the National Academy of Sciences, 2012, 109(40): 16083-16088
|
| [23] |
Cui Y P, Liu J Y, Xu X L et al. Accelerating cities in an unsustainable landscape: Urban expansion and cropland occupation in China, 1990—2030[J]. Sustainability, 2019, 11(8): 2283.
|
| [24] |
Gong P, Li X C, Wang J et al. Annual maps of global artificial impervious area (GAIA) between 1985 and 2018[J]. Remote Sensing of Environment, 2020, 236: 111510.
|
| [25] |
Li X C, Gong P, Zhou Y Y et al. Mapping global urban boundaries from the global artificial impervious area (GAIA) data[J]. Environmental Research Letters, 2020, 15(9): 094044.
|
| [26] |
Jin J X, Wang Y, Jiang H et al. Improvement of ecological geographic regionalization based on remote sensing and canonical correspondence analysis: A case study in China[J]. Science China Earth Sciences, 2016, 59(9): 1745-1753
|
| [27] |
Foga S, Scaramuzza P, Guo S et al. Cloud detection algorithm comparison and validation for operational landsat data products[J]. Remote Sensing of Environment, 2017, 194: 379-390
|
| [28] |
Roy D P, Kovalskyy V, Zhang H K et al. Characterization of Landsat-7 to Landsat-8 reflective wavelength and normalized difference vegetation index continuity[J]. Remote Sensing of Environment, 2016, 185: 57-70
|
| [29] |
Feyisa G L, Meilby H, Fensholt R et al. Automated Water Extraction Index: A new technique for surface water mapping using Landsat imagery[J]. Remote Sensing of Environment, 2014, 140: 23-35
|
| [30] |
Ermida S L, Soares P, Mantas V et al. Google Earth Engine open-source code for land surface temperature estimation from the landsat series[J]. Remote Sensing, 2020, 12(9): 1471.
|
| [31] |
Donchyts G, Schellekens J, Winsemius H et al. A 30 m resolution surface water mask including estimation of positional and thematic differences using Landsat 8, SRTM and OpenStreetMap: A case study in the Murray-Darling Basin, Australia[J]. Remote Sensing, 2016, 8(5): 386.
|
| [32] |
Yang X, Qin Q M, Yesou H et al. Monthly estimation of the surface water extent in France at a 10-m resolution using Sentinel-2 data[J]. Remote Sensing of Environment, 2020, 244: 111803.
|
| [33] |
Shahi K, Shafri K Z M, Taherzadeh E. A novel spectral index for automatic shadow detection in urban mapping based on WorldView-2 satellite imagery[J]. International Journal of Computer, Electrical, Automation, Control and Information Engineering, 2014, 8(10): 1769-1772.
|
| [34] |
Liu Y L, Zhang X H, Kong X S et al. Identifying the relationship between urban land expansion and human activities in the Yangtze River Economic Belt, China[J]. Applied Geography, 2018, 94: 163-177
|
| [35] |
金光振, 金光明. 华北干旱缺水的现状与成因探索[J]. 安全与环境工程, 2003, 10(2): 20-23
Jin Guangzhen, Jin Guangming. The present situation of aridness and lack of water resources in north China and the probe into its causes. Safety and Environmental Engineering, 2003, 10(2): 20-23
|
| [36] |
Jiang Y. China’s water scarcity[J]. Journal of Environmental Management, 2009, 90(11): 3185-3196
|
| [37] |
韩亦方. 描绘中国水资源南北贯通的大蓝图[J]. 南水北调与水利科技, 2003, (z1): 18-20
Hang Yifang. A blueprint for the north-south connection of China’s water resources. South-to-North Water Transfers and Water Science & Technology. 2003, (Z1): 18-20.
|
| [38] |
俞孔坚, 张蕾. 黄泛平原区适应性“水城”景观及其保护和建设途径[J]. 水利学报, 2008, 39(6): 688-696
Yu Kongjian, Zhang Lei. Preservation and development of water cities adaptive to the areas flooded by the Yellow River. Journal of Hydraulic Engineering, 2008, 39(6): 688-696
|
| [39] |
吴江华, 刘康, 张红娟, 等. 西安市主城区景观格局演变对地表径流的影响[J]. 水土保持通报, 2021, 41(4): 83-92.
Wu Jianghua, Liu Kang, Zhang Hongjuan et al. Impacts of landscape pattern changes on surface runoff in main urban area of Xi’an City. Bulletin of Soil and Water Conservation, 2021, 41(4): 83-92
|
| [40] |
文超, 詹庆明, 樊智宇, 等. 1979—2019年武汉市重点水体多要素协同的时空演变特征[J]. 地球信息科学学报, 2021, 23(11): 2055-2072
Wen Chao, Zhan Qingming, Fan Zhiyu et al. Spatiotemporal characteristics of multi-factor synergy in urban key water bodies of Wuhan from 1979 to 2019. Journal of Geo-information Science, 2021, 23(11): 2055-2072.
|
/
| 〈 |
|
〉 |