
数字经济对中国省域人类福祉碳强度的影响及空间溢出效应分析
|
王圣云(1977—),男,山西河曲人,研究员,博士,主要从事区域经济与福祉地理学研究。E-mail: wangshengyun@163.com |
收稿日期: 2024-01-10
修回日期: 2024-05-12
网络出版日期: 2025-04-29
版权
Impact and spatial spillover effect of digital economy on carbon intensity of human well-being in China
Received date: 2024-01-10
Revised date: 2024-05-12
Online published: 2025-04-29
Copyright
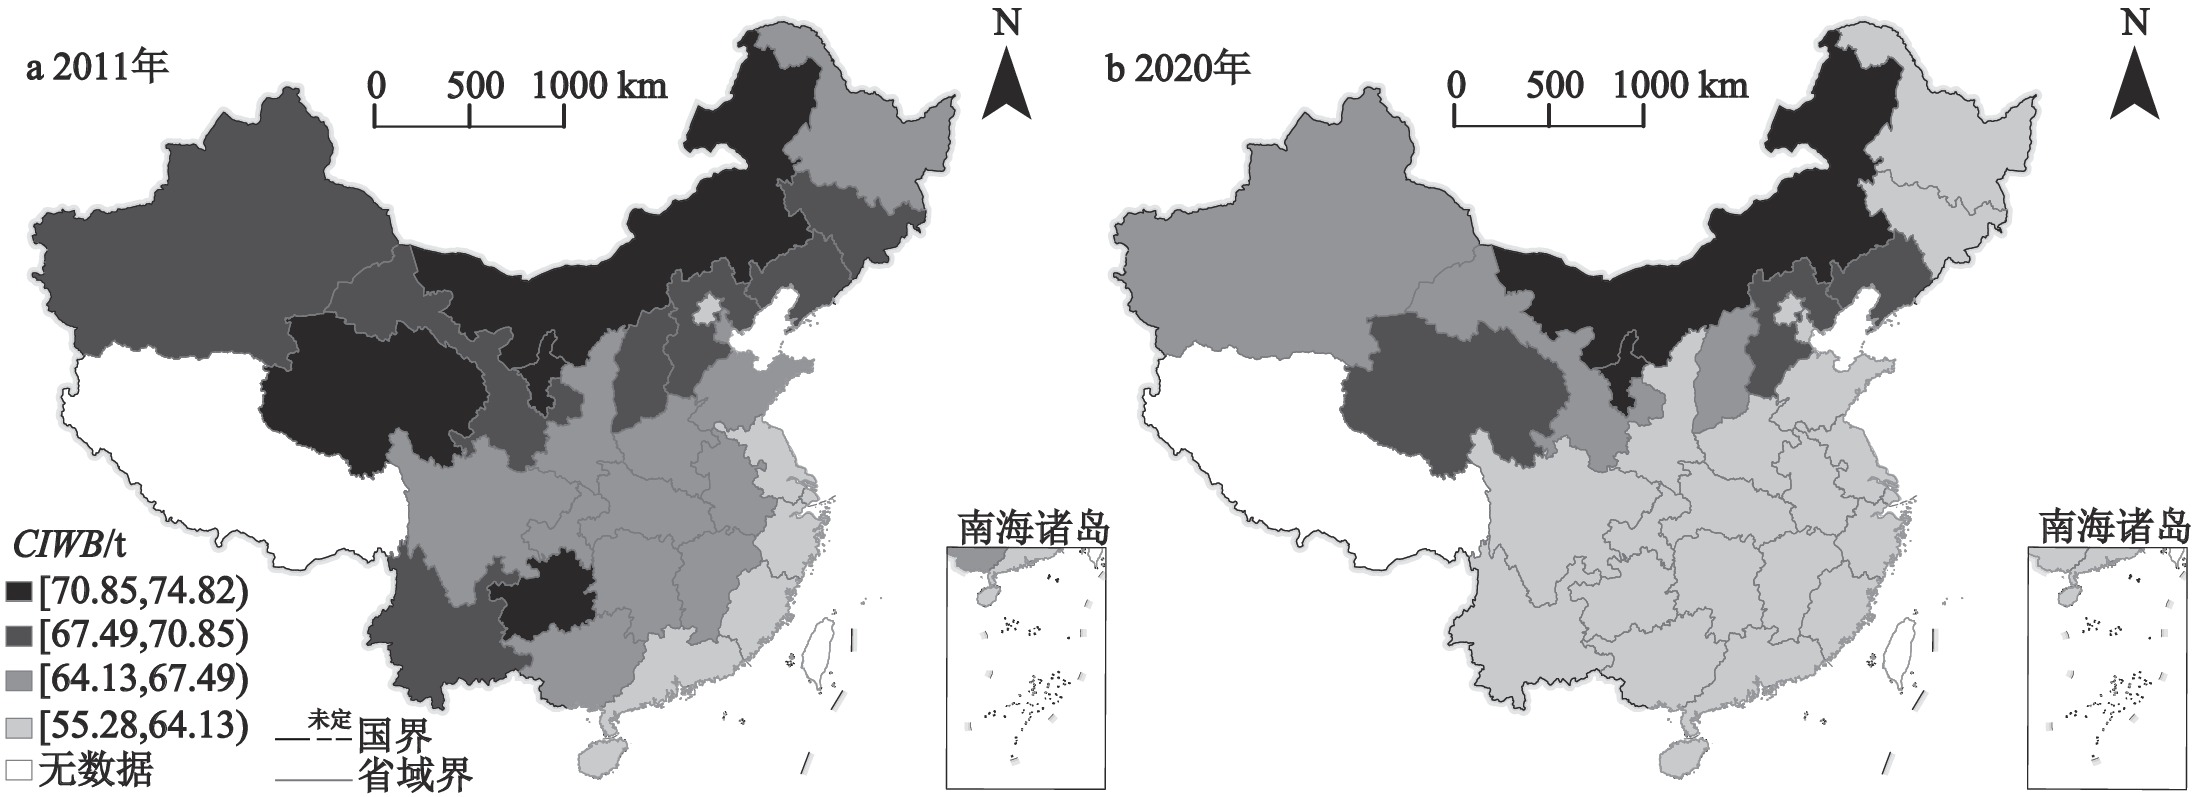
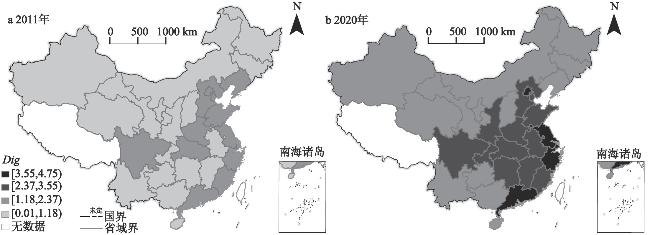
数字经济是驱动碳减排和人类福祉提升的重要力量,也是实现中国经济高质量发展的新动能。本文构建并测度了2011—2020年中国省域数字经济发展指数和人类福祉碳强度,分析了数字经济对中国省域人类福祉碳强度的影响及其空间溢出效应。研究表明:①2011—2020年,中国省域数字经济发展水平显著提升,形成“西低东高”空间格局;而人类福祉碳强度明显降低,呈“北高南低”空间特征。②发展数字经济能够显著降低中国人类福祉碳强度,数字经济发展指数每提高1单位,人类福祉碳强度相应降低1.138单位。数字经济通过降低用电能耗与产业结构升级来降低人类福祉碳强度,人均用电量、第三产业占比每提高1单位,中国人类福祉碳强度分别降低0.645、0.083单位,降低用电能耗的促减效应明显更强。③数字经济对中国省域人类福祉碳强度的促降作用存在空间溢出效应,发展数字经济对本省及邻近省域的人类福祉碳强度具有显著降低作用。建议缩小中国数字经济的东西差距与人类福祉碳强度的南北差异,发挥数字经济的空间溢出效应,减少用电能耗,推进产业结构升级,降低中国人类福祉碳强度。
王圣云 , 房方 , 王石 . 数字经济对中国省域人类福祉碳强度的影响及空间溢出效应分析[J]. 地理科学, 2025 , 45(5) : 950 -962 . DOI: 10.13249/j.cnki.sgs.20230907
This study constructs and assesses the digital economy development index and the carbon intensity of human well-being (CIWB) in China from 2011 to 2020, elucidates the driving mechanism and spatial spillover effect of digital economy on the CIWB in China. The findings indicate that: 1) From 2011 to 2020, there is a marked advancement in the level of digital economic development in China, delineating a spatial distribution characterized by “lower in the west and higher in the east”. Concurrently, the CIWB displayed a notable decline, exhibiting a “higher in the north and lower in the south” spatial pattern. 2) The cultivation of the digital economy significantly diminishes the CIWB in China. For every unit increase in the digital economy development index, the CIWB decreases by 1.138 units. The digital economy curtails the CIWB through the reduction of electricity consumption and industrial structural upgrades. An increase of one unit in the per capita electricity consumption and tertiary industry’s proportion leads to a decrease in the CIWB by 0.645 and 0.083 units, respectively, with the former demonstrating a more pronounced mitigating impact. 3) The digital economy’s efficacy in reducing the CIWB in China exhibits spatial spillover effects, evident in its significant contributory reduction in both the province and its neighboring regions. It is advised to concentrate efforts on narrowing the east-west gap in the level of development of digital economy and the north-south difference in the CIWB in China, to bring into play the spatial spillover effect of the digital economy, and to reduce electricity energy consumption and promote the upgrading of industrial structure, so as to reduce the CIWB in China.
表1 2011—2020年中国省域NPC′、HDI及CIWB均值Table 1 Mean value of net carbon dioxide emissions per capita (NPC'), HDI and CIWB in China, 2011—2020 |
| 年份 | NPC′/t | HDI | CIWB/t |
| 2011 | 54.066 | 0.808 | 66.992 |
| 2012 | 54.295 | 0.814 | 66.803 |
| 2013 | 54.245 | 0.818 | 66.417 |
| 2014 | 54.357 | 0.834 | 65.240 |
| 2015 | 54.377 | 0.837 | 65.076 |
| 2016 | 54.361 | 0.842 | 64.620 |
| 2017 | 54.364 | 0.850 | 64.025 |
| 2018 | 54.290 | 0.858 | 63.397 |
| 2019 | 54.493 | 0.865 | 63.078 |
| 2020 | 54.512 | 0.871 | 62.668 |
注:NPC′为净人均二氧化碳排放量指数,HDI为人类发展指数,CIWB为人类福祉碳强度;未含西藏、港澳台数据。 |
表2 基准回归结果Table 2 Benchmark regression results |
| 方程(1) | 方程(2) | 方程(3) | 方程(4) | 方程(1) | 方程(2) | 方程(3) | 方程(4) | |||
| Dig | –1.606*** | –0.766*** | –0.776** | –1.138*** | Roa | 0.103*** | –0.076 | –0.042 | –0.069 | |
| (0.340) | (0.284) | (0.335) | (0.355) | (0.026) | (0.054) | (0.043) | (0.053) | |||
| lnPop | –1.487*** | 6.633*** | 0.458 | 7.604*** | EI | 2.297*** | 2.029*** | 2.634*** | 2.237*** | |
| (0.353) | (2.140) | (0.636) | (2.171) | (0.152) | (0.414) | (0.310) | (0.412) | |||
| lnFin | 0.114 | –0.475** | –0.528** | –0.655** | 常数项 | 78.207*** | 21.237 | 70.073*** | 14.901 | |
| (0.353) | (0.236) | (0.248) | (0.264) | (2.168) | (16.773) | (4.926) | (16.937) | |||
| Tef | –2.339*** | –0.626* | –0.585* | –0.595* | 省份固定 | 否 | 是 | 否 | 是 | |
| (0.458) | (0.323) | (0.313) | (0.312) | 年份固定 | 否 | 否 | 是 | 是 | ||
| lnPG | –1.305** | –3.331*** | –2.863*** | –3.583*** | R2 | 0.781 | 0.823 | 0.835 | 0.842 | |
| (0.537) | (0.752) | (0.795) | (1.184) |
注:括号内数值是标准误,***、**和*分别表示回归结果在1%、5%和10%置信水平下通过显著性检验。Dig为数字经济发展指数,lnPop为人口规模,lnFin为固定资产投资水平,Tef为技术对外开放程度,lnPG为经济发展水平,Roa为交通设施条件,EI为能源强度;观测值均为300;未含西藏、港澳台数据。 |
表3 作用机制检验结果Table 3 Results of mechanism test |
| 方程(1) | 方程(2) | 方程(3) | 方程(4) | 方程(5) | |
| Dig | –1.138*** | 0.032** | –1.056*** | –0.154*** | –0.495 |
| (0.355) | (0.016) | (0.356) | (0.027) | (0.359) | |
| IS | –2.597* | ||||
| (1.407) | |||||
| SE | 4.186*** | ||||
| (0.794) | |||||
| Z | 控制 | 控制 | 控制 | 控制 | 控制 |
| 常数项 | 14.901 | 0.330 | 15.758 | –6.965*** | 44.057** |
| (16.937) | (0.752) | (16.864) | (1.274) | (17.029) | |
| 省份固定 | 是 | 是 | 是 | 是 | 是 |
| 年份固定 | 是 | 是 | 是 | 是 | 是 |
| R2 | 0.842 | 0.676 | 0.844 | 0.679 | 0.858 |
注:括号内数值是标准误,***、**和*分别表示回归结果在1%、5%和10%置信水平下通过显著性检验;Dig为数字经济发展指数,IS为产业结构升级,SE为用电能耗,Z为控制变量;观测值均为300;未含西藏、港澳台数据;空白为无此项。 |
表4 门槛回归结果Table 4 Results of threshold regression |
| 门槛变量 | Dig | DI | ID |
| 门槛值 | 1.195 | 0.512 | 0.734 |
| Dig×I (Adjit<θ) | –1.678*** (0.312) | –1.873*** (0.368) | –1.730*** (0.315) |
| Dig×I (Adjit>θ) | –0.946*** (0.301) | –0.604*** (0.277) | –0.991*** (0.303) |
| Z | 控制 | 控制 | 控制 |
| 常数项 | 7.702 (16.036) | 39.614** (16.761) | 7.467 (16.013) |
| R2 | 0.843 | 0.835 | 0.843 |
注:括号内数值是标准误,***和**分别表示回归结果在1%和5%置信水平下通过显著性检验;Dig为数字经济发展指数,DI为数字产业化应用指数,ID为产业数字化融合指数,I(•)为指示函数,Adjit为门槛变量,θ为门槛值;观测值均为300;未含西藏、港澳台数据。 |
表5 空间自相关检验Table 5 Spatial autocorrelation test |
| 年份 | Dig | CIWB | |||
| Moran’s I | Z值 | Moran’s I | Z值 | ||
| 2011 | 0.201*** | 2.214 | 0.400*** | 3.526 | |
| 2012 | 0.224*** | 2.421 | 0.395*** | 3.476 | |
| 2013 | 0.251*** | 2.638 | 0.414*** | 3.623 | |
| 2014 | 0.265*** | 2.772 | 0.431*** | 3.755 | |
| 2015 | 0.266*** | 2.782 | 0.433*** | 3.799 | |
| 2016 | 0.229*** | 2.450 | 0.431*** | 3.769 | |
| 2017 | 0.220*** | 2.370 | 0.445*** | 3.895 | |
| 2018 | 0.233*** | 2.498 | 0.426*** | 3.779 | |
| 2019 | 0.225*** | 2.429 | 0.416*** | 3.720 | |
| 2020 | 0.222*** | 2.398 | 0.401*** | 3.625 | |
注:括号内数值是标准误;***表示回归结果在1%置信水平下通过显著性检验;Dig为数字经济发展指数,CIWB为人类福祉碳强度;未含西藏、港澳台数据。 |
表6 SDM回归结果Table 6 SDM regression results |
| 解释变量 | 邻接权 重矩阵 | 地理距 离矩阵 | 经济距 离矩阵 | 经济地 理矩阵 |
| Dig | –1.018*** | –1.018*** | –1.111*** | –0.932** |
| (0.315) | (0.330) | (0.366) | (0.365) | |
| W×Dig | –1.242*** | –1.088 | –0.586 | –2.539** |
| (0.351) | (0.728) | (0.580) | (1.179) | |
| ρ | 0.224*** | 0.255** | –0.116 | –0.205* |
| (0.075) | (0.104) | (0.072) | (0.106) | |
| def | –1.101*** | –1.088*** | –1.089*** | –0.849** |
| (0.322) | (0.335) | (0.378) | (0.391) | |
| indef | –1.841*** | –1.968* | –0.474 | –2.110** |
| (0.477) | (1.068) | (0.511) | (0.997) | |
| main | –2.942*** | –3.055*** | –1.563*** | –2.960*** |
| (0.647) | (1.156) | (0.460) | (0.876) | |
| Z | 控制 | 控制 | 控制 | 控制 |
| 省份固定 | 是 | 是 | 是 | 是 |
| 年份固定 | 是 | 是 | 是 | 是 |
| R2 | 0.812 | 0.813 | 0.827 | 0.748 |
注:表中括号内数值是标准误,***、**和*分别表示回归结果在1%、5%和10%置信水平下通过显著性检验;Dig为数字经济发展指数,W×Dig为数字经济的空间效应,其中main为总效应,def为直接效应,indef为间接效应,ρ为人类福祉碳强度的空间自回归系数,Z为控制变量;观测值均为300;未含西藏、港澳台数据。 |
表7 异质性分析结果Table 7 Heterogeneity analysis results |
| 变量 | (1) | (2) | (3) | (4) | 变量 | (1) | (2) | (3) | (4) | |
| Dig | –3.039** | –0.254 | –0.343 | –1.962*** | Roa | –0.104 | 0.152* | –0.035 | –0.121 | |
| (1.178) | (0.397) | (0.499) | (0.606) | (0.088) | (0.080) | (0.075) | (0.095) | |||
| lnPop | 10.658** | 2.942 | 2.162 | 12.236*** | EI | 2.897*** | 3.026*** | 1.943*** | 2.179*** | |
| (5.230) | (2.499) | (2.903) | (4.232) | (0.680) | (0.571) | (0.649) | (0.782) | |||
| lnFin | –1.509* | –0.578** | –1.029* | –0.264 | 常数项 | 2.239 | 47.821** | 59.474*** | –20.460 | |
| (0.766) | (0.243) | (0.528) | (0.432) | (43.352) | (18.851) | (22.114) | (33.266) | |||
| Tef | –0.420 | –1.277 | –0.246 | –0.967 | 省份固定 | 是 | 是 | 是 | 是 | |
| (0.389) | (0.818) | (0.390) | (0.718) | 年份固定 | 是 | 是 | 是 | 是 | ||
| lnPG | –3.682* | –3.450** | –1.968 | –5.209** | 观测值 | 147 | 146 | 150 | 150 | |
| (1.948) | (1.552) | (2.050) | (2.064) | R2 | 0.968 | 0.985 | 0.981 | 0.972 |
注:括号内数值是标准误,***、**和*分别表示回归结果在1%、5%和10%置信水平下通过显著性检验;Dig为数字经济发展指数,lnPop为人口规模,lnFin为固定资产投资水平,Tef为技术对外开放程度,lnPG为经济发展水平,Roa为交通设施条件,EI为能源强度;未含西藏、港澳台数据。 |
| [1] |
联合国发展计划署. 2021/2022年人类发展报告[R]. 纽约: 联合国开发计划署, 2021
United Nations Development Programme. Human development report 2021/2022. New York: United Nations Development Programme, 2021.
|
| [2] |
潘家华. 人文发展分析的概念构架与经验数据: 以对碳排放空间的需求为例[J]. 中国社会科学, 2002(6): 15-25+204
Pan Jiahua. A conceptual framework for understanding human development potential: With empirical analysis of global demand for carbon emissions. Social Sciences in China, 2002(6): 15-25+204
|
| [3] |
杨刚强, 王海森, 范恒山, 等. 数字经济的碳减排效应: 理论分析与经验证据[J]. 中国工业经济, 2023(5): 80-98
Yang Gangqiang, Wang Haisen, Fan Hengshan et al. Carbon reduction effect of digital economy: Theoretical analysis and empirical evidence. China Industrial Economics, 2023(5): 80-98
|
| [4] |
世界银行. 2016年世界发展报告: 数字红利[M]. 北京: 清华大学出版社, 2017
World Bank. World development report 2016: Digital dividend. Beijing: Tsinghua University Press, 2017.
|
| [5] |
Jorgenson A K. Economic development and the carbon intensity of human well-being. Nature Climate Change, 2014, 4(3): 186-189
|
| [6] |
Dietz T, Rosa E A, York R. Environmentally efficient well-being: Is there a Kuznets curve?[J]. Applied Geography, 2012, 32(1): 21-28
|
| [7] |
Sweidan O D. Economic performance and carbon intensity of human well-being: Empirical evidence from the MENA region. Journal of Environmental Planning and Management, 2018, 61(4): 699-723
|
| [8] |
Greiner P T, McGee J A. The asymmetry of economic growth and the carbon intensity of well-being. Environmental Sociology, 2020, 6(1): 95-106
|
| [9] |
Givens J E. Ecologically unequal exchange and the carbon intensity of well-being, 1990—2011[J]. Environmental Sociology, 2018, 4(3): 311-324
|
| [10] |
Thombs R P. The asymmetric effects of fossil fuel dependency on the carbon intensity of well-being: A US state-level analysis, 1999—2017[J]. Global Environmental Change, 2022, 77 102605
|
| [11] |
Li Jing, Luo Ying, Wang Shengyun. Spatial effects of economic performance on the carbon intensity of human well-being: The environmental Kuznets Curve in Chinese provinces. Journal of Cleaner Production, 2019, 233 681-694
|
| [12] |
Wang Shaojian, Xie Zihan, Wu Rong et al. How does urbanization affect the carbon intensity of human well-being? A global assessment. Applied Energy, 2022, 312 118798
|
| [13] |
沃尔特·罗斯托. 经济增长的阶段[M]. 郭熙保, 等译. 北京: 中国社会科学出版社, 2001
Rostow W W. The stages of economic growth. Translated by Guo Xibao et al. Beijing: China Social Sciences Press, 2001.
|
| [14] |
王香艳, 李金叶. 数字经济是否有效促进了节能和碳减排?[J]. 中国人口·资源与环境, 2022, 32(11): 83-95
Wang Xiangyan, Li Jinye. Did the digital economy effectively promote energy conservation and CO2 reduction?[J]. China Population Resources and Environment, 2022, 32(11): 83-95
|
| [15] |
韩长根, 张力. 互联网是否改善了中国的资源错配: 基于动态空间杜宾模型与门槛模型的检验[J]. 经济问题探索, 2019(12): 43-55
Han Changgen, Zhang Li. Can internet improve the resource misallocation of China: An empirical test based on the dynamic Spatial Durbin Model and threshold effect. Inquiry into Economic Issues, 2019(12): 43-55
|
| [16] |
常皓亮, 夏飞龙. 数字经济赋能低碳发展: 机制识别与空间溢出[J]. 科技进步与对策, 2023, 40(10): 48-57
Chang Haoliang, Xia Feilong. Empowerment of digital economy to low-carbon development: Mechanism identification and spatial spillover. Science & Technology Progress and Policy, 2023, 40(10): 48-57
|
| [17] |
Shan Y, Guan D, Zheng H et al. China CO2 emission accounts 1997—2015[J]. Scientific Data, 2018, 5(1): 1-14
|
| [18] |
杜金霜, 付晶莹, 郝蒙蒙. 基于生态网络效用的昭通市“三生空间”碳代谢分析[J]. 自然资源学报, 2021, 36(5): 1208-1223
Du Jinshuang, Fu Jingying, Hao Mengmeng. Analyzing the carbon metabolism of “production-living ecological” space based on ecological network utility in Zhaotong. Journal of Natural Resources, 2021, 36(5): 1208-1223
|
| [19] |
王军, 朱杰, 罗茜. 中国数字经济发展水平及演变测度[J]. 数量经济技术经济研究, 2021, 38(7): 26-42
Wang Jun, Zhu Jie, Luo Qian. Research on the measurement of China’s digital economy development and the characteristics. The Journal of Quantitative & Technical Economics, 2021, 38(7): 26-42
|
| [20] |
冯兰刚, 阳文丽, 王忠, 等. 中国数字经济与城市碳排放强度: 时空演化与作用机制[J]. 中国人口·资源与环境, 2023, 33(1): 150-160
Feng Langang, Yang Wenli, Wang Zhong et al. Digital economy and urban carbon emission intensity in China: Spatio-temporal evolution and mechanisms. China Population Resources and Environment, 2023, 33(1): 150-160
|
| [21] |
郭丰, 杨上广, 任毅. 数字经济、绿色技术创新与碳排放——来自中国城市层面的经验证据[J]. 陕西师范大学学报(哲学社会科学版), 2022, 51(3): 45-60
Guo Feng, Yang Shangguang, Ren Yi. The digital economy, green technology innovation and carbon emissions: Empirical evidence from Chinese city-level data. Journal of Shaanxi Normal University (Philosophy and Social Sciences Edition), 2022, 51(3): 45-60
|
| [22] |
国家统计局. 中国能源统计年鉴[M]. 2012—2021. 北京: 中国统计出版社, 2012—2021
National Bureau of Statistics of China. China energy statistical yearbook. 2021—2021. Beijing: China Statistics Press, 2012—2021.
|
| [23] |
国家统计局. 中国环境统计年鉴[M]. 2012—2021. 北京: 中国统计出版社, 2012—2021
National Bureau of Statistics of China. China statistical yearbook on environment. 2021—2021. Beijing: China Statistics Press, 2012—2021.
|
| [24] |
工业和信息化部. 中国信息产业年鉴[M].2012—2021. 北京: 电子工业出版社, 2012—2021
Ministry of Industry and Information Technology. Yearbook of China information industry. 2012—2021. Beijing: Publishing House of Electronics Industry, 2012—2021.
|
| [25] |
马留赟, 白钦先. 数字经济如何缓解相对贫困[J]. 财经科学, 2022(7): 92-105
Ma Liuyun, Bai Qinxian. How can digital economy alleviate relative poverty. Finance& Economics, 2022(7): 92-105
|
| [26] |
张同功, 张隆, 赵得志, 等. 公共教育支出、人力资本积累与经济增长: 区域差异视角[J]. 宏观经济研究, 2020(3): 132-144+175
Zhang Tonggong, Zhang Long, Zhao Dezhi et al. Public education expenditure, human capital accumulation and economic growth: Regional difference perspective. Macroeconomics, 2020(3): 132-144+175
|
| [27] |
郭凯明, 罗敏. 有偏技术进步、产业结构转型与工资收入差距[J]. 中国工业经济, 2021(3): 24-41
Guo Kaiming, Luo Min. Directed technological change, structural transformation, and wage income gap. China Industrial Economics, 2021(3): 24-41
|
/
| 〈 |
|
〉 |