
广州市城市环境噪声昼夜空间分布模拟与特征分析
|
张雪(1992—),女,湖南娄底人,讲师,博士,主要从事城市地理和健康地理研究。E-mail: zhangx199@ynu.edu.cn |
收稿日期: 2024-09-22
修回日期: 2025-06-22
网络出版日期: 2026-01-29
基金资助
国家自然科学基金项目(42271234)
云南省基础研究计划项目(202201AT070421)
版权
Simulation and characteristic analysis of urban environmental noise in daytime and nighttime in Guangzhou
Received date: 2024-09-22
Revised date: 2025-06-22
Online published: 2026-01-29
Supported by
National Natural Science Foundation of China(42271234)
Yunnan Fundamental Research Projects(202201AT070421)
Copyright
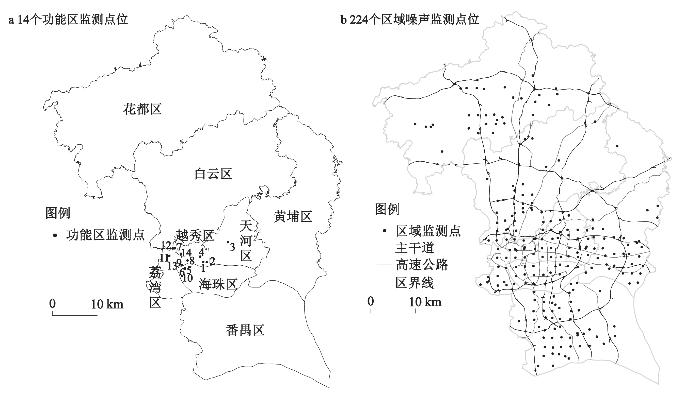
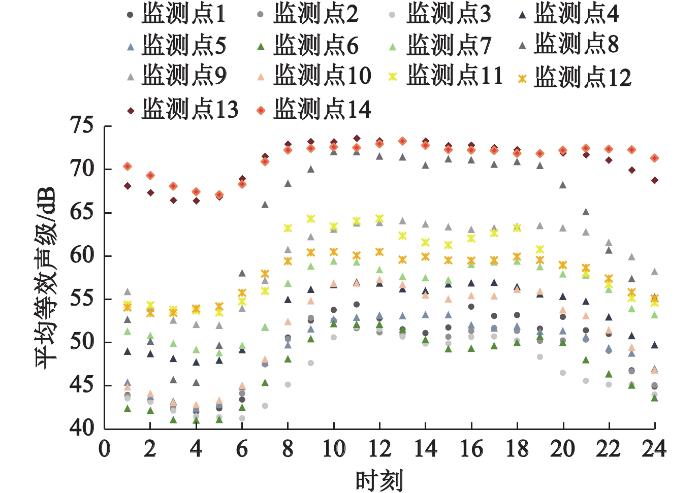
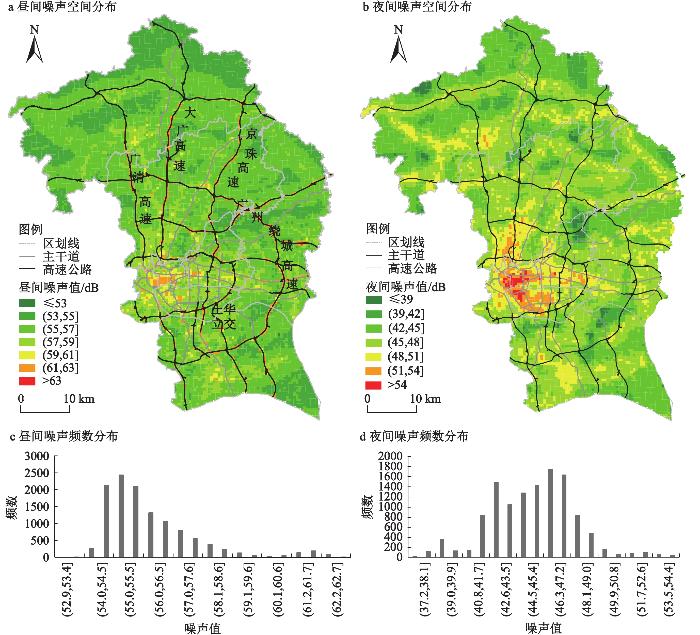
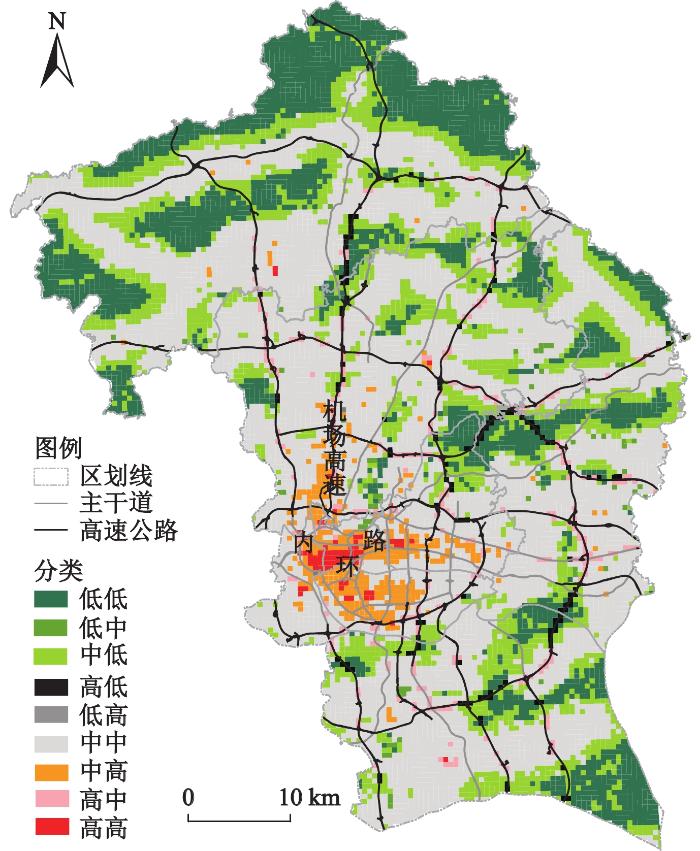
准确掌握城市噪声的时空分布特征对于城市环境噪声防治、管控以及减轻与噪声接触有关的不利健康后果至关重要。本文基于2011—2019年广州市城市环境噪声监测数据,通过随机森林方法对广州市8个区的昼夜环境噪声时空分布进行模拟与特征分析。结果表明:广州市昼夜噪声无明显的年度和季度变化特征,但随居民的活动时间节律有明显的日波动特征。昼、夜噪声模拟值分别为52.92~63.20 dB和37.21~55.33 dB。昼夜噪声空间分布有明显的异质性,总体上中心城区噪声高,且高噪声区域多分布在立交桥、城市高/快速路和主要交通节点间的交通干线等周围区域,其次为工业园区和商业中心周围。研究构建的环境噪声时空分布模拟与分析框架,可为居民环境噪声暴露风险和健康影响评估以及针对性的城市噪声防治和管控措施制定提供理论支撑。
张雪 , 周素红 , 琚鸿 , 陈鸿展 , 陈漾 . 广州市城市环境噪声昼夜空间分布模拟与特征分析[J]. 地理科学, 2026 , 46(2) : 478 -489 . DOI: 10.13249/j.cnki.sgs.20241064
Accurate understanding of the temporal and spatial distribution characteristics of urban noise is crucial for the prevention and control of noise and the reduction of adverse health consequences related to noise exposure. Most of the previous studies focused on the spatial distribution of noise and neglected their temporal variation. Based on the urban environmental noise monitoring data from 2011 to 2019, this paper simulated and analyzed the spatial and temporal distribution of environmental noise in 8 districts of Guangzhou by random forest method. The results showed that there is no obvious annual and quarterly variation of day and night noise in Guangzhou, but obvious diurnal fluctuation characteristics with the residents’ activities. The simulated values of day and night noise were 52.92-63.20 dB and 37.21-55.33 dB, respectively. It’s obvious heterogeneity of the noise spatial distribution. During daytime, the high-noise were mainly concentrated in areas with dense road networks, along both sides of expressways and urban main roads, as well as the overpasses and crossroads. At night, the areas with high noise levels were mainly distributed in the old urban districts, as well as the areas surrounded by some expressways and the intersections of major urban roads. Overall, the noise level in the central urban area was high, especially around major urban traffic arteries, followed by the areas around industrial parks and commercial centers. The main sources of daytime noise were road traffic, dense population and their activities, while the main sources of nighttime noise were road traffic, human activities and activities related to industrial production and medical services. The simulation and analysis framework of environmental noise distribution can provide theoretical support for the assessment of environmental noise exposure risk and health impact of residents, as well as for the formulation of targeted urban noise prevention and control measures.
表1 昼间和夜间噪声模拟模型中使用的预测变量及其最佳缓冲区Table 1 Predictive variable and its optimal buffer used in daytime and nighttime noise simulation model |
| 变量 | 昼间噪声模型 | 夜间噪声模型 | 变量 | 昼间噪声模型 | 夜间噪声模型 | |
| 注:√变量被使用,但未对变量进行缓冲过程;“–”为无此变量;RMSE为均方根误差;MAE为平均绝对误差。 | ||||||
| 土地利用变量 | 建筑物面积比例 | 500 m | – | |||
| 居住用地比例 | 700 m | – | 建筑物平均高度 | – | 50 m | |
| 工业用地比例 | – | 700 m | 人口密度 | |||
| 仓储用地比例 | – | 200 m | 日均人流量 | 300 m | 300 m | |
| 对外交通用地比例 | – | 700 m | 夜间人流量 | – | 50 m | |
| 建成环境变量 | 道路交通属性 | |||||
| 归一化建筑指数平均值 | 300 m | – | 直线中心性 | 300 m | – | |
| 夜间灯光平均值 | 500 m | 30 m | 穿行度 | – | ||
| 医疗保健服务POI数量 | – | 次级道路长度 | 30 m | – | ||
| 道路附属设施POI数量 | 30 m | 30 m | 其他道路长度 | – | ||
| 购物服务POI数量 | 500 m | – | 距主要道路最短距离* | √ | √ | |
| 金融服务POI数量 | 300 m | – | RMSE | 3.79 | 2.75 | |
| 风景名胜POI数量 | 30 m/200 m | – | MAE | 3.17 | 2.16 | |
| 机械制造POI数量 | 300 m | R2 | 0.42 | 0.48 | ||
表2 昼间和夜间噪声模拟模型中预测变量的特征重要性Table 2 Relative importance of predictor variables in daytime and nighttime noise simulation model |
| 昼间噪声模拟模型自变量 | 特征重要性 | 排序 | 夜间噪声模拟模型自变量 | 特征重要性 | 排序 | |
| 直线中心性(300 m) | 0.16 | 1 | 距主要道路最短距离 | 0.18 | 1 | |
| 归一化建筑指数平均值(300 m) | 0.14 | 2 | 夜间人流量(50 m) | 0.12 | 2 | |
| 距主要道路最短距离 | 0.11 | 3 | 日均人流量(300 m) | 0.12 | 3 | |
| 夜间灯光平均值(500 m) | 0.11 | 4 | 夜间灯光平均值(30 m) | 0.09 | 4 | |
| 购物服务POI数量(500 m) | 0.10 | 5 | 工业用地比例(700 m) | 0.09 | 5 | |
| 机械制造POI数量(300 m) | 0.08 | 6 | 其他道路长度( | 0.08 | 6 | |
| 居住用地比例(700 m) | 0.08 | 7 | 医疗保健服务POI数量( | 0.07 | 7 | |
| 日均人流量(300 m) | 0.07 | 8 | 对外交通用地比例(700 m) | 0.06 | 8 | |
| 建筑物面积比例(500 m) | 0.07 | 9 | 穿行度( | 0.06 | 9 | |
| 金融服务POI数量(300 m) | 0.03 | 10 | 机械制造POI数量( | 0.05 | 10 | |
| 次级道路长度(30 m) | 0.03 | 11 | 建筑物平均高度(50 m) | 0.04 | 11 | |
| 风景名胜POI数量(30 m) | 0.01 | 12 | 仓储用地比例(200 m) | 0.03 | 12 | |
| 风景名胜POI数量(200 m) | 0.01 | 13 | 道路附属设施POI数量(30 m) | 0.01 | 13 | |
| 道路附属设施POI数量(30 m) | 0.01 | 14 |
| [1] |
张延吉, 邓伟涛, 赵立珍, 等. 城市建成环境如何影响居民生理健康?——中介机制与实证检验[J]. 地理研究, 2020, 39(4): 822-835.
Zhang Yanji, Deng Weitao, Zhao Lizhen et al. How urban built environment affects residents’ physical health? Mediating mechanism and empirical test. Geographical Research, 2020, 39(4): 822-835.
|
| [2] |
杨林生, 王五一, 谭见安, 等. 环境地理与人类健康研究成果与展望[J]. 地理研究, 2010, 29(9): 1571-1583.
Yang Linsheng, Wang Wuyi, Tan Jianan et al. Overview on the research works in the field of environmental geography and human health. Geographical Research, 2010, 29(9): 1571-1583.
|
| [3] |
马静, 柴彦威, 符婷婷. 居民时空行为与环境污染暴露对健康影响的研究进展[J]. 地理科学进展, 2017, 36(10): 1260-1269.
Ma Jing, Chai Yanwei, Fu Tingting. Progress of research on the health impact of people’s space-time behavior and environmental pollution exposure. Progress in Geography, 2017, 36(10): 1260-1269.
|
| [4] |
周素红, 张琳, 林荣平. 地理环境暴露与公众健康研究进展[J]. 科技导报, 2020, 38(7): 43-52.
Zhou Suhong, Zhang Lin, Lin Rongping. Progress and prospect of the research on geographical environment exposure and public health. Science & Technology Review, 2020, 38(7): 43-52.
|
| [5] |
李春江, 马静, 柴彦威, 等. 居住区环境与噪音污染对居民心理健康的影响——以北京为例[J]. 地理科学进展, 2019, 38(7): 1103-1110.
Li Chunjiang, Ma Jing, Chai Yanwei et al. Influence of neighborhood environment and noise pollution on residents’ mental health in Beijing. Progress in Geography, 2019, 38(7): 1103-1110.
|
| [6] |
Word Health Organization. Burden of disease from environmental noise: Quantification of healthy life years lost in Europe [R]. Geneva, Switzerland: World Health Organization, 2011: 126.
|
| [7] |
中国生态环境部. 中国噪声污染防治报告2024[R/OL]. 2024.https://www.mee.gov.cn/hjzl/sthjzk/hjzywr/202408/W020240829356736814731.pdf
Ministry of Ecology and Environment of China. Annual report on prevention and con-trol of noise pollution in China. 2024. https://www.mee.gov.cn/hjzl/sthjzk/hjzywr/202408/W020240829356736814731.pdf
|
| [8] |
Zhang L, Zhou S H, Kwan M-P et al. The threshold effects of bus micro-environmental exposures on passengers’ momentary mood[J/OL]. Transportation Research Part D: Transport and Environment, 2020: 84. https://doi.org/10.1016/j.trd.2020.102379.
|
| [9] |
Zhang X, Zhou S H, Kwan M-P et al. Geographic ecological momentary assessment (GEMA) of environmental noise annoyance: The influence of activity context and the daily acoustic environment[J/OL]. International Journal of Health Geographics, 2020, 19. https://doi.org/10.1186/s12942-020-00246-w.
|
| [10] |
Xie D, Yi L, Chen J. Mapping urban environmental noise: A land use regression method[J]. Environmental Science & Technology, 2011, 45(17): 7358-7364.
|
| [11] |
Cvetković D, Praščević M, Mihajlov D. Estimation of uncertainty in environmental noise measurement[J]. Measurement, 2011, 100, 3
|
| [12] |
Hoek G, Beelen R, Hoogh K D et al. A review of land-use regression models to assess spatial variation of outdoor air pollution[J]. Atmospheric Environment, 2008, 42(33): 7561-7578.
|
| [13] |
王佳佳, 夏晓圣, 程先富, 等. 合肥市PM2.5浓度时空分布特征及影响因素分析 长江流域资源与环境, 2020, 29(6): 1413-1421.
Wang Jiajia, Xia Xiaosheng, Cheng Xianfu et al. Temporal and spatial distribution characteristics and influencing factors of PM2.5 concentration in Hefei City Resources and Environment in the Yangtze Basin, 2020, 29(6): 1413-1421.
|
| [14] |
Aguilera I, Foraster M, Basagaña X et al. Application of land use regression modelling to assess the spatial distribution of road traffic noise in three European cities[J]. Journal of Exposure Science & Environmental Epidemiology, 2015, 25(1): 97-105.
|
| [15] |
Chang T Y, Liang C H, Wu C F et al. Application of land-use regression models to estimate sound pressure levels and frequency components of road traffic noise in Taichung, Taiwan[J]. Environment International, 2019, 131, 104959.
|
| [16] |
Liu Y, Goudreau S, Oimao T et al. Comparison of land use regression and random forests models on estimating noise levels in five Canadian cities[J]. Environmental Pollution, 2020(256): 113367.
|
| [17] |
Ragettli M S, Goudreau S, Plante C et al. Statistical modeling of the spatial variability of environmental noise levels in Montreal, Canada, using noise measurements and land use characteristics[J]. Journal of Exposure Science & Environmental Epidemiology, 2016, 26(6): 597-605.
|
| [18] |
Raess M, Brentani A, de Campos BLD et al. Land use regression modelling of community noise in Sao Paulo, Brazil[J]. Environmental Research, 2021, 199(2-3): 111231
|
| [19] |
Harouvi O, Ben-Elia E, Factor R et al. Noise estimation model development using high-resolution transportation and land use regression[J]. Journal of Exposure Science & Environmental Epidemiology, 2018, 28, 559-567.
|
| [20] |
Xu X Y, Ge Y H, Wang W D et al. Application of land use regression to map environmental noise in Shanghai, China[J]. Environment International, 2022, 161, 107111.
|
| [21] |
Tsai K T, Lin M D, Chen Y H. Noise mapping in urban environments: A Taiwan study[J]. Applied Acoustics, 2009, 70(7): 964-972.
|
| [22] |
Cammarata G, Cavalieri S, Fichera A. A neural network architecture for noise prediction[J]. Neural Networks, 1995, 8(6): 963-973.
|
| [23] |
Liu Y, Cao G, Zhao N et al. Improve ground-level PM2.5 concentration mapping using a random forests-based geostatistical approach Environment Pollution, 2018, 235, 272-282.
|
| [24] |
环境保护部. 声环境质量标准(GB 3096-2008)[S/OL]. 2008. http://www.mee.gov.cn
Ministry of Ecology and Environment of China. Standard for acoustic environmental quality (GB 3096-2008). 2008. http://www.mee.gov.cn
|
| [25] |
环境保护部. 环境噪声监测技术规范——城市声环境常规监测(HJ 640-2012)[S/OL]. 2012. http://www.mee.gov.cn/ywgz/fgbz/bz/bzwb/jcffbz/201212/t20121207_243475.shtml
Ministry of Ecology and Environment of China. Technical specifications for environmental noise monitoring—Routine monitoring for urban environmental noise (HJ 640-2012). 2012. http://www.mee.gov.cn/ywgz/fgbz/bz/bzwb/jcffbz/201212/t20121207_243475.shtml
|
| [26] |
Breiman L. Random forests[J]. Machine Learning, 2001, 45(1): 5-32.
|
| [27] |
Shao Y, Ma Z, Wang J et al. Estimating daily ground-level PM2. 5 in China with random-forest-based spatiotemporal kriging[J]. Science of the Total Environment, 2020, 740, 139761.
|
| [28] |
Wei J, Huang W, Li Z et al. Estimating 1-km-resolution PM2.5 concentrations across China using the space-time random forest approach Remote Sensing of Environment, 2019, 231, 111221.
|
| [29] |
Wang Y C, Huang C L, Zhao M Y et al. Mapping the population density in mainland China using NPP/VIIRS and points-of-interest data based on a random forests model[J]. Remote Sensing, 2020, 12(21): 3645.
|
| [30] |
Wang Q, Gao X, Li Q et al. Spatially explicit reconstruction of the population distribution in the Tuojiang River Basin during 1911—2010 using random forest regression[J]. Regional Environmental Change, 2022, 22(1): 1-13.
|
| [31] |
Weier J, Herring D. Measuring vegetation (NDVI & EVI) [EB/OL]. 2014. http://earthobservatory.nasa.gov/Features/MeasuringVegetation [2019-08-29].
|
| [32] |
银超慧, 刘艳芳, 危小建. 武汉市多尺度道路网络中心性与社会经济活动点空间分布关系分析[J]. 人文地理, 2017, 32(6): 104-112.
Yin Chaohui, Liu Yanfang, Wei Xiaojian. Study on the multi-scale relationship between road network centrality and social economic activities distribution in Wuhan. Human Geography, 2017, 32(6): 104-112.
|
| [33] |
Hillier B. Spatial sustainability in cities: Organic patterns and sustainable forms [M]//Koch D et al. Proceedings of the 7th International Space Syntax Symposium. Stockholm, Sweden: Royal Institute of Technology (KTH), 2009.
|
| [34] |
住房和城乡建设部. 城市综合交通体系规划标准(GBT 51328-2018)[S/OL]. 2018.http://www.mohurd.gov.cn
Ministry of Housing and Urban-Rural Development. Standard for urban comprehensive transport system planning (GBT 51328-2018). 2018. http://www.mohurd.gov.cn
|
| [35] |
唐会凌, 田娟. 噪声污染问题化解对策研究——以广州市为例[J]. 环境保护与循环经济, 2024, 44(5): 108-110.
Tang Huiling, Tian Juan. Research on countermeasures for resolving noise pollution problems: A case study of Guangzhou City. Environmental Protection and Circular Economy, 2024, 44(5): 108-110.
|
/
| 〈 |
|
〉 |