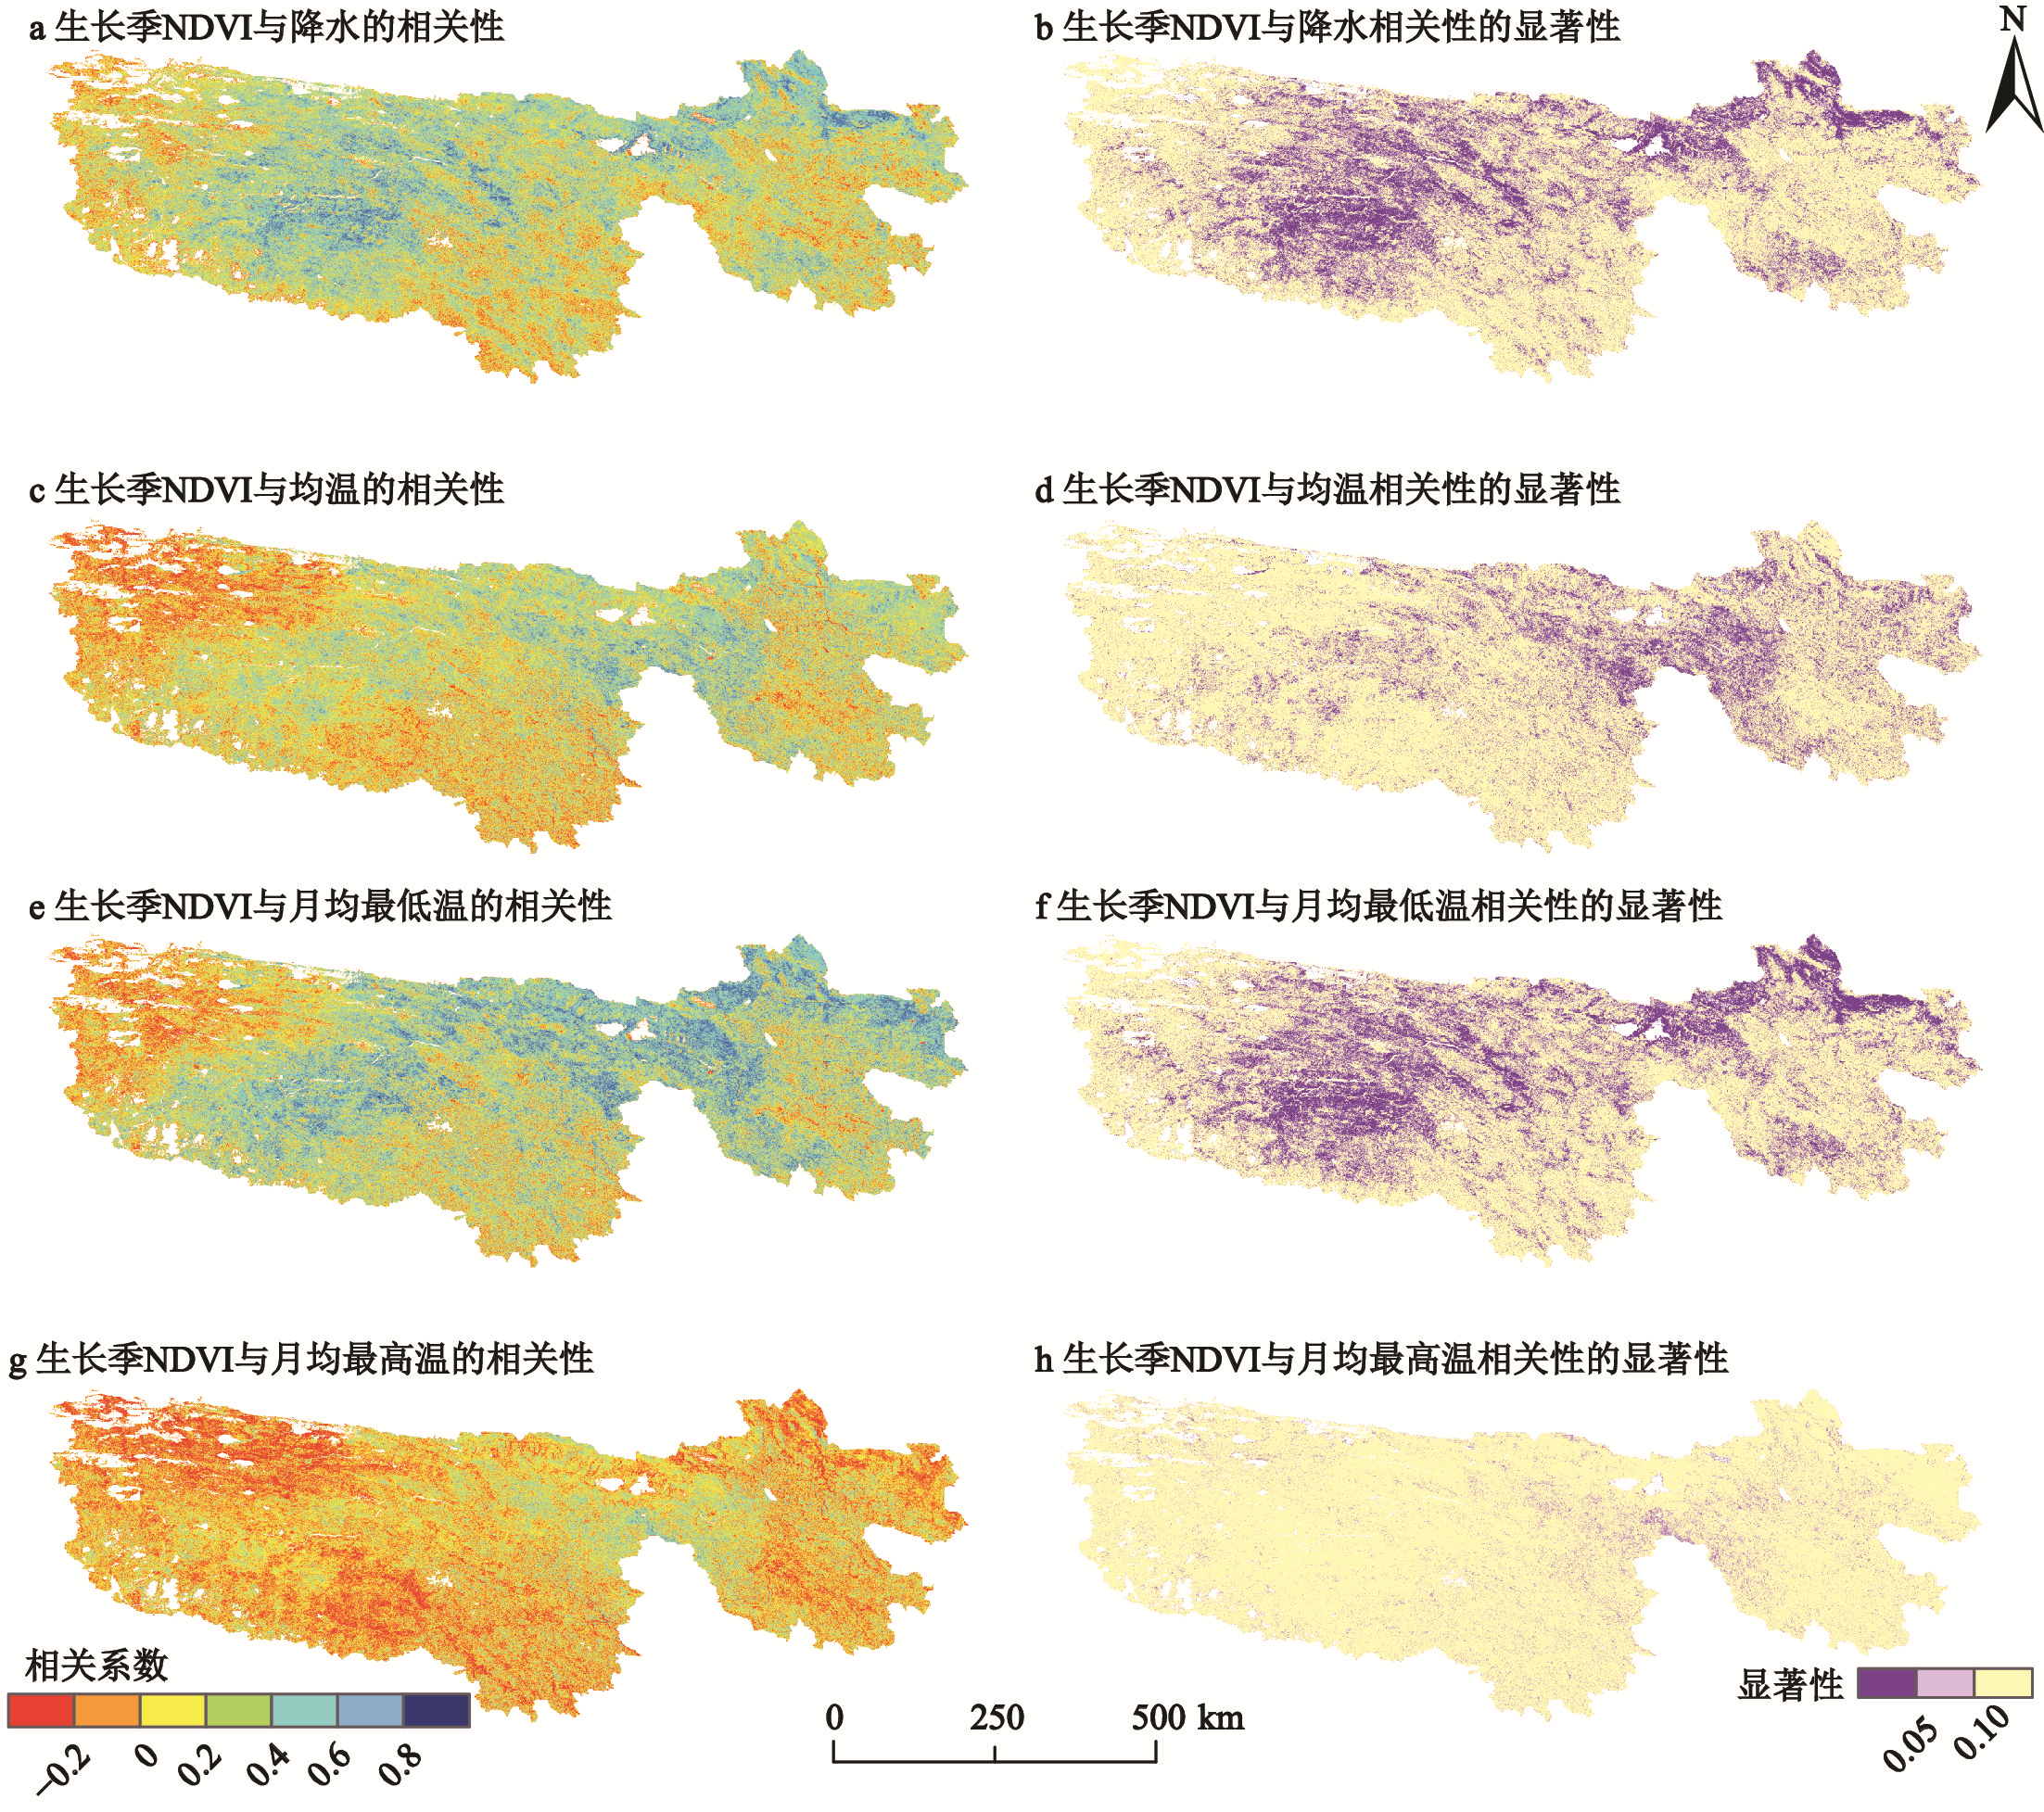
Fig. 4 Correlation between GNDVI and precipitation, monthly average temperature, monthly minimum temperature, and monthly maximum temperature in the growing season in the Three River Headwater Region from 2000 to 2020
Other figure/table from this article