肖捷颖 , 张倩, 王燕, 季娜, 李星
河北科技大学环境科学与工程学院河北省污染防治生物技术实验室, 河北 石家庄 050018
XIAO Jie-ying, ZHANG Qian, WANG Yan, JI Na, LI Xing
中图分类号: X24
文献标识码: A
文章编号: 1000-0690(2014)03-0338-06
收稿日期: 2013-02-4
修回日期: 2013-06-10
网络出版日期: 2014-03-10
版权声明: 2014 《地理科学》编辑部 本文是开放获取期刊文献,在以下情况下可以自由使用:学术研究、学术交流、科研教学等,但不允许用于商业目的.
基金资助:
作者简介:
作者简介:肖捷颖(1970-),女,河北涿州人,副教授,博士,主要从事环境遥感应用研究。E-mail: xiaojieying@gmail.com;xiaojieying@hebust.edu.cn
展开
摘要
对石家庄市LandsatTM数据进行土地覆被分类,计算各土地覆被类型的能量平衡分量。找出感热、潜热、储热通量在下垫面的分配差异并分析下垫面面积比例与感热/净辐射的关系。发现密集不透水面感热单位面积能量达314.1 W/m2,49.9%的净辐射转换为感热。城市植被、水体净辐射的61.2%,65.9%变成潜热;感热/净辐射与城市植被和水体面积比例负相关,面积比例小于30%,感热/净辐射随之减少而快速增长;大于30%则随之增加缓慢降低。感热/净辐射与不透水面面积比显著正相关,可见,城市近地层温度升高主要由不透水面产生的感热交换引起。
关键词:
Abstract
Urban heat island is a phenomenon with higher temperature in urban area than that in rural area. China has experienced unprecedented rapid urbanization since 1990s, urban heat island became complicated recently and attracted more attention. In order to understand formation mechanism of urban heat environment better, this study analyzed urban heat environment spatial pattern, from the view point of surface energy balance. Shijiazhuang City, with a history of only 100 years and population of 2.86 million, is the largest city of Hebei Province. We used a Land sat TM image recorded on Aug. 12, 2009 for analysis, including extraction of the information on land surface temperature, water index and impervious surface index. The land cover of study area was classified into high density impervious surface, low density impervious surface, urban vegetation, water body, agricultural vegetation and bare land by using decision tree method. Then net radiation, sensible heat flux, latent heat flux, storage heat flux and anthropogenic heat were simulated for investigating the impact of the energy balance to urban heat environment. At last, quantitative analysis on energy per unit area comparison, energy conversion among different underlying surfaces and correlation between energy and area percentage of different underlying surfaces were analyzed. Results show that high density impervious surface(17.9%), low density impervious surface (29.2%) and agricultural vegetation (26.0%) are major land cover types, and all underlying surfaces including urban vegetation (18.6%), water body (0.7%) and bare land (7.7%) play an important role in urban heat environment formation. We also found that the amount of sensible energy per unit area of high density impervious surface (314.1 W/m2) and low density impervious surface (262.4 W/m2) were higher than other underlying surfaces, and there were 49.9% and 42.9% of net radiation conversed to sensible heat. Anthropogenic heat generated from high density impervious surface is 41.3 W/m2. While the highest amount of latent energy per unit area occurred at water body (479.0 W/m2). In the city, there were 61.2% and 65.9% of net radiation conversed to latent heat from urban vegetation and water body, and it indicated that they cooled the city. Percentage of impervious surface is significant positively correlated with sensible heat flux/net radiation. QH/Q* will increase by 0.3%, along with 1% increasing of impervious surface. On the other hand, sensible heat flux/net radiation will increase rapidly along with urban vegetation and water body area percentage decreasing when it is less than 30%, while if it is more than 30%, QH/Q* with decrease slowly. In sum, urban heat environment is mainly caused by sensible heat exchange from impervious surface, while urban vegetation and water body can cool the city through latent energy.
Keywords:
城市热岛效应是城市气候最显著特征之一,因影响居民生活质量和健康而倍受关注。从能量平衡角度理解城市热环境成因是认识城市气候问题的重要基础,对科学的城市规划和改善城市热环境有深远的意义。随着遥感技术的发展,可利用遥感监测法对城市热环境展开更精准的研究,因其具有数据时间同步性好、覆盖范围广等特点,可分析城市热环境的空间分布、变化及地表热通量[1]。常用遥感数据有NOAA/ AVHRR、Landsat TM/ ETM +、MODIS及ASTER,主要通过反演地表温度或模拟地表能量通量,得到城市热环境的空间分布特征[2-5];或通过植被指数、地表反照率[6]、不透水面覆盖度等研究下垫面与温度的关系[7,8];也有关于城市景观变化和热岛空间格局关系的研究[9];或应用气候模型耦合遥感数据计算地表能量平衡[10]。城市下垫面的不透水化,改变了自然地表能量平衡的空间格局,是形成城市热岛的主因,但针对城市地表能量特征的研究相对较少,尚未引起足够的重视。
本文以石家庄市为例,尝试利用地表能量平衡模型模拟研究区地表热通量的空间分布特征,定量分析不同下垫面地表热通量对城市热环境的影响。试图从能量角度理解城市热环境形成的物理基础,为研究城市热环境,尤其减缓城市热岛效应提供科学基础和依据。
石家庄市位于河北省中南部,人口286.2万(2010年)。处中纬度欧亚大陆东缘,属暖温带大陆性季风气候。四季分明,寒暑悬殊,雨量集中。夏冬长,春秋短。研究范围为其主城区及其近郊,面积411 km2。100 a间石家庄市经历了从几百人的小村庄到近300万人口省会的快速发展 [11]。
Landsat TM数据来自中国科学院对地观测与数字地球科学中心,成像时点为2009年8月12日10:50,晴朗无云。数据预处理包括:投影转换、几何校正(RMSE小于0.5个像元)、辐射校正及裁剪。用同日11时石家庄气象站监测数据,进行地表能量平衡计算。气象数据:风速(1.2 m/s);气温(34.9℃);气压(9 936 hPa);湿度(31%);水汽压(17.3 hPa)。
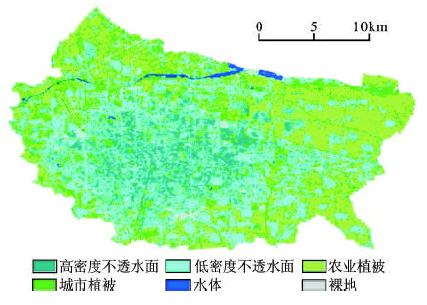
采用决策树分类法,依据K-T变换的亮度、归一化植被指数[12]、水体指数和不透水面指数[13]。将研究区地表覆被分为高密度不透水面、低密度不透水面、农业植被、城市植被、水体和裸地。
结合数据的增益、偏置等参数将DN(Digital Number)值转换为传感器处窄带反射率,再将1~5、7波段的能量权重作为转换系数,用公式1将窄带反射率转换为宽带地表反照率r[14]。
式中,r1, r2, …, r7为TM影像各波段的反射率。
地表亮度温度参考NASA(National Aeronauticsand Space Administration)的方法计算,纠正地表发射率 [15,16],再将亮度温度转为地表温度Ts。
式中,T6为亮度温度,K;K1为玻尔兹曼常量,1.38×10-23J/K;λ为TM6波段中心波长(11.5μm);h为普朗克常数,6.626×10-34 J·s,c 为光速,2.998×108m/s;ε为地表发射率。
城市地表能量平衡方程由Oke[17]提出,后将人为热引入该方程。
式中,Q*为地表净辐射,QF为人为热,QH为感热通量,QE为潜热通量,ΔQs为储热通量,ΔQA为平流热通量,单位均为W/m2。其中,平流热因地表的非均一性引起,与海拔高度差异有关,热量通量密度和热通量标量在水平方向均匀分布时可忽略[18]。研究区地势平坦,海拔高度变化小;成像时刻风速1.2 m/s;也因地面观测数据不足。因此,本文忽略平流热。
1) 地表净辐射。地表净辐射是到达地表的太阳短波辐射经地表反射及地表与大气长波辐射交换后所得净能量[19]。
式中,r为地表反照率,Q为到达地表的太阳总辐射量(W/m2),ε为地表发射率,εa为空气发射率,σ为斯忒藩-玻耳兹曼常数,5.669 7×10⁻⁸ W/(m2·k4),Ta为空气温度(K),Ts为地表温度(K) 。
2) 感热通量。感热通量表征地表与大气间通过感热方式的能量交换,由地表温度、气温和空气动力学阻力决定,本文采用动力学阻抗法[20]计算。
式中,ρ为空气密度(kg/m³),CP 为空气比热[1 013 J/(kg·K)],ra 空气动力学阻力(s/m)。
式中,z为参考高度(m),d0 为零平面位移(m),zom为地表动量粗糙度(m),zoh 为地表热量粗糙度(m),k 为Von Karaman 常数,u 为风速(m/s),
3) 潜热通量。潜热通量是蒸散发过程中,水分由液态转化为气态时所消耗的能量通量。根据地表温度与表面水汽压关系式[21]得到蒸发面附近饱和水汽压es*,用Penman-Monteith公式计算。
式中, es*,地表面饱和水汽压(kPa);rs,表面阻抗(s/m);
4) 储热通量。储热通量在能量平衡方程中相对较小却很重要,Bastiaanssen认为它与地表温度、地表反照率、NDVI及地表净辐射有关[22]。
式中,ravg平均地表反射率,NNDVI为归一化植被指数。
5) 人为热。利用地表净辐射、潜热和储热,得到感热与人为热之和QH*,再求差计算。
研究区被分为高密度不透水面(灰绿色)、低密度不透水面(湖蓝色)、农业植被(浅绿色)、城市植被(深绿色)、水体(蓝色)和裸地(灰色)(图1)。分类总体精度92.78%,Kappa系数0. 91。
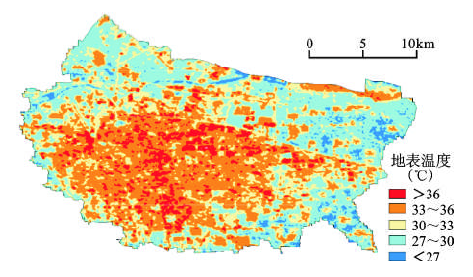
地表温度空间分布如图2所示,由高到低依次是高密度不透水面、裸地、低密度不透水面、城市植被、农业植被和水体。
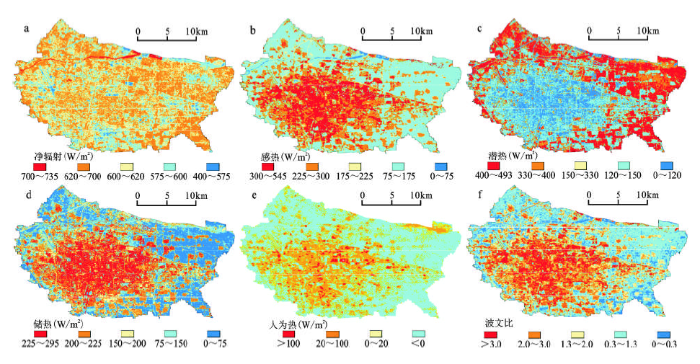
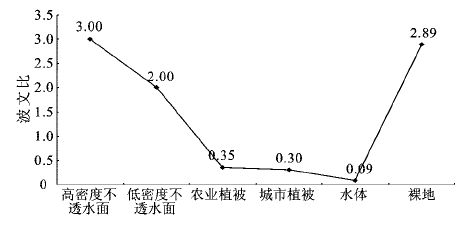
地表净辐射值(图3a)处550~650 W/m2区间,农业植被净辐射均值为622 W/m2,与同期中国科学院栾城农业生态系统试验站实测值(619.1 W/m2)接近。感热通量在75~400 W/m2之间,分别在130和275 W/m2处出现峰值,对应农业植被和不透水面。潜热通量分布于80~140和350~430 W/m2,对应不透水面,农业植被。储热通量的峰值对应于农业植被、城市植被、水体、裸地、低密度不透水面、高密度不透水面。城市中心区人为热最高(图3e),高密度不透水面人为热均值41.3 W/m2。波文比是感热与潜热之比,是评估热环境的重要指标。结合图3f和图1,水体和部分农业植被波文比最小(<0.3),城市植被和部分农业植被在0.3~0.7之间;不透水面和裸地平均波文比大于1.3,最大值在高密度不透水面(>3.0)。对照图3b和3c,不透水面感热通量明显高于潜热通量,城市植被、水体则相反。图4统计了不同下垫面波文比平均值,高、低密度不透水面分别为3.0、2.0,农业植被、城市植被、水体的波文比分别为0.35、0.30、0.09。
图3 地表能量平衡方程各分量和波文比空间分布
Fig.3 Components and Bowen ration spatial distributions of surface energy balance
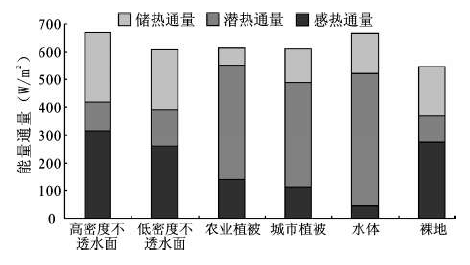
用单位面积能量堆积图(图5)表示下垫面地表热通量的分配差异,高、低密度不透水面和裸地分配近似,农业植被、城市植被及水体相似。高密度不透水面单位面积感热通量值最高314.1 W/m2,水体单位面积潜热通量最高479.0 W/m2。模拟结果和Christen[18]的结果近似。高、低密度不透水面感热和储热占净辐射比例高,感热分别占49.9%、42.9%,储热分别占40.0%和35.0%。裸地的感热交换是能量主要转换形式。农业植被、城市植被的净辐射分别有66.1%,61.2%转换为潜热;水体的潜热通量占净辐射的65.9%。
为明确不同下垫面面积比例与感热的关系,将数据聚合为1 km×1 km网格,提取不透水面、城市植被和水体面积百分比与感热/净辐射进行定量分析。
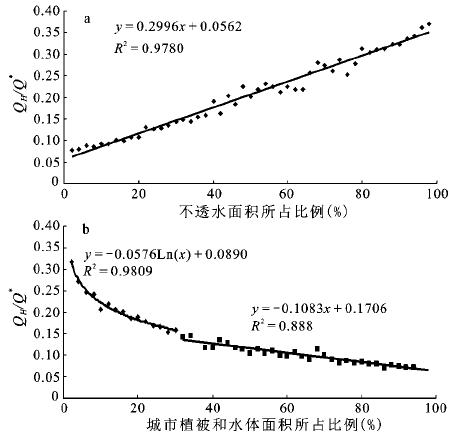
感热/净辐射与不透水面面积百分比呈显著正相关 (图6a),不透水面面积增加1%,QH/Q*增加0.3%;而城市植被和水体总面积增加,QH/Q*降低但非线性。图6b显示,当城市植被和水体面积比低于30%时,感热/净辐射与面积比例呈显著负相关,随着城市植被水体面积比例减少而迅速增加,大于30%后随城市植被水体增加而缓慢降低。
图6 QH/Q*比例与不透水面及城市植被和水体面积百分比的关系
Fig.6 Relationship between percentage of impervious surface area, urban vegetation, water and QH/Q*
城市热岛效应主要由地表覆被性质的改变导致地表能量平衡结构发生变化引起,不透水面的扩大和密集,是导致热岛效应的重要原因之一。研究区城市植被和水体较少,但能降低感热,因此增加城市植被、水体面积比例,可缓解城市热岛效应。城市居民区多分布在1 km×1 km内,探讨该尺度下植被和水体对缓解居民区热环境的贡献作用具有实际意义。研究中发现在1 km尺度内,植被和水体面积比例小于30%时,感热占净辐射比例随城市植被、水体面积减小而迅速增大,建议在城市规划中植被水体面积不小于30%,可最有效地减缓城市热岛效应。本研究对改善城市热环境具有理论指导意义。但由于分类精度的影响,模拟结果仍存在一定误差,需在以后研究中进一步提高。
The authors have declared that no competing interests exist.
| [1] |
城市热岛研究进展 [J]. |
| [2] |
热红外遥感图像中云覆盖像元地表温度估算初论 [J]. |
| [3] |
和谷地形下兰州市城市热岛效应的时空延边研究 [J].
|
| [4] |
旧城改造与城市热岛效应关系的遥感研究:福州市苍霞片区为例 [J].
|
| [5] |
Relationship of land surface and air temperatures and its implications for quantifying urban heat island indicators [J]. |
| [6] |
Remotely sensing the cooling effects of city scale efforts to reduce urban heat island [J]. |
| [7] |
苏州下垫面格局演变及其局地热环境效应 [J]. |
| [8] |
Evaluating urbanization and its impacts on local hydrological environment change in Shijiazhuang,China,using remote sensing [J]. |
| [9] |
基于遥感影像的于田绿洲空间热环境分布特征 [J]. |
| [10] |
Estimation of storage heat flux in an urban area using ASTER data [J]. |
| [11] |
Evaluating urban expansion and land use change in Shijiazhuang,China,by using remote sensing and GIS [J]. |
| [12] |
基于环境减灾卫星CCD数据与决策树技术的植被分类研究 [J]. |
| [13] |
Modification of normalized difference water index (NDWI) to enhance open water features in remotely sensed imagery [J]. |
| [14] |
Narrowband to broadband conversions of land surface albedo I Algorithms [J]. |
| [15] |
The effect of urban leaf area on summertime urban surface kinetic temperatures: a Tree Haute case study [J]. |
| [16] |
Remote Sensing and Image Interpretation [M]. |
| [17] |
The urban energy balance [J]. |
| [18] |
Energy and radiation balance of a central European city [J]. |
| [19] |
Numerical solution of a complete surface energy balance model for simulation of heat fluxes and surface temperature under bare soil environment [J]. |
| [20] |
Modeling surface sensible heat flux using surface radiative temperatures in asimple urban area [J]. |
| [21] |
Analysis of urban heat-island effect using ASTER and ETM+ Data:Separation of anthropogenic heat discharge and natural heat radiation from sensible heat flux [J]. |
| [22] |
A remote sensing surface energy balance algorithm for land (SEBAL). L. Formulation [J]. |

/
| 〈 |
|
〉 |