李永化 , 范强
, 范强
LI Yong-hua, FAN Qiang
中图分类号: X171.1
文献标识码: A
文章编号: 1000-0690(2015)11-1452-08
通讯作者:
收稿日期: 2014-10-21
修回日期: 2015-03-10
网络出版日期: 2015-11-20
版权声明: 2015 《地理科学》编辑部 本文是开放获取期刊文献,在以下情况下可以自由使用:学术研究、学术交流、科研教学等,但不允许用于商业目的.
基金资助:
作者简介:
作者简介:李永化(1960-),男,辽宁朝阳人,博士生导师,教授,主要研究领域为第四纪泥石流活动期与气候期的阶段性耦合、青藏高原东缘和邻区晚新生代泥石流活动规律及其成因、区域环境演变规律研究。E-mail:liyh5863@163.com
展开
摘要
依据辽宁省朝阳县生态环境特点,利用朝阳县2003、2006、2009、2012年4个年份的气候、降水量、遥感影像、土壤与数字高程模型(DEM)等基础数据,利用GIS结合SRP模型研究辽宁省朝阳县2003~2012年间的生态脆弱性。研究表明:① 2003、2006、2009年朝阳县的生态脆弱性呈逐年恶化趋势,2006、2009年微度脆弱的面积较2003、2006年分别有所减小,比率分别为15.99%,10.86%;2006、2009年轻度脆弱、中度脆弱、重度脆弱、极度脆弱的面积较2003、2006年均出现不同程度的增加,其中,生态脆弱性偏高的地方主要分布在工业发达、人口众多、地势较高的城乡住宅用地及农业区。到2012年朝阳县生态脆弱性开始有所好转。② 胜利乡是生态脆弱性最严重的地区,极度脆弱、重度脆弱、中度脆弱的面积分布中胜利乡均分布最多,比率分别为14.15%,10.26%,8.84%,七道岭乡是生态脆弱性最弱的地区,微度脆弱比率为6.42%。
关键词:
Abstract
Based on the characteristics of ecological environment in Chaoyang county of Liaoning Province, this essay studies the ecological vulnerability within Chaoyang county in 2003, 2006 , 2009 and 2012 by utilizing SRP (Sensitivity-Recovery-Pressure) model with meteorological data such as rainfall, RS data and soil data, DEM(Digital Elevation model) data and so on to determine ecological pressure factor including the pressure of Population activity and economic activity, ecological sensitivity factor including the earth surface factor, meteorological factor and soil factor, ecological stability factor including landscape structure, ecological function and ecological energy , based on GIS. The results are as follows: 1) The ecological vulnerability in Chaoyang county is in decline in 2003, 2006 and 2009, and reverses in 2012. Among these four years, the area where the ecology is lightly vulnerable in 2006 and 2009 is decreasing by 15.99% and 10.86% respectively, compared with that in 2003 and 2006, while the area where the ecology is lightly, moderately, heavily and extremely vulnerable in 2006 and 2009 is on the increase at various paces, compared with that in 2003 and 2006 respectively; 2) In all of these four years the area where the ecology is seriously vulnerable is mainly located in such region where the industry is developed and highly populated, and where the elevation is quite high; 3) Victory village is the most vulnerable region in ecology, where the extremely(14.15%), heavily(10.26%) and moderately(8.84%) vulnerable areas are located most, while Qidaoling village is the less vulnerable region, with 6.42% is slightly vulnerable.
Keywords:
20世纪初美国生态学家Clement提出了生态过渡带理论[1],此理论经过不断发展逐渐演变成生态脆弱性(Ecological Vulnerability)的研究[2]。生态脆弱性是衡量在自然因素和人文因素的驱使下,研究区原有的生态环境受到外界干扰所具有的敏感程度和恢复能力。近年来,随着科学技术的发展,人类对自然资源的需求与日俱增,生态环境的承载力逐渐变弱,生态环境的脆弱性日益增强[3] 。因此,对生态脆弱性的时空分异研究具有重大的现实意义。通过此项研究,可以完善环境评价理论,分析研究区在经济发展中出现的问题,如停留在原来的经济增长方式等;生态脆弱性的研究结果也可用于多个领域中,如生态恢复工程、环境规划、区域开发、合理调节经济结构等[4]。
国外早期对生态脆弱性的研究主要体现在生态学研究,从20世纪60年代起,分别经历了生物学计划、生物圈计划、地圈与生物圈计划等,21世纪以后,该项研究广泛应用到自然、社会系统。近年来,许多专家学者潜心研究脆弱生态环境的评价理论与方法应用,大量的研究结果显示,用于生态脆弱性评价的概念模型主要有基于SRP(Sensitivity-Recovery-Pressure)的评价模型方法[5]、基于自然成因指标-结果表现指标的方法[6]、影响因子-表现因子-胁迫因子方法等[7,8]。而研究者普遍认为SRP模型涵盖了生态脆弱性的构成要素,同时,随着评估方法的不断完善,该模型的应用也日趋广泛。本文以典型生态脆弱区辽宁省朝阳市朝阳县为研究区,选用评价生态脆弱性的代表模型“SRP”模型,并选取了代表上述三大目标层的14个变量,通过对该区域进行数据收集、实地考察、分析研究,综合遥感与地理信息系统技术构建合理完善的评价指标体系以及科学可靠的评价分析模型,对该区的生态环境进行客观评价分析,为区域的可持续发展提供价值参考[9]。
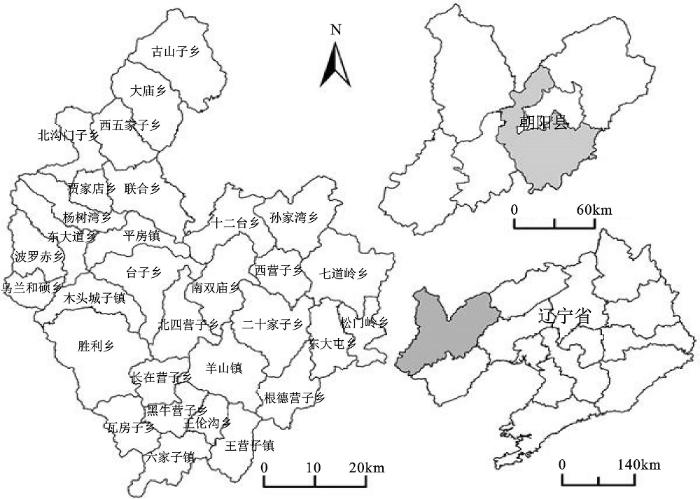
朝阳县地处辽宁省西部,位于118°50′18.96″~121°17′38.54″E,40°35′53.51″~42°23′21.22″N,东与锦州市接壤,西与建平县、喀左县为邻,南与葫芦岛市、建昌县毗连,北与北票市及内蒙古自治区敖汉旗为界(图1)。总面积约4 215.8 km2,总人口约65.4万人。地貌属于冀北辽西侵蚀低山丘陵地区,黄土土质疏松,易被流水侵蚀,地势由西北向东南倾斜,平原面积较小,丘陵分布广泛,且坡度较大,地表物质不稳定。地处中纬段,属于温带大陆性季风气候。区年均温8.5℃,年均降水量486 mm,降水多集中在夏季,且多暴雨,流水冲刷力强,朝阳县植被覆盖率低,涵养水源、保持水土能力差。由于复杂多样的地理环境,加上人类频繁的采矿伐薪、毁林开荒、过度樵采、无节制利用资源,水土流失加速,生态环境日益退化,该区情况不容乐观[10,11] 。朝阳县是重要的农业区,近年来县内经常遭受干旱、霜冻、病虫害、龙卷风、沙尘暴等自然灾害,土地沙漠化日趋恶劣,农作物常年受灾,严重的灾害使朝阳县生态环境、资源财产遭受重创,因此科学研究朝阳县生态脆弱性紧迫而重要。
辽宁省朝阳县是自然灾害多发区,通过统计年鉴和野外调查数据,选取多个研究区变量,通过这些变量的内在关系,准确选择数据来源,对研究区的生态脆弱性进行时空分异评价研究。生态脆弱性评价是一项综合性的评价,其评价模型的主要代表为SRP模型[12,13]。本文选取了14个变量作为评价指标[14,15],并根据人地耦合系统脆弱性概念框架赋予相应权重(具体赋值参照文献[12]中的各级指标权重值)。这些指标的数据来源见表1。
表1 数据来源与说明
Table 1 Date sources and description
| 分目标层 | 本层权重 | 准则层 | 本层权重 | 指标层 | 本层权重 | 数据名称 | 数据来源 |
|---|---|---|---|---|---|---|---|
| 压力度 | 0.313 1 | 人口活动压力 | 0.364 0 | 人口密度 | 1 | 朝阳县概况 | 朝阳县统计年鉴 |
| 经济活动压力 | 0.636 0 | GDP密度 | 1 | 朝阳县概况 | |||
| 敏感性 | 0.227 5 | 地形因子 | 0.200 0 | 高程 | 0.4000 | DEM数字高程数据: GDEM 30 m数据 | 中国科学院计算机网络信息中心 国际科学数据镜像网站 |
| 坡度 | 0.3000 | ||||||
| 坡向 | 0.3000 | ||||||
| 地表因子 | 0.200 0 | 植被覆盖度 | 1 | 遥感数据 | 中国科学院计算机网络信息中心 国际科学数据镜像网站 | ||
| 气象因子 | 0.100 0 | 年均降水量 | 0.3333 | 气象数据 | 中国气象科学数据共享服务网 | ||
| 年均气温 | 0.3333 | ||||||
| 年均相对湿度 | 0.3333 | ||||||
| 土壤因子 | 0.500 0 | 土壤侵蚀强度 | 1 | 由RUSLE模型计算转化而来 | |||
| 恢复力 | 0.4594 | 景观结构 | 0.333 3 | 景观多样性指数 | 1 | 由遥感影像数据、土地利用数据相互解译,与行政区划数据叠加并经模型计算转化而来 | |
| 功能 | 0.333 3 | 土壤有机质 | 0.5000 | ||||
| 单位面积水资源量 | 0.5000 | ||||||
| 活力 | 0.333 3 | 生物丰度 | 1 | ||||
1) SRP模型。SRP模型是一项专门用于评价某一特定地区的生态脆弱性的综合性评价[16]。在某个特定区域及时段内,系统内部具有不稳定的框架结构,对于外界干扰会表现出敏感性,同时会因缺乏应对能力而往不利于自身发展的方向演变,从而呈现出恢复力。SRP模型包含了生态脆弱性的构成指标,该模型的基本运行方法为:选取与生态脆弱性密切相关的指标,并通过设置每个不同指标的权重值以及指数,并对所有的权重值和指数相乘的结果进行累加,最终求出生态脆弱性的指数。SRP模型已在一些地区生态脆弱性的评价得以广泛应用,并取得一定的成效[17]。
生态脆弱性评价的基本计算公式如下:
式中,EEVI为生态脆弱性指数;Fi为第i个研究指标指数;Wi为第i个研究指标的对应权重值(1≤i≤n)。
2) 要素计算。包括以下几方面:
(1) 生态压力度要素:生态压力度因子包括人口活动压力和经济活动压力。随着社会科技的发展,人类对自身生产生活的要求越来越高,对生态环境的改造也越来越多,因此不可避免的给生态环境造成一定程度的破坏。
(2) 生态敏感性要素:地形因子包含高程、坡度和坡向,这3个指标只需选用研究区的DEM数据,通过ArcGIS提供的空间分析拓展模块提取即可[18]。
其中,地表因子包含植被覆盖度,以4个不同年份的归一化植被指数(NDVI)求平均计算得到。公式如下:
式中,f为1 a平均植被覆盖度;NNDVI为1 a平均归一化植被指数;NNDVImin、NNDVImax分别为1 a的NDVI最大值和最小值。
以4个不同年份的气象因子数据作为基础数据,使用反距离加权法进行插值,求解出每1 a中3个指标在朝阳县的空间分布。其中土壤因子主要以土壤侵蚀强度来衡量。土壤侵蚀强度的计算选用修正后的通用土壤流失方程(RUSLE)模型。表达式为:
式中,其中R为降雨侵蚀力因子,K为土壤可蚀因子,LS为坡度坡长因子,C为植被覆盖度因子,P为水土保持措施因子。具体表述如下:
本文采用降雨量计算降雨侵蚀力因子R:
式中,降雨侵蚀力R(Rainfall Erosivity)是一项评价降雨引起土壤侵蚀潜在能力的一种指标,pi为月降雨量(mm);P为年降雨量(mm)。R因子的栅格图的计算方法是:计算所有测站的R值,并利用上述的计算结果采用反距离加权法。
土壤可蚀性因子(K因子)是地表径流或土壤对雨滴击溅等侵蚀介质剥蚀和搬运作用的敏感程度[19],是土壤抵抗侵蚀能力的综合体现。其计算模型如下:
式中,SSAN为砂粒含量(%);SSIL为粉砂含量(%);CCLA为粘粒含量(%);C为有机碳含量(%);SSN=1-SSAN/100。由于1∶100万土壤数据含有土壤类型、土壤各物质的含量等各种属性,所以计算K因子采用上述土壤数据。
坡度坡长因子(LS因子)反映地表状态对土壤侵蚀的敏感程度,其计算模型如下:
式中,LS为坡度坡长因子;λ为坡长;γ为坡度;m为随坡度变化的量。当γ≥2.86°时,m为0.5;1.72°≤γ<2.86°时,m为0.4;0.57°≤γ<1.72°时,m为0.3;γ<0.57°时,m为0.2。
C因子反映植被的覆盖程度对水土流失的抑制程度。本研究选用蔡森法等人[20]建立的相关公式计算C因子值。公式如下:
式中,c代表植被覆盖度。
水土保持措施因子(P)是采取专门措施后的土壤流失量与顺坡种植时的土壤流失量之比[21],取值范围在0~1之间。每一类土地的P因子值不尽相同,主要取决于该类土地所采取的水土保持措施的落实情况。不同土地类型与对应的P值如表2所示。
表2 土地类型与P值的关系表
Table 2 The relationship between land types and P values
| 土地利用类型 | 耕地 | 林地 | 草地 | 住宅用地 | 水域 | 内陆滩涂 | 工矿仓储用地 | 公路用地 |
|---|---|---|---|---|---|---|---|---|
| P | 0.5 | 1 | 1 | 0 | 0 | 1 | 1 | 0 |
(3) 生态稳定度要素。生态稳定度要素主要以结构、功能、活力、弹性4个方面来衡量。结构方面的指标层为景观多样性指数,功能方面的指标层为土壤有机质、单位面积水资源量,活力方面的指标层指数为生物丰度,弹性方面的指标层为植被覆盖度。
景观多样性指数用以反映景观类型的数目以及所占比例的变化,即景观的复杂程度。计算公式如下:
式中,n为景观类型数;Pi为i类景观所占的面积比。
土壤有机质可以保持土壤水分和营养,从而为植物的生长创造条件,所以土壤有机质是土壤的重要组成部分。结合已有相关资料,不同有机质含量的标准化分值为:有机质含量<0.6%,指数为10,0.6%~0.8%指数为8,0.8%~1%指数为6,1.0%~1.5%为指数4,>1.5%指数为2。生物丰度指数可间接地反映研究区域内生物种类的丰贫程度。计算公式如下:
生物丰度指数=(0.11×耕地面积+0.35×林地面积+0.21×草地面积+0.28×水域面积+0.04×建设用地+0.01×未利用地)/区域面积。
依据朝阳县生态环境特点,利用其基础数据选取14个变量并赋予相应权重,结合朝阳县4个不同时期的生态脆弱性评价结果,将生态脆弱程度分为以下5级:微度脆弱(2以下)、轻度脆弱(2~4)、中度脆弱(4~6)、重度脆弱(6~8)、极度脆弱(8~10)。将朝阳县4个不同时期的生态脆弱性评价结果进行分级,分级结果见朝阳县不同时期的生态脆弱性分级专题图(图2),以及4个不同时期各个脆弱程度的面积占总面积的百分比(表3)。
从研究结果看,朝阳县前3 a的生态脆弱性大体呈恶化趋势,直到2012年有所好转。其中2006、2009年微度脆弱的面积较2003、2006年分别有所减小,比率分别为15.99%,10.86%;2006、2009年轻度脆弱、中度脆弱、重度脆弱、极度脆弱的面积较2003、2006年均出现不同程度的增加,比率分别为20.16%,12.27%;24.33%,12.75%;28.19%,13.58%;56.33%,17.00%。2012年微度脆弱的面积较2009年有所增加,比率分为25.80%;2012年轻度脆弱、中度脆弱、重度脆弱、极度脆弱的面积较2009年均出现不同程度的减小,比率分别为10.22%,18.48%,26.26%,43.79%。
图2 朝阳县生态脆弱性分级
Fig.2 The ecological vulnerability classification of Chaoyang county
表3 朝阳县各个年份不同生态脆弱性指数占总面积的百分比(%)
Table 3 The ecological vulnerability classification percent of the area of each year of Chaoyang county
| 生态脆弱性程度 | 2003年 | 2006年 | 2009年 | 2012年 |
|---|---|---|---|---|
| 微度脆弱 | 67.74 | 56.91 | 50.73 | 63.82 |
| 轻度脆弱 | 11.46 | 13.77 | 15.46 | 13.88 |
| 中度脆弱 | 6.37 | 7.92 | 8.93 | 7.28 |
| 重度脆弱 | 4.08 | 5.23 | 5.94 | 4.38 |
| 极度脆弱 | 10.35 | 16.18 | 18.93 | 10.64 |
1) 从空间分布看,朝阳县生态脆弱性偏高的地方主要出现在研究区的北部、中部以及西南部等地区。这一带属于冀北辽西侵蚀低山丘陵区,地势较高,平均坡度20°以上,这里是城乡住宅用地及农业区,工业发达,人口多,成为人口与GDP最密集的地区。经济的发展往往伴随着对生态系统的不合理开发,这种现象会导致这些地区的生态脆弱性的进一步恶化。与此相反,生态脆弱性偏低的地区多为平原,地势较低,植被丰富,人口密度低,工业和农业经济不发达,人类活动不剧烈。
2) 将研究区的乡镇级行政区划矢量数据与2003、2006、2009、2012年平均生态脆弱性等级分布数据进行叠置分析,得到生态脆弱性等级在各乡镇的分布情况(表4)。由表4可知,生态脆弱性呈极度脆弱、重度脆弱、中度脆弱比重最大的地区主要分布在胜利乡,比率分别为14.15%,10.26%,8.84%。极度脆弱程度台子乡次之,重度脆弱、中度脆弱程度古山子乡次之,可见胜利乡、台子乡是生态脆弱性较严重的地区。生态脆弱性呈微度脆弱比重最大的地区主要分布在七道岭乡,比率为6.42%,联合乡次之;轻度脆弱主要分布在胜利乡,比率为7.06%,古山台子乡次之。由此可见七道岭乡、联合乡是生态脆弱性较弱的地区,但胜利乡、古山台子乡的生态脆弱性分布不均。
表4 朝阳县乡镇生态脆弱性等级表
Table 4 The ecological vulnerability grade of towns in Chaoyang county
| 乡镇名称 | 微度脆弱 | 轻度脆弱 | 中度脆弱 | 重度脆弱 | 极度脆弱 | |||||
|---|---|---|---|---|---|---|---|---|---|---|
| 面积(km2) | 百分比(%) | 面积(km2) | 百分比(%) | 面积(km2) | 百分比(%) | 面积(km2) | 百分比(%) | 面积(km2) | 百分比(%) | |
| 北沟门子乡 | 46.79 | 1.98 | 16.76 | 2.46 | 11.34 | 3.16 | 7.16 | 3.32 | 16.06 | 2.90 |
| 北四营子乡 | 63.47 | 2.69 | 21.40 | 3.13 | 12.87 | 3.59 | 8.64 | 4.00 | 31.76 | 5.74 |
| 波罗赤乡 | 75.37 | 3.19 | 14.01 | 2.05 | 5.92 | 1.65 | 3.30 | 1.53 | 7.49 | 1.35 |
| 大庙乡 | 95.99 | 4.07 | 34.46 | 5.05 | 16.53 | 4.60 | 8.63 | 4.00 | 14.08 | 2.54 |
| 东大道乡 | 70.47 | 2.99 | 19.60 | 2.87 | 9.85 | 2.74 | 6.12 | 2.83 | 17.65 | 3.19 |
| 东大屯乡 | 72.47 | 3.07 | 19.44 | 2.85 | 8.72 | 2.43 | 4.67 | 2.16 | 6.89 | 1.25 |
| 二十家子乡 | 127.03 | 5.38 | 35.73 | 5.23 | 17.59 | 4.90 | 10.21 | 4.73 | 18.85 | 3.41 |
| 根德营子乡 | 55.50 | 2.35 | 27.36 | 4.01 | 15.96 | 4.44 | 9.67 | 4.48 | 18.83 | 3.40 |
| 古山子乡 | 105.03 | 4.45 | 40.31 | 5.90 | 23.46 | 6.53 | 14.84 | 6.87 | 36.41 | 6.58 |
| 黑牛营子乡 | 50.27 | 2.13 | 14.08 | 2.06 | 6.54 | 1.82 | 3.44 | 1.59 | 6.98 | 1.26 |
| 贾家店乡 | 38.71 | 1.64 | 6.30 | 0.92 | 3.63 | 1.01 | 2.55 | 1.18 | 9.10 | 1.64 |
| 联合乡 | 128.96 | 5.46 | 23.62 | 3.46 | 8.66 | 2.41 | 4.50 | 2.08 | 7.01 | 1.27 |
| 六家子镇 | 65.55 | 2.78 | 18.34 | 2.69 | 8.91 | 2.48 | 5.11 | 2.37 | 11.55 | 2.09 |
| 木头城子镇 | 83.33 | 3.53 | 15.82 | 2.32 | 8.13 | 2.27 | 4.93 | 2.28 | 16.96 | 3.06 |
| 南双庙乡 | 97.69 | 4.14 | 31.18 | 4.57 | 15.43 | 4.30 | 8.53 | 3.95 | 18.76 | 3.39 |
| 平房镇 | 99.57 | 4.22 | 8.67 | 1.27 | 1.94 | 0.54 | 0.59 | 0.27 | 0.56 | 0.10 |
| 七道岭乡 | 151.60 | 6.42 | 30.89 | 4.52 | 12.60 | 3.51 | 6.15 | 2.85 | 8.27 | 1.50 |
| 胜利乡 | 113.80 | 4.82 | 48.19 | 7.06 | 31.75 | 8.84 | 22.17 | 10.26 | 78.30 | 14.15 |
| 十二台乡 | 99.43 | 4.21 | 19.15 | 2.81 | 8.33 | 2.32 | 4.89 | 2.26 | 15.47 | 2.80 |
| 松岭门乡 | 51.54 | 2.18 | 12.72 | 1.86 | 5.91 | 1.65 | 3.10 | 1.44 | 4.74 | 0.86 |
| 孙家湾乡 | 98.06 | 4.15 | 35.58 | 5.21 | 16.74 | 4.66 | 8.43 | 3.90 | 10.65 | 1.92 |
| 台子乡 | 86.23 | 3.65 | 26.31 | 3.85 | 18.29 | 5.09 | 12.83 | 5.94 | 53.12 | 9.60 |
| 瓦房子乡 | 37.29 | 1.58 | 17.95 | 2.63 | 11.70 | 3.26 | 8.05 | 3.73 | 29.46 | 5.32 |
| 王伦沟乡 | 28.15 | 1.19 | 11.11 | 1.63 | 6.32 | 1.76 | 3.79 | 1.76 | 8.62 | 1.56 |
| 王营子镇 | 43.29 | 1.83 | 23.83 | 3.49 | 13.53 | 3.77 | 8.09 | 3.75 | 16.96 | 3.06 |
| 乌兰和硕乡 | 56.54 | 2.40 | 6.07 | 0.89 | 1.36 | 0.38 | 0.48 | 0.22 | 0.31 | 0.06 |
| 西五家子乡 | 51.97 | 2.20 | 20.94 | 3.07 | 13.58 | 3.78 | 9.25 | 4.28 | 23.56 | 4.26 |
| 西营子乡 | 61.10 | 2.59 | 18.93 | 2.77 | 8.13 | 2.26 | 3.90 | 1.80 | 4.64 | 0.84 |
| 羊山镇 | 108.69 | 4.61 | 33.43 | 4.90 | 17.65 | 4.92 | 10.15 | 4.70 | 21.79 | 3.94 |
| 杨树湾乡 | 60.05 | 2.54 | 15.67 | 2.30 | 9.18 | 2.56 | 6.06 | 2.81 | 15.40 | 2.78 |
| 长在营子乡 | 36.33 | 1.54 | 14.81 | 2.17 | 8.48 | 2.36 | 5.75 | 2.66 | 23.24 | 4.20 |
本文利用RS和GIS技术,以朝阳县作为研究区,结合SRP模型分析了2003、2006、2009、2012年生态脆弱性的时空变化特征,并得出以下结论:
1) 从4个不同年份5个生态脆弱性等级的面积变化来看,朝阳县2003、2006、2009年的生态脆弱性呈逐年恶化趋势,但2012年朝阳县的生态脆弱性有所好转。此外,从空间分布来看,4个不同年份中朝阳县的生态脆弱性偏高的地方主要分布在研究区的北部和中南部。复杂的生态环境以及密集的人口和工业分布,加之对生态系统的不合理开发更加速了生态脆弱性的恶化趋势。尽管如此,朝阳县开始颁布了一系列有关治理当地生态环境的法律法规,使生态脆弱性的恶化趋势进一步得到有效缓解,甚至出现了好转的迹象。
2) 从生态脆弱性在朝阳县各个乡镇的面积分布的比较来看,生态脆弱性呈微度脆弱主要分布在七道岭乡,比率为6.42%;极度脆弱、重度脆弱、中度脆弱主要分布在胜利乡,比率分别为14.15%,10.26%,8.84%。表明胜利乡是整个研究区中生态脆弱性最严重的地区,七道岭乡是生态脆弱性最弱的地区。
以上研究结果表明,辽宁省朝阳县生态脆弱性很差。作为自然灾害多发区,该区域内部框架结构不稳定,地形复杂,经济发展缓慢,在其发展的过程中,不可避免的会受到许多外界干扰(如当地居民为了生活、生产需要索取生态资源的行为),而这种干扰带来的压力会使系统催化产生敏感性和脆弱性。其中维持生态平衡的“阀值”尤为重要,当压力小于生态“阀值”时,系统会正常运转;当压力大于生态“阀值”时,系统会而往不利于自身发展和人类开发利用的方向演变,从而对外呈现出恢复力,该区域系统具有典型的“S-R-P”内在关联性。虽然朝阳县采取了一系列措施防止生态脆弱性进一步恶化,但仍有一些地区停留在落后的生产方式,对群众的环境保护教育没有得到充分重视。这是日益恶化的生态脆弱性始终没有得到好转的主要原因。通过缓解生态脆弱性的恶化趋势,改善研究区的生态环境依然任重而道远。由于研究区的气象站点偏少,土壤数据比例尺偏小等一些原因,研究结果的精度会受到一定的影响。
The authors have declared that no competing interests exist.
| [1] |
Crimp S et al.The vulnearability of Australian rural communities to climate variability and change :Part II—Integrating impacts with adaptive capacity [J]. |
| [2] |
Using science to assess environmental vulnerabilities [J].https://doi.org/10.1023/B:EMAS.0000016875.89092.e7 URL PMID: 15141442 Magsci [本文引用: 1] 摘要
4. Assessing and Responding to Environmental Vulnerability
|
| [3] |
Rounsevell M D A,Acosta—Michilik L et al.The vulnerability of ecosystem services to land use change [J].https://doi.org/10.1016/j.agee.2005.11.025 URL [本文引用: 1] 摘要
Terrestrial ecosystems provide a number of vital services for people and society, such as biodiversity, food, fibre, water resources, carbon sequestration, and recreation. The future capability of ecosystems to provide these services is determined by changes in socio-economic characteristics, land use, biodiversity, atmospheric composition and climate. Most published impact assessments do not address the vulnerability of the human-environment system under such environmental change. They cannot answer important multidisciplinary policy relevant questions such as: which are the main regions or sectors that are vulnerable to global change? How do the vulnerabilities of two regions compare? Which scenario is the least, or most, harmful for a given region or sector? The ATEAM project (Advanced Terrestrial Ecosystem Analysis and Modelling) uses a new approach to ecosystem assessment by integrating the potential impacts in a vulnerability assessment, which can help answer multidisciplinary questions, such as those listed above. This paper presents the vulnerability assessment of the ATEAM land use scenarios. The 14 land use types, discussed in detail by Rounsevell et al. (this volume), can be related to a range of ecosystem services. For instance, forest area is associated with wood production and designated land with outdoor recreation. Directly applying the vulnerability methodology to the land use change scenarios helps in understanding land use change impacts across the European environment. Scatter plots summarising impacts per principal European Environmental Zone (EnZ) help in interpreting how the impacts of the scenarios differ between ecosystem services and the European environments. While there is considerable heterogeneity in both the potential impacts of global changes, and the adaptive capacity to cope with these impacts, this assessment shows that southern Europe in particular will be vulnerable to land use change. Projected economic growth increases adaptive capacity, but is also associated with the most negative potential impacts. The potential impacts of more environmentally oriented developments are smaller, indicating an important role for both policy and society in determining eventual residual impacts
|
| [4] |
江西省生态脆弱性现状GIS 模型评价 [J].
生态环境脆弱性评价研究,对生态环境建设与保护具有重大意义。本研究以江西省为例,依据生态脆弱性的内涵与成因,针对江西区域生态环境特征,构建了江西省生态脆弱性综合评价指标体系,采用空间主成分分析法,确定各指标的权重。在GIS支持下,采用综合指数评价法计算生态脆弱度综合指数。研究结果表明,2005年,该省生态环境以中度脆弱为主,占全省总面积的85.36%,低度脆弱面积占14.64%,整体上属中度脆弱区;脆弱度空间分异特征明显:五河上游山区大多属于强中度或中中度脆弱区,五河中下游丘陵地区大多属于弱中度脆弱区;而低度脆弱区主要分布在鄱阳湖平原区和吉泰盆地。研究结果揭示了江西的自然环境条件是导致生态脆弱性的基础,而人类不合理的活动加剧了其脆弱性。
|
| [5] |
生态脆弱性综合评价方法与应用 [J].
探讨了生态脆弱性评价的理论与方法,提出将生态脆弱度指数、生态弹性度指数和生态压力度指数作为生态脆弱性评价的基本判定指标,构建了"敏感-弹性-压力"的评价模型,其评价体系包括总目标层、分目标层、准则层和指标层4个层次,形成了综合指数方法、层次分析法和RS/GIS相结合的生态脆弱性评价方法.在方法研究的基础上,以川西滇北农林牧交错带为例,根据区域特征选取17个评价指标进行案例研究,定量评价了该区域生态环境的脆弱程度,分析了生态脆弱度的空间差异和不同区域生态脆弱性的主导成因.评价结果较为客观地反映了该区域生态环境状况,对于生态脆弱区的生态保护、资源利用和可持续发展具有指导意义.
|
| [6] |
基于GIS 的淮河流域桐柏-大别山区生态脆弱性评价 [J].
生态环境受多种因素的影响和制 约。本文针对淮河流域桐柏-大别山区的自然条件和人为干扰状况构建该区域的生态脆弱性评价指标体系,利用地理信息系统软件ARCINFO的空间主成分分析 功能,进行定性与定量相结合的研究,对淮河流域桐柏-大别山区的生态脆弱性进行综合评价。并运用ARCINFO的空间分析功能,得到不同生态脆弱性的面积 与空间分布规律,为制定相应的治理与生态恢复对策提供科学依据。
|
| [7] |
博斯腾湖湿地生态脆弱性评价研究 [J].https://doi.org/10.3321/j.issn:1000-6060.2006.02.014 URL [本文引用: 1] 摘要
通过对博斯腾湖流域的水资源及其湿地现状分析,采取了定性与定量相结合的方法,对博斯腾湖湿地进行了评价.评价中依据湿地生态特性及演化规律建立评价指标 体系,利用层次分析法(AHP)确定指标权重,利用综合指数法计算出湿地的脆弱度.结果显示博斯腾湖湿地生态系统为中度脆弱,在此基础上探讨了博斯腾湖湿 地生态脆弱性的成因.指出人类活动通过叠加在自然变化背景上的影响程度日趋增强成为该区湿地生态环境的主导性脆弱因子.
|
| [8] |
闽江河口湿地生态脆弱性评价 [J].https://doi.org/10.3969/j.issn.1673-7105.2008.03.005 URL [本文引用: 1] 摘要
依据闽江河口湿地生态特性及演化规律,从影响因素、表现因素、胁迫因素方面选择了14个评价指标,对闽江河口典型洲滩湿地脆弱度进行评价。采用层次分析法(AHP)确定权重和专家学者的指标评分,利用综合指数法评价各典型湿地的脆弱度等级,并进行原因分析。结果表明,鳝鱼滩和浦下洲湿地生态脆弱性等级为轻度,蝙蝠洲、道庆洲、芦岐洲和长岸洲湿地生态脆弱度等级为中度。闽江河口湿地具有原生脆弱性,人类活动的强胁迫作用又使其产生了次生脆弱性,人类活动的干扰作用已经逐渐成为脆弱生态环境的主要驱动因素。
|
| [9] |
An empirical approach to estimate soil erosion risk in Spain [J].https://doi.org/10.1016/j.scitotenv.2011.05.010 URL PMID: 21621247 [本文引用: 1] 摘要
Soil is one of the most important factors in land and influences desertification worldwide. In 2001, the Spanish Ministry of the Environment launched the 'National Inventory of Soil (INES) 2002-2012' to study the process of soil in Spain. The aim of the current article is to assess the usefulness of this National Inventory as an instrument of control, measurement and monitoring of soil in Spain. The methodology and main features of this National Inventory are described in detail. The results achieved as of the end of May 2010 are presented, together with an explanation of the utility of the Inventory as a tool for planning forest hydrologic restoration, soil protection, control, and protection against desertification. Finally, the authors make a comparative analysis of similar initiatives for assessing soil in other countries at the national and European levels.
|
| [10] |
Guoping S et al.Quantiative determination of red-soil erosion by an Eu tracer method [J]. |
| [11] |
Assessing soil erosion in a terraced paddy field using experimental measurements and universal soil loss equation [J].https://doi.org/10.1016/j.catena.2012.02.013 URL [本文引用: 1] 摘要
The study assesses the effects of event rainfall on the soil erosion in terraced paddy fields under rice cropping, fallow, and green manure planting. A 0.75-ha terraced rice field was used to investigate the soil erosion under the regular cultivation of rice in 2005, fallow in 2006, and planting with green manure in 2007. The results show that infiltration rates significantly increase when a terraced paddy field is under fallow or is planted with green manure; the paddy is more vulnerable to embankment collapse and increased the rates of soil erosion. In an experimental field, suspended solid in run-off samples reached the maximal concentrations of 1700mg/l for fallow in 2006, and 3400mg/l for manure planted field in 2007, during heavy rainfall events. These values were significantly greater than the erosion rate of 500mg/l recorded for rice cropped field during 2005. The estimated annual erosion rate was 4.15tonha 611 yr 611 for green manure planted field, which was significantly higher than that of the rice-planted terraced paddy (0.77tonha 611 yr 611 ). Moreover, terraced paddy runoff significantly increased when planted with green manure. Soil erosion rates calculated by the Universal Soil Loss Equation (USLE) from the optimal available data were considerably higher than the field-measured values. The comparison revealed that soil conservation using rice-planted terraced paddy was more effective than that resulting from other uses. The government should formulate effective measures and maintain sustainable rice planting in the terraced paddies.
|
| [12] |
干旱区绿洲生态脆弱性评价方法及应用研究——以吐鲁番绿洲为例 [J].
依据干旱区绿洲生态环境特点,建立了完整的生态脆弱性评价指标体系。结合GIS和遥感技术,分别从生态压力、生态敏感度和生态稳定度3方面对研究区生态脆弱性进行分析,并运用综合指数法、层次分析法得出综合评价结果。结果表明,研究区80%以上的区域已达到中度脆弱级别,近1/6的区域为重度脆弱区,在分布上呈现从东向西明显增加的特点。生态脆弱性表现出了显著的土地利用效应,随着脆弱度等级的增加,荒漠化面积所占比例大幅度提高。进行荒漠化治理、保证生态用水是吐鲁番绿洲生态建设的关键。
|
| [13] |
环渤海地区生态脆弱性评价及其空间自相关分析 [J].
基于生态敏感性-生态恢复力-生态压力度概念框架,建立了环渤海地区五省市生态脆弱性评价的指标体系。考虑到指标体系中各评价因子之间可能存在相关性,所以首先在ArcGIS9.2平台上,用主成分分析方法剔除各因子的相关性,并对该区的生态脆弱性进行了评价,然后对脆弱性进行了空间自相关分析。结果表明:生态环境好的、相对不脆弱区主要分布在低山、丘陵等植被状况好、人类活动少的地区;重脆弱区主要分布在农牧交错带、海陆过渡带和城市周围等生态系统不稳定、人类活动剧烈的地区;脆弱区的空间聚集程度呈现出较高的正相关;不同地区之间脆弱性高相关区域主要分布在南部的低脆弱地区,脆弱性低相关区域主要分布在西北部的重脆弱区。
|
| [14] |
青藏高原高寒区生态脆弱性评价 [J].https://doi.org/10.11821/yj2011120016 URL Magsci [本文引用: 1] 摘要
在分析青藏高原高寒生态系统形成机制的基础上,构筑了3个层次、 10个指标的脆弱性评价指标体系,系统评估了青藏高原生态脆弱性及其区域差异。研究结果表明:青藏高原中、重度以上脆弱区的面积较大,占区域总面积的 74.79%。微度、轻度脆弱区主要分布在雅鲁藏布江大拐弯处、藏东南海拔3000m以下的山地、祁连山南坡的西北段和昆仑山北坡、塔里木盆地南缘地带。 重度和极度脆弱区集中分布的趋势明显,占全区面积的49.46%,主要分布在黄河源区、柴达木盆地和阿里高原往东32。N附近的带状区域(78。 E~92。E)。研究结果有助于全面掌握青藏高原生态系统的脆弱程度及其空间分异特征,对识别高寒区关键脆弱环境因子、提高生态环境治理的针对性有重要意 义。
|
| [15] |
南方丘陵区的生态脆弱度评估——以衡阳盆地为例 [J].https://doi.org/10.11821/yj2005060003 URL Magsci [本文引用: 1] 摘要
本文将生态脆弱性分为潜在脆弱 性与现实脆弱性。根据南方丘陵易侵蚀退化脆弱区的脆弱因子分析,选择高度、坡度、土壤可蚀性K值、降雨量、暴雨量、多雨期降雨比重和少雨期干旱指数为潜在 生态脆弱度指标;选取森林覆盖率和坡耕地指数作为现实脆弱度评估的人为修正指标,计算现实生态脆弱度。计算结果显示,衡阳盆地大部分的潜在生态脆弱性为轻 度脆弱,其中盆地中部的衡南县脆弱度最大,衡阳县次之;无论1984年还是2000年的现实生态脆弱度,均以衡南县最大,祁东县次之;各县2000年的现 实脆弱度均比1984年有所下降,其中下降幅度最大的是衡阳县,下降幅度最小的是衡南县。
|
| [16] |
Assessment of soil erosion sensitivity and analysis of factors in the Tongbai-Dabie mountainous area of China [J].https://doi.org/10.1016/j.catena.2012.10.008 URL [本文引用: 1] 摘要
Soil erosion reduces crop productivity and creates negative impacts on water quality. Soil erosion by water has become a problem worldwide and as concerns about the environment continue to grow, soil erosion remains a very active area of scientific research. In this study, based on advanced remote sensing and Geographic Information Systems (GIS) technologies, the influences of precipitation, soil, topography and vegetation on soil erosion sensitivity are evaluated. An index system and the classification standard for soil erosion sensitivity assessment in the Tongbai鈥揇abie Mountainous area are established with soil erosion sensitivity being evaluated and analyzed in order to provide a scientific basis for controlling soil erosion and for making sound ecological engineering decisions. According to the regional conditions, sensitivity is classified into five levels: insensitive, mild, moderate, high and extreme. The distribution of erosion sensitivity for the region is analyzed and the various impacts are discussed. The results show that the sensitivity of the Tongbai鈥揇abie Mountainous area to soil erosion is relatively high, with 46.34% of the total area above the moderate level, and 44.30% and 9.36% rated at the mild and insensitive levels, respectively. In regards to the spatial distribution, the sensitivity levels decrease from south to north, with highly sensitive areas found mainly in the south in the areas of Jinzhai, Huoshan, Shangcheng, Yuexi, and Shucheng. The distribution of soil erosion sensitivity levels was very consistent with the intensity of soil erosion. Areas of high sensitivity are found to have severe areas of soil erosion, indicating that regional soil erosion is highly influenced by natural factors, although in some areas it is evident that the impact of human activities has played a significant role in exacerbating the problem. The results of this investigation serve to advance efforts to reduce the impacts soil erosion in the region and prevent further erosion in areas having high erosion sensitivities.
|
| [17] |
Assessment of soil erosion vulnerability in western Europe and potential impact on crop productivity due to loss of soil depth using the ImpelERO model [J].https://doi.org/10.1016/S0167-8809(00)00161-4 URL [本文引用: 1] 摘要
Soil erosion continues to be a major concern for the development of sustainable agricultural management systems. Sustainability modelling analysis for soil erosion must include not only vulnerability prediction but also address impact and response assessment, in an integrated way. This paper focuses on the impact of soil erosion on crop productivity and the accommodation of agricultural use and management practices to soil protection. From the Andalucia region in Spain, soil/slope, climate and crop/management information was used to further develop an expert-system/neural-network soil erosion predicting model (named ImpelERO). Based on soil tolerance to water erosion, three regression equations were formulated to examine the effects of soil depth loss on crop productivity reduction. Also, a computerised procedure was developed to find a combination of management practices which would minimise soil loss in each field-unit. The overall approach of ImpelERO was applied in 20 selected benchmark sites from western Europe to quantify the soil erosion vulnerability with several crops, the impact of soil erosion on crop production, and the optimum management strategies. In the Mediterranean sites, soil losses reach an average of almost 50聽Mg聽haper year, the potential impact of soil erosion on the crop productivity was very important (up to 48% reduction in the 2050 time horizon), and the farming practices can be widely modified to protect environmental qualities. The results of this benchmark site analysis of soil erosion, however, must not be extrapolated to large geographical areas without additional spatialisation studies.
|
| [18] |
Noemí L R et al.Erosion in Mediterranean landscapes:Changes and future challenges [J].https://doi.org/10.1016/j.geomorph.2013.05.023 URL Magsci [本文引用: 1] 摘要
Intense erosion processes are widespread in the Mediterranean region, and include sheet wash erosion, rifling, gullying, shallow landsliding, and the development of large and active badlands in both subhumid and semi-arid areas. This review analyses the main environmental and human features related to soil erosion processes, and the main factors that explain the extreme variability of factors influencing soil erosion, particularly recent land use changes. The importance of erosion in the Mediterranean is related to the long history of human activity in a region characterized by low levels of annual precipitation, the occurrence of intense rainstorms and long-lasting droughts, high evapotranspiration, the presence of steep slopes and the occurrence of recent tectonic activity, together with the recurrent use of fire, overgrazing and farming. These factors have resulted in a complex landscape in which intensification and abandonment, wealth and poverty can co-exist. The changing conditions of national and international markets and the evolution of population pressure are now the main drivers explaining land use changes, including farmland abandonment in mountain areas, the expansion of some subsidized crops to marginal lands, and the development of new terraces affected by landslides and intense soil erosion during extreme rainstorm events. The occurrence of human-related forest fires affecting thousands of hectares each year is a significant problem in both the northern and southern areas of the Mediterranean basin. Here, we highlight the rise of new scientific challenges in controlling the negative consequences of soil erosion in the Mediterranean region: 1) to reduce the effects and extent of forest fires, and restructure the spatial organization of abandoned landscapes; 2) to provide guidance for making the EU agricultural policy more adapted to the complexity and fragility of Mediterranean environments; 3) to develop field methods and models to improve the identification of runoff and sediment contributing areas; 4) to contribute to the conservation of landscapes (i.e. bench-terraced fields) having high cultural and productivity values; 5) to improve knowledge of the hydrological and geomorphological functioning of badlands, with the aim of reducing sediment yield and accessibility; 6) to better understand the effect of climate change on soil erosion in the Mediterranean region; and 7) to improve quantitative information on long-term soil erosion. (C) 2013 Elsevier B.V. All rights reserved.
|
| [19] |
基于GIS 与RUSLE 的武陵山区小流域土壤侵蚀评价研究 [J].
<p>以长江中下游武陵山区女儿寨小流域为研究区,基于数据观测积累及实地调查采样等方法,计算了研究区降雨侵蚀力、土壤可蚀性等因子,运用GIS与RUSLE评价了流域土壤侵蚀强度并分析了其与土地利用方式、海拔高度的关系。结果表明,流域平均土壤侵蚀强度为78844 t/(km2·a),属微度侵蚀,流域面积9518%的范围发生轻度以下的侵蚀,强烈以上侵蚀仅占1.19%。从土地利用类型来看,耕地、果园侵蚀强度较大,均达到中度侵蚀,有林地除竹林地为轻度侵蚀外均属微度侵蚀,耕地、果园、竹林地是今后水土流失防治的主要地类。不同海拔高度中,低海拔(200~400 m)区域侵蚀量占到流域侵蚀总量的6442%,是水土流失防治的重点地带。研究为应用修正通用土壤流失方程在武陵山区进行土壤侵蚀评价提供范例,为研究区防治土壤侵蚀和流域管理规划决策提供相应参考</p>
|
| [20] |
应用USLE 模型与地理信息系统IDRISI 预测小流域土壤侵蚀量的研究 [J].https://doi.org/10.3321/j.issn:1009-2242.2000.02.005 URL [本文引用: 1] 摘要
依据实地调查资料,建立了典型小流域地理数据库,应用径流小区观测结果,确定了定量计算通用土壤流失方程因子指标方法,在地理信息系统IDRISI支持下,根据USLE土壤侵蚀预测模型对数据库实施运算操作,预测了小流域土壤侵蚀量。结果表明,占流域面积67%的区域土壤侵蚀微弱或轻度,这一区域对流域土壤侵蚀量的贡献率仅为3%,而流域80%的泥沙来自于占流域面积仅20%的极强度和剧烈侵蚀区域。
|
| [21] |
Xiang wei et al. assessment of soil erosion in different rainfall scenarios by RUSLE model coupled with Information Diffusion Model: A case study of Bohai Rim, China [J]. |

/
| 〈 |
|
〉 |
