徐新良 , 赵美燕
, 赵美燕
XU Xin-liang, ZHAO Mei-yan
中图分类号: P467
文献标识码: A
文章编号: 1000-0690(2015)11-1468-07
收稿日期: 2014-10-23
修回日期: 2014-12-20
网络出版日期: 2015-11-20
版权声明: 2015 《地理科学》编辑部 本文是开放获取期刊文献,在以下情况下可以自由使用:学术研究、学术交流、科研教学等,但不允许用于商业目的.
基金资助:
作者简介:
作者简介:徐新良(1972-),男,山东青岛人,博士,副研究员,硕士生导师,主要从事土地利用/土地覆被变化与陆地生态系统综合监测与评估研究。E-mail:xuxl@lreis.ac.cn
展开
摘要
以东北亚南北样带为研究区,基于NCDC气象数据,采用统计分析、线性趋势分析和累积距平分析法,对近30 a来东北亚地区的气候变化进行了系统研究。结果显示:1980~2010年,样带温度变化整体以升温态势为主,1996年后进入偏暖阶段,显著升温区年升温速率在0.05℃/a以上。降水变化整体表现为南减北增的空间分异格局,南部在1999年后进入偏少阶段,北部在2004年后进入偏多阶段,降水显著减少区,年降水量减少速率在5 mm/a以上;降水显著增加区,年降水量增加速率在5 mm/a以上。
关键词:
Abstract
Northeast Asia is an area with relatively concentrated resources, complex ecological environment pattern, diverse climate condition, significant relationship between people and land resources. The climate change in North Asia not only directly affects the local ecosystem succession, resource exploitation and economic development, but also plays an extremely important role on global climate change and the ecological balance. In this research, we choose the North-south transect of Northeast Asia as the study area,and make systematic analysis of the spatio-temporal characteristics of climate changeduring the past 30 years by means of statistical analysis, linear trend analysis and accumulative anomaly curve method and used the temperature and precipitation daily observation data of NCDC meteorological stations. The main conclusions are as follows: 1) North-south gradient zonal differentiation of temperature and precipitation issignificant inthe North-south transect of Northeast Asia. From north to south, the temperature and precipitation gradually increased. 2) During 1980-2010, the periodic changes of temperature and precipitation are very obvious. Temperature overallentered the warm phase after 1996, and precipitation showed reduction in south and increase in north in the spatial differentiation pattern. 3) The temperature changes mainly showed warming trend. The significant warming zones with annual increase rate of more than 0.05℃/a, occurred in the following areas: the northwest and south of the subarctic coniferous forest zone, temperate desert zone, central area of temperate steppe zone, and west area of the temperate mixed forest zone. 4) The spatial differences of precipitation changes are significant. The areas with the annual precipitation reduction rate of more than 5 mm/a are in the following areas: temperate steppe zone, temperate desert zone and the southwest region of temperate mixed forest zone. And the area with the annual precipitation increase rate of more than 5 mm/a are in the following area: western area of arctic tundra zone, northwestern and southern area of subarctic coniferous forest zone and southeastern regions of temperate mixed forest zone. The analysis of spatial and temporal characteristics of climate changesin North-South Transect of Northeast Asianot only provides a scientific basis for the future climate change studies of the whole Northeast Asia, but also has important significance to guide the human society and economic activity to adapt to the impact of climate change.
Keywords:
20世纪是全球近千年来增暖最为明显的时期,近50 a来的变暖速度几乎是近100 a来的两倍[1]。全球气候变化是一个不可分割的整体,任何区域的气候状态都要受到大的气候背景的影响,东北亚地区也不例外。近50 a,东北亚地区气候变化明显,中国北方地区、蒙古国和俄罗斯西伯利亚和远东部分地区表现出不同的区域气候变化特征。中国北方地区增温趋势显著,20世纪80年代左右发生了一次气候变暖突变,90年代以后气温明显升高,但是不同区域、不同季节气候的变化特征并不完全相同,具有各自的特殊性[2~12]。蒙古国52 a来(1940~1991年)年、冬季、春季和秋季气温均呈上升趋势,其上升速率高于北半球平均水平,其中冬季上升速率最大[13]。在俄罗斯西伯利亚及远东地区,近几十年来观察到的气候变暖导致极端天气的频率和强度也不断增加[14~17]。自1907年以来,俄罗斯境内平均地表温度上升了1.3ºC,几乎是全球水平的2倍[18]。
东北亚地区的气候变化对全球气候变化及生态平衡起着极其重要的作用。因此,本研究选择东北亚南北样带,基于NCDC气象数据,对近30 a东北亚地区的气候变化时空特征进行系统研究,这将有利于认识东北亚的区域气候现状与区域差异以及近30 a的气候演变特征,从而为探索东北亚地区近30 a来的地理环境状况的变动原因、开展未来气候变化研究提供科学基础。
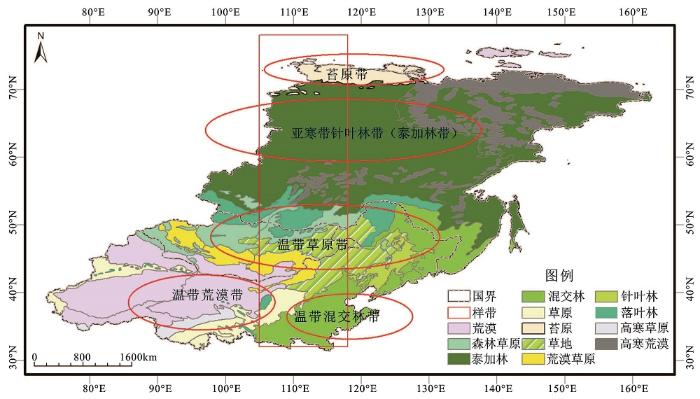
东北亚地区(本文指中国黄河以北的东北、华北和西北地区、蒙古全境、俄罗斯西伯利亚和远东部分地区)是一个资源相对集中、生态环境格局复杂、气候地带性多样、人地关系显著的区域[19]。该区域内的自然资源、生态环境与人类活动等具有典型的梯度变化特点。东北亚南北样带是在全球变化研究中沿热量梯度设立的一条典型样带,南北全长5 100 km,位于104°57′56″~117°57′36″E,31°52′46″~77°57′57″N之间。样带内气温与降水南北纬向梯度分异明显,自北向南气温逐步升高,降水量逐步增加。与此相对应的生态系统类型、植被覆盖亦呈明显条带状分布,由北向南依次可以划分为五大生态地理分区:寒带苔原带-亚寒带针叶林带(泰加林带)-温带草原带-温带荒漠带-温带混交林带(图1)。各区的典型特征如下:
1) 寒带苔原带也叫冻原,位于样带最北端,沿北冰洋沿岸分布,气候常年严寒,冬季漫长多暴风雪,夏季短促,长昼长夜,热量不足,年平均温度最低,最暖月的平均温度一般不超过10℃,最低温度可达-55℃,多年平均降水量最小,仅为41.75 mm,属于冷干气候;植物的生长季仅2~3个月,年降水量200~300 mm,主要集中在夏半年。
2) 亚寒带针叶林带(泰加林带)主要分布在寒带苔原带以南,温带草原带以北,为东北亚地区分布最为广泛的生态系统类型,呈宽阔的带状东西伸展,属于大陆性冷湿气候,冬季气候严寒,持续6~8个月,月平均气温在0℃以下,绝对最低气温可达-45~-50℃;夏季平均气温在10℃以上。
3) 温带草原带是森林到沙漠的过度地带,分布在西伯利亚泰加林以南,呈东西走向,宽度大,气候类型为温带大陆性半干旱气候(温带草原气候),气候大陆性强,冬季寒冷,1月平均气温多在-5~20℃之间,夏季较热,7月平均气温高于20℃。气温的年较差多在36~37℃。年降水量多在250~450 mm,主要集中在夏季,6~9月降水量占全年的70%~75%,且多为暴雨,降雨量变率较大。
4) 温带荒漠带属于温带大陆性干旱气候,气候十分干燥,降水稀少,年降水量一般在250 mm以下,气候干旱,气温变化极端,气温年较差和日较差都很大。
5) 温带混交林带又称夏绿阔叶林带,主要分布于温带草原带和温带荒漠带的东端,这里气候冬寒夏热,夏湿冬干,四季分明,年降水量达620~2 010 mm以上,且年降水量的60%~70%集中于夏季,雨热同季。
气象数据来源于美国国家气候资料中心NCDC(National Climatic Data Center)(http://www.ncdc.noaa.gov/cgi-bin/res40.pl?page=gsod.html)。东北亚南北样带涉及气象站点433个,其中中国北方地区气象站点221个、蒙古国气象站点36个、俄罗斯西伯利亚以及远东部分地区气象站点176个。各气象站点的主要气象要素指标包括平均气温、最高气温、最低气温、降水量、平均风速、最大风速等1980年以来的逐日观测数据。为了反映气象要素时空变化的空间格局,我们在考虑地形高程差异的基础上使用ANUSPLIN软件对各气象要素进行了空间插值,获得东北亚南北样带1 km×1 km的各气象要素空间格网数据[20~22]。
本研究通过对东北亚地区日气象数据的处理,生成了年(1~12月)、春季(3~5月)、夏季(6~8月)、秋季(9~11月)、冬季(12 月至次年2 月)气温、降水等气候要素时间序列数据,对其平均值、最大值、最小值等特征量进行统计分析,获取东北亚1980年以来的平均气候状况及其变化基本特征。气温、降水等气候要素时间序列数据分析还采用线性趋势法[23]和累积距平曲线法。此外,我们还采用常用的Mann-Kendall方法(简称M-K法),对年平均气温、降水量时间序列的长期变化趋势进行显著性检验,当检验值的绝对值大于1.96时,变化趋势可达到95%的信度,被认为存在显著的变化趋势,其中正值表示增大趋势,反之为减小趋势[24,25]。
图1 东北亚南北样带生态系统类型分布
Fig.1 The distribution of ecosystem type in North-south transect of Northeast Asia
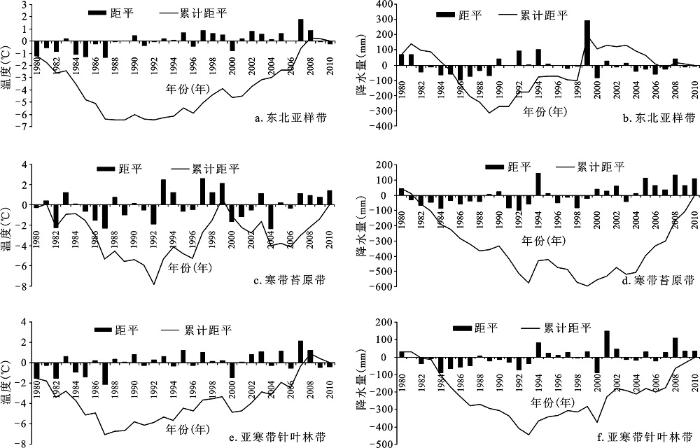
1980~2010年东北亚南北样带温度变化大体可以分为3个阶段(图2a):1980~1987年累积距平曲线呈明显下降趋势,年平均温度距平以负距平为主,为气温偏冷阶段,其中1987年温度达到最低,温度距平值为-1.34℃;1987~1996年累积距平曲线起伏较小,这一阶段年平均温度变化不大;1996年以后累计距平曲线持续上升,温度距平值基本为正,该时期为气温偏暖阶段,2007年温度达到最高,温度距平值为1.75℃。2007年的最高温度和1987年的最低温度相比,温度升高3.09℃。
从降水年际变化看(图2b),1981~1989年降水累计距平曲线呈显著下降趋势,年降水距平以负距平为主,该时期为降水偏少阶段,其中1986年降水量距平值达最小值-132.49 mm;1989~1999年累计距平曲线呈上升趋势,为降水偏多阶段,1999年达最大降水量,距平值292.05 mm;1999年以来年降水累计距平曲线再次呈下降趋势,年降水距平以负距平为主,该时期再次进入降水偏少阶段。
寒带苔原带温度变化分4个阶段(图2c):1980~1992年为气温偏冷阶段、1992~1999年为气温偏暖阶段、1999~2006年再次表现为气温偏冷阶段、2006~2010年气温再次呈偏暖阶段。近30 a寒带苔原带温度变化从1997年最高温度到2004年最低温度,温度降低了4.88℃。降水变化分3个阶段(图2d):1980~1993年降水为偏少阶段,1993~2004年降水呈波动变化阶段、2004~2010年的降水量偏多阶段。从1992年的最少降水量到2008年最多降水量,年降水量增加了233.26 mm。
亚寒带针叶林带温度变化可分为2个阶段(图2e):1980~1987年为气温偏冷阶段、1987~2010年为气温偏暖阶段。近30 a亚寒带针叶林带温度从1987年的最低温度到2007年的最高温度,温度升高了4.26℃。降水变化可分为2个阶段(图2f),1980~1993年的降水偏少阶段和1993~2010年的降水偏多阶段。从1984年的降水最小值到2001年的降水最大值,降水量增加了254.36 mm。
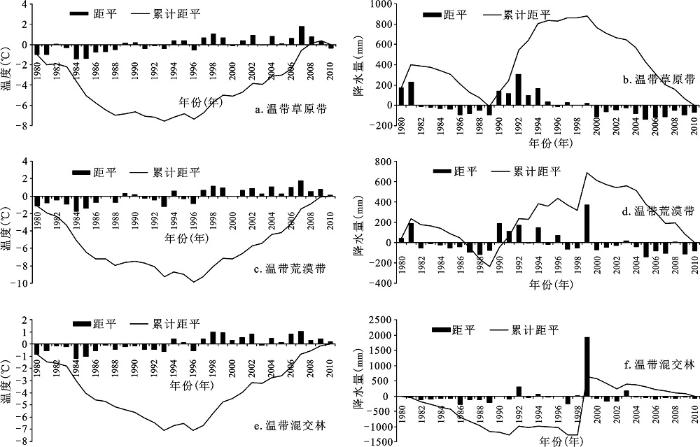
温带草原带温度变化可分为3个阶段(图3a):1980~1988年的气温偏冷阶段、1988~1996年的温度波动变化阶段以及1996~2010年气温偏暖阶段。从1984年的最低温到2007年的最高温,气温升高3.21℃。降水变化可分为3个阶段(图3b):1981~1989年的降水偏少阶段、1989~1999年的降水偏多阶段以及1999~2010年的降水偏少阶段。从1992年的最大降水量到2005年的最小降水量,年降水减少440.94 mm。
温带荒漠带温度变化可分为2个阶段(图3c):1980~1996年为气温偏冷阶段,1996~2010年,为气温偏暖阶段。从1984年的最低温到2007年的最高温,温度升高3.49℃。降水变化可分为3个阶段(图3d):1981~1989年的降水偏少阶段、1989~1999年的降水偏多阶段以及1999~2010年的降水偏少阶段。从1999年的降水量最大值到2005年的降水量最小值,年降水量减少了509.36 mm。
温带混交林带温度变化可分为3个阶段(图3e):1980~1993年的偏冷阶段、1993~1996年的气温波动阶段和1996~2010年的偏暖阶段。从1984年的最低温到2007年的最高温,温度升高了2.19℃。降水变化波动较大大体可划分为3个阶段(图3f):1980~1991年的降水偏少阶段、1991~1999年的降水波动阶段以及1999~2010年的降水偏少阶段。从1986年的最少降水到1999年的最大降水,降水量增加了2 189.62 mm。
综上所述,东北亚五大生态地理分区,近30 a温度和降水变化的阶段性比较明显(图4)。温度变化整体在1996年以后进入偏暖阶段,但寒带苔原带升温具有一定的滞后性,2006年后才进入偏暖阶段(图4a)。降水变化全区在1999年后进入偏少阶段,但北部的寒带苔原带和亚寒带针叶林带却分别在2004和1993年进入降水偏多阶段,表现出降水变化的南增北减的空间分异格局(图4b)。
图2 1980~2010年年平均温度、降水距平和累积距平年际变化(a、c、e平均温度; b、d、f降水)
Fig.2 The annual change of anomaly and accumulative anomaly of average temperature and precipitation during 1980-2010
图3 1980~2010年年平均温度、降水距平和累积距平年际变化(a、c、e平均温度; b、d、f降水)
Fig.3 The annual change of anomaly and accumulative anomaly of average temperature and precipitation during 1980-2010
图4 近30 a东北亚南北样带年平均气温(a)和年降水(b)变化阶段性特征
Fig.4 The periodic characteristics of annual temperature(a) and precipitation(b) change in North-south transect of Northeast Asia in last 30 years
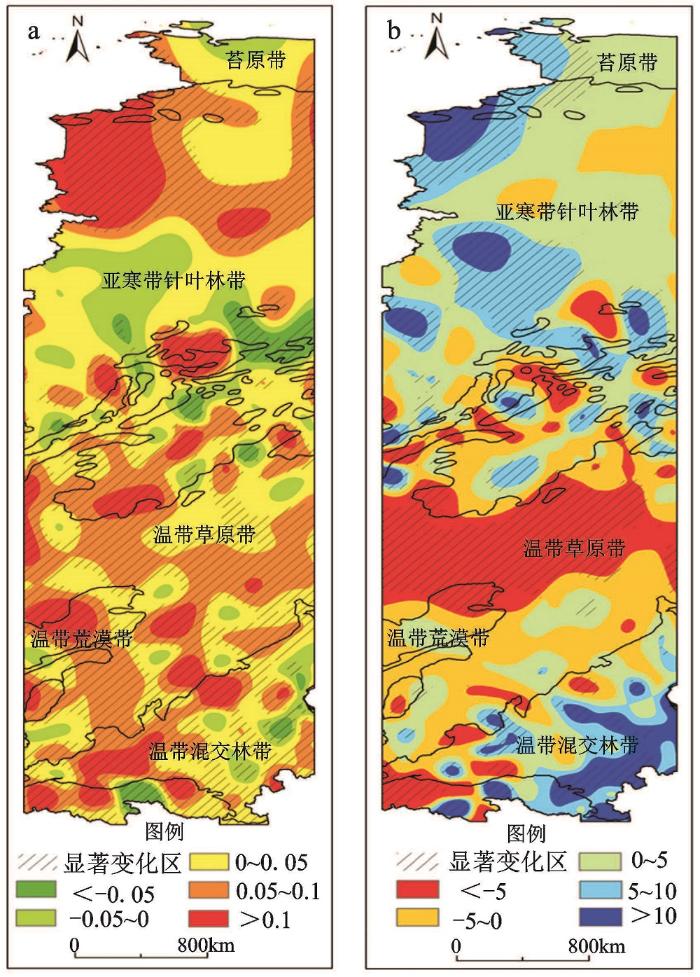
东北亚南北样带温度变化整体呈现升温态势,从年平均温度变化倾向率分级面积统计结果(表1),样带中89.62%的区域温度上升,其中年平均温度变化倾向率在0.05℃/a以上的区域面积占样带总面积的45.35%,年平均温度倾向率在0~0.05℃/a的地区面积占样带总面积的44.27%。年平均温度变化倾向率在0.05℃/a以上的区域均表现为显著升温区,主要集中在亚寒带针叶林带西北部和南部、温带荒漠带、温带草原带中部以及温带混交林西部(图5a)。其中亚寒带针叶林带南北两端、温带荒漠带地区以及温带草原带地区的升温最为明显集中,温度倾向率在0.1℃/a以上。
东北亚南北样带降水变化区域分异明显,年降水变化呈减少趋势(变化倾向率为负值)地区面积占整个样带总面积的43.57%(表1)。其中年降水量变化倾向率小于-5 mm/a的地区多表现为显著性减少,面积占样带总面积的18.70%,主要分布于中部地区温带草原带、温带荒漠地区及温带混交林带西南部地区(图5b)。此外,年降水变化呈减少趋势(变化倾向率为负值)的地区面积占样带总面积的56.43%,其中年降水量变化倾向率大于5 mm/a的地区多表现为显著增加区,占样带总面积的23.6%,主要分布于苔原带西部、亚寒带针叶林带西北部和南部以及温带混交林带东南部。
表1 1980~2010年东北亚南北样带气温、降水变化倾向率面积统计
Table 1 Area statistic of temperature and precipitation change tendency rate in North-south transect of Northeast Asia during 1980-2010
| 气温变化倾向率分级(℃) | 面积(104km2) | 百分比(%) | 降水变化分级(mm) | 面积(104km2) | 百分比(%) |
|---|---|---|---|---|---|
| < -0.05 | 8.37 | 2.26 | < -5 | 69.12 | 18.70 |
| -0.05~0 | 30.01 | 8.12 | -5~0 | 91.92 | 24.87 |
| 0~0.05 | 163.64 | 44.27 | 0~5 | 121.36 | 32.83 |
| 0.05~0.1 | 115.24 | 31.17 | 5~10 | 60.97 | 16.49 |
| > 0.1 | 52.41 | 14.18 | > 10 | 26.30 | 7.11 |
图5 1980~2010年东北亚南北样带年平均气温(a)、降水(b)变化倾斜率空间分布
Fig.5 The spatial distribution of temperature and precipitation change tendency rate in North-south transect of Northeast Asia during 1980-2010
在全球气候变暖的背景下,东北亚地区正经历着气温整体上升,降水变化区域分异的演变过程。本文得出的主要结论如下:
1) 东北亚南北样带气温与降水南北纬向梯度分异明显,自北向南气温逐步升高,降水量逐步增加。最北端的寒带苔原带年平均温度最低,多年平均降水量最小,属于冷干气候;最南端的温带混交林带年平均气温最高,年降水量也最大,属于暖湿气候。
2) 1980~2010年东北亚南北样带温度变化整体以升温态势为主,整体在1996年以后进入偏暖阶段,但寒带苔原带升温具有一定的滞后性,在2006年后才进入偏暖阶段。亚寒带针叶林带西北部和南部、温带荒漠带、温带草原带中部以及温带混交林带西部为显著升温区,年升温速率在0.05℃/a以上。
3) 近30 a东北亚南北样带降水变化整体表现为南减北增的空间分异格局,南部在1999年后进入偏少阶段,但北部却在2004年后进入降水偏多阶段。温带草原带、温带荒漠带以及温带混交林带西南部地区,降水以显著减少为主,年降水量减少速率在5 mm/a以上;寒带苔原带西部、亚寒带针叶林带西北部和南部以及温带混交林带东南部地区降水呈显著增加趋势,年降水量增加速率在5 mm/a以上。
东北亚地区空间范围广大,地形复杂,气候变化的局地性和空间分异较强。20世纪90年代以来东北亚南北样带的增温,尤其是高纬度地区的增温普遍比较明显(图4a)。冬季变暖夏季变凉不仅是中国、也是蒙古及北半球50 a来的气候变化特点之一。东北亚南北样带降水的变化整体表现为南减北增的空间分异格局,但这种格局在不同国家和地区表现并不相同。作为全球气候变化的窗口,东北亚南北样带近30 a的气候变化时空特征分析,尤其是气温和降水变化的阶段性以及空间分异特征不仅为研究分析该地区的生态环境演变提供了科学基础,而且为全球变化背景下,指导中国、蒙古和俄罗斯合理开展区域资源开发利用和经济活动适应气候变化的影响提供了有益的参考。
The authors have declared that no competing interests exist.
| [2] |
中国北方地区近50年来气温变化特征及其突变性 [J].https://doi.org/10.3321/j.issn:1000-6060.2005.02.008 URL [本文引用: 1] 摘要
从1951-2000年中国北方地区(包括东北、华北和西北)的 平均气温、日最高气温、日最低气温随时间的变化趋势特征来看.通过分析发现:在全球气候变暖的前景下,中国北方地区近50年来平均气温、日最高气温和日最 低气温的增温态势十分明显;东北地区的增温大于西北和华北地区;日最低气温的增温比平均气温和日最高气温更加显著;冬季增温比夏季显著.20世纪80年代 中后期平均气温、日最高气温、日最低气温大多发生了一次显著的变暖突变.90年代以来中国北方地区的气温明显偏高.但是不同季节、不同区域气温的多年变化 特征并不完全相同,具有各自的特殊性.
|
| [3] |
基于Hopfield神经网络的中国近40年气候要素时空变化分析 [J].URL 摘要
利用1961~2000年中国大部分省区(香港、澳门、台湾、海南地区数据暂缺)194个气象站点逐日降水量、气温和相对湿度数据,通过克里格插值、Hopfield神经网络聚类以及方差分析,对中国气候变化的时空特征进行分析。分析结果表明中国以增温为主导趋势,其次是多雨趋势;东部地区出现变干趋势,而西部地区在逐渐增湿;对3种要素进行聚类分析,并利用方差分析检验差异性是否显著,最后分析了聚类结果变化趋势,结果与插值分析一致,说明克里格插值结果的可信性。表明在全球增温的驱动下,中国气候变化格局处于调整状态,湿润地区干旱化,干旱地区变得湿润。
|
| [4] |
华北地区百年气候变化规律分析 [J].https://doi.org/10.3969/j.issn.1004-9398.2006.04.017 URL 摘要
通过对比研究华北地区的范围, 综合整理了相关华北地区的气温与降水变化规律,发现华北地区气温存在空间上由南向北降低,由沿海向内陆增高,再由内陆向山区降低;在时间上两个降温期两个 升温期,即1880~1919年为第一个降温期(Ⅰj);1920~1950年为第一个升温期(Ⅰs);1951~1970年为第二个降温期(Ⅱ j);1971年至今为第二个升温期(Ⅱs).并分析了气温地域性差异的主要原因是南北纬度的跨越、地形的非均一性和海陆位置的差异.而华北的夏季降水则 存在空间上南部(东南部)降水多,北部(西北部)降水少,山区降水普遍多于平原,燕山南麓、胶东丘陵的南部沿海和鲁中山地的东南部均因地处夏季风的迎风 坡,雨
|
| [5] |
Climate change in China from1880 to1998 and its impacts on the environmental condition [J].https://doi.org/10.1023/A:1010673212131 Magsci 摘要
<a name="Abs1"></a>The global mean surface air temperature (SAT) or the Northern Hemisphere mean SAT has increased since the late nineteenth century, but the mean precipitation around the world has not formed a definite tendency to increase. A lot of studies showed that different climate and environmental changes during the past 100 years over various regions in the world were experienced. The climate change in China over the past 100 years and its impact on China's environmental conditions needs to be investigated in more detail.Data sets of surface air temperature and atmospheric precipitation over China since 1880 up to the present are now available. In this paper, a drought index has been formulated corresponding to both the temperature and precipitation. Based on three series of temperature, precipitation, and drought index, interdecadal changes in all 7 regions of China and temperature differences among individual regions are analyzed. Some interesting facts are revealed using the wavelet transform method. In Northeast China, the aridification trend has become more serious since 1970s. Drought index in North China has also reached a high value during 1990s, which seems similar to that period 1920s–1940s. In NorthwestChina, the highest temperature appeared over the period 1930s–1940s. Along the Yangtze River valley in central eastern China and Southwest China, interdecadal high temperature occurred from 1920s to 1940s and in 1990s, but the drought climate mainly appeared from 1920s to early 1940s. In South China, temperature remained at a high value over the period 1910s–1940s,but the smaller-scale variation of drought index was remarkable from 1880 to 1998. Consequently, the quasi-20-year oscillation (smaller-scale variation) and the quasi-70-year oscillation (secular variation) obviously exist in temperature and precipitation series in different regions over China.Climate change and intensified human activity in China have induced certain environmental evolutions, such as the frequency change of dust-storm event in northern China, no-flow in the lower reaches of the Yellow River and the runoff variation in Northwest China. On the other hand, frequent floods along the Yangtze River and high frequency of drought disaster have resulted in tremendous economic losses in the last decade in China. The primary reason for these happenings may be attributed to the evolution of the monsoon system in East Asian.
|
| [6] |
中国近50年气温及降水的变化趋势分析 [J].Magsci 摘要
通过对我国385个站的观测资料序列进行分析研究,得到我国气候变化的一些特征。近25年全国平均温度有明显的上升趋势,只有极少数测站有明显的降温趋势,华北及东北的广大地区是增温最快、范围最大的地区。全国平均降水量没有明显的变化趋势。逐站分析降水量的年际变化后发现,我国降水量的变化存在着明显的区域特征,新疆地区是降水量增加最快的地区;华中-华北地区的降水则存在明显的减少趋势;这两个地区的平均降水量都与全球海表温度距平有很好的相关性。文中还利用同期大气再分析资料(NCEP/NCAR)尝试分析了气候变化与大气环流特征的关系。
|
| [7] |
近50年来中国气候变化特征的再分析 [J].https://doi.org/10.11676/qxxb2004.023 URL 摘要
利用国家气象中心最近整编的中国740个站逐日资料,通过对中国温度、降水、湿度、风速、气压这5个基本气象要素变化特征较为全面的分析,揭示了近50a来中国气候变化的一些新特征。得到的新结果有:(1)近50a来,全国平均气温在20世纪80年代以后上升更为明显;西南低温区在90年代以后温度也处于上升状态;夏季的长江中上游出现明显的降温趋势。(2)全国平均年总降水量波动略有减少,但90年代以后夏季降水增加明显,尤其是长江以南地区,而华北、东北地区降水显著减少,体现了夏季风的减弱。(3)全国平均相对湿度的变化和降水相似。(4)中国几乎全部地区的风速都在显著减小,冬、春季和西北西部最明显,该区90年代的年平均风速比50年代减少约29%。风速大幅减小主要是由于亚洲冬、夏季风的减弱。(5)全国平均的海平面气压在增高,尤其是北方的冬季,这和中国风速的大幅减小有关。
|
| [8] |
近半个世纪来中国西北地面气候变化基本特征 [J].https://doi.org/10.3321/j.issn:1001-8166.2007.06.013 URL 摘要
利用中国西北地区(新、青、甘、宁、陕及内蒙古西部地区)1960-2003年131个测站 年平均气温、年降水量、年蒸发量及年平均地面风速等资料,分析了近44年中国西北地区地面气候变化基本特征。研究表明:近半个世纪来中国西北地区基本都表 现为显著的增温趋势,增温速率普遍为0.2~0.9℃/10a,大部分地区高于0.22℃/10a的全国平均水平,与全球变暖的大背景相一致,并且在 1994年还发生了一次增温突变。西风带气候区年降水量表现为小幅增加趋势,而季风带气候区表现为小幅减少趋势。近44年来西北地区水面蒸发量表现为显著 的减少趋势,且在1976年左右发生了减少突变。整个西北地区平均地面风速减少、日照时数减少、平均日较差减少、相对湿度增加及平均低云量增加可能是水面 蒸发量减少的重要原因。
|
| [9] |
华北地区高温日数的气候特征及变化规律 [J].
基于1960~2009年华北 地区90个台站逐日最高气温数据,采用趋势分析等方法分析近50 a华北地区高温日数的时空变化特征。结果表明,近50 a华北地区高温日数以海拔高度800 m等值线为界呈现南多北少的分布特点,南部主要呈减少趋势,北部主要呈增加趋势。同时它显现出明显的"多-少-多"年代际变化特征,与1960年代相 比,2000年代高温日数在7月稍增加,5和8月有所减少。近50 a华北地区累计高温过程频次呈微弱的减少趋势,南北部高温过程集中的年代和月份也有所不同。
|
| [10] |
内蒙古近50年气候变化及未来10~20年趋势展望 [J].
利用1950~1999年内蒙古40个气象站的月平均气温、月降水量资料,对全区及十个区域近50年年、季气候变化,特别是近10年的气候变化做较全面的分析.并从历史气候序列入手对未来10~20年气候变化趋势进行预测.结果显示,近50年内蒙古气候明显变暖,表现为四季气温均在升高,并以冬季升温幅度最大.近40年全区大部地区降水量有增加趋势,且雨量较多的地区增幅也大.90年代全区夏季降水变幅较前30年增大,旱涝灾害增加.未来全区大部地区暖干气候背景将持续到2010年前后,而东北部地区未来10~20年将以暖湿气候为主.
|
| [11] |
青藏高原近40年来气候变化特征及湖泊环境响应 [J].
<p>以青藏高原52 个气象台站1971~2008 年的逐月气温、降水资料为基础, 采用因子分析、气候趋势分析、气候突变分析等方法, 对高原内部不同区域的气候变化特征进行研究, 并讨论了高原湖泊环境对气候变化的响应。结果表明, 近40 a 来, 青藏高原各区域年平均气温整体持续上升, 柴达木地区增温尤为显著, 年平均气温增长率达0.49℃/10a;1987 年和1998 年各区域气温普遍由低向高突变, 1998 年以来增温尤为显著。年可利用降水的变化特征存在区域差异, 柴达木地区、藏北南羌塘高原东部地区整体增湿。除藏东地区, 青藏高原其它地区气候条件于20 世纪末21 世纪初由暖干向暖湿转变, 受其影响, 以青海湖、鄂陵湖、冬给措纳、兹格塘错为代表的高原大型湖泊表现出水位上升、湖水离子浓度减小的特征, 反映了气候暖湿条件下湖泊水量的增加。</p>
|
| [12] |
近10年蒙古高原植被覆盖变化及其对气候的季节响应 [J].
利用2001~2010年间MODIS NDVI数据、同期气象数据和MODIS土地覆盖分类产品,探讨蒙古高原植被覆盖变化趋势及其对气温和降水量的季节响应特征。结果表明,10a来,蒙古高原植被覆盖度呈增加趋势和呈下降趋势的面积基本持平;春季和夏季植被覆盖度呈下降趋势,而秋季呈上升趋势,降水量是最主要的影响因子;在秋季5种植被类型均呈增加趋势,而在春季和夏季不同植被类型的增减趋势因植被类型而异。
|
| [13] |
50年来蒙古国与北半球的气温变化 [J].
利用蒙古25个台站52年月平均气温资料(1940-1991年)分析了蒙古的气温变化趋势,并与北半球进行了比较。结果表明,52年来蒙占年平均气温以0.0190℃/年的速率上升,冬、春季和秋季气温呈上升趋势,冬季上升速率最大,为0.0540℃/年;夏季气温以-0.0110℃/年的速率下降。50年代是蒙古相对较冷的时期。北半球自1940年以来年半均气温上升速率为0.0003℃/年,冬、春季升温,最大在冬季(0.0033℃/年);夏、秋季降温,最大在秋季(-0.0032℃/年),60年代和70年代为较冷时期,其余为温暖期。蒙古气温分布主要有3种类型:(1)全暖;(2)西暖东凉;(3)北暖南凉。最主要周期冬季为13.0年,夏季为2.4年。海拔高度对气温、方差及其线性趋势在某些月份和季节有显著影响。蒙古与北半球年平均气温相关系数为0.34,冬季为0.41,春季为0.38。气候变暖主要表现在冬季变暖。冬季变暖夏季变凉不仅是我国、也是蒙古及北半球50年来的气候特点之一。
|
| [14] |
The bases of data on hazardous hydrometeorological phenomena in Russia and results of statistical analysis [J].https://doi.org/10.3103/S1068373909110016 URL Magsci [本文引用: 1] 摘要
Main principles are considered of formation of special files on observed hazardous hydrometeorological phenomena (HHP) and adverse weather, along with experience of Roshydromet in standardization of registration and reports on their damaging effects. The first base is designed on the basis on hazardous phenomena registered by the hydrometeorological stations according to authorized criteria regardless the damaging effects on economy and population; these data are collected and stored in the State Data Foundation. These are special climatic data series on HHP from the stations; they are used in the studies of extreme and hazardous weather. The second base collects information on adverse and hazardous weather causing economic and social damage, irrespective of the HHP criteria reached or not. Distribution is presented of total case number of hazardous hydrometeorological phenomena causing social and economic damage during 1991鈥2008.
|
| [15] |
Ran'kova E Y.Climate oscillations and changes over Russia [J].https://doi.org/10.1007/s00484-002-0154-y URL 摘要
Refined definitions of a climate, climatic variables, climate variability, climate changes, and climate monitoring that are applicable to the analysis of climate variability from observations in the case of a changing climate are given. The main features of global warming, are described. New data are reported on the features of climate changes over Russia in the second half of the 20th century and on changes in climate anomaly and extremeness. Empirical estimates for the local sensitivity of air temperature to changes in the greenhouse gas concentration are discussed. The estimates can be used to assess the expected temperature changes in the comin- 20-25 years.
|
| [16] |
Kattsov V M et al.Global Climate Changes.The Role of Anthropogenic Impacts [J].
|
| [17] |
Komarov A I et al.Patterns of modern natural climatic changes in Siberia: observed changes of annual temperature and pressure [J]. |
| [18] |
Permafrost and changing climate:the Russian perspective [J].https://doi.org/10.1579/0044-7447(2006)35[169:PACCTR]2.0.CO;2 URL PMID: 16944641 [本文引用: 1] 摘要
Abstract The permafrost regions occupy about 25% of the Northern Hemisphere's terrestrial surface, and more than 60% of that of Russia. Warming, thawing, and degradation of permafrost have been observed in many locations in recent decades and are likely to accelerate in the future as a result of climatic change. Changes of permafrost have important implications for natural systems, humans, and the economy of the northern lands. Results from mathematical modeling indicate that by the mid-21st century, near-surface permafrost in the Northern Hemisphere may shrink by 15%-30%, leading to complete thawing of the frozen ground in the upper few meters, while elsewhere the depth of seasonal thawing may increase on average by 15%-25%, and by 50% or more in the northernmost locations. Such changes may shift the balance between the uptake and release of carbon in tundra and facilitate emission of greenhouse gases from the carbon-rich Arctic wetlands. Serious public concerns are associated with the effects that thawing permafrost may have on the infrastructure constructed on it. Climate-induced changes of permafrost properties are potentially detrimental to almost all structures in northern lands, and may render many of them unusable. Degradation of permafrost and ground settlement due to thermokarst may lead to dramatic distortions of terrain and to changes in hydrology and vegetation, and may lead ultimately to transformation of existing landforms. Recent studies indicate that nonclimatic factors, such as changes in vegetation and hydrology, may largely govern the response of permafrost to global warming. More studies are needed to better understand and quantify the effects of multiple factors in the changing northern environment.
|
| [19] |
东北亚自然资源状况及开发前景 [J].https://doi.org/10.3969/j.issn.1007-4937.2003.01.014 URL [本文引用: 1] 摘要
东北亚地区特别是蒙古和俄罗斯远东地区蕴藏着十分丰富的自然资源 ,对于本地区资源相对贫乏而经济发展对资源需要量日益增大的中国、日本、韩国来说具有极大的吸引力。从目前来看 ,与蒙古和俄罗斯搞好合作开发的前景是十分乐观的
|
| [20] |
Interpolating mean rainfall using thin plate smoothing splines [J].https://doi.org/10.1080/02693799508902045 URL [本文引用: 1] 摘要
Thin plate smoothing splines provide accurate, operationally straightforward and computationally efficient solutions to the problem of the spatial interpolation of annual mean rainfall for a standard period from point data which contains many short period rainfall means. The analyses depend on developing a statistical model of the spatial variation of the observed rainfall means, considered as noisy estimates of standard period means. The error structure of this model has two components which allow separately for strong spatially correlated departures of observed short term means from standard period means and for uncorrelated deficiencies in the representation of standard period mean rainfall by a smooth function of position and elevation. Thin plate splines, with the degree of smoothing determining by minimising generalised cross validation, can estimate this smooth function in two ways. First, the spatially correlated error structure of the data can be accommodated directly by estimating the corresponding non-diagonal error covariance matrix. Secondly, spatial correlation in the data error structure can be removed by standardising the observed short term means to standard period mean estimates using linear regression. When applied to data both methods give similar interpolation accuracy, and error estimates of the fitted surfaces are in good agreement with residuals from withheld data. Simplified versions of the data error model, which require only minimal summary data at each location, are also presented. The interpolation accuracy obtained with these models is only slightly inferior to that obtained with more complete statistical models. It is shown that the incorporation of a continuous, spatially varying, dependence on appropriately scaled elevation makes a dominant contribution to surface accuracy. Incorporating dependence on aspect, as determined from a digital elevation model, makes only a marginal further improvement.
|
| [21] |
Interpolation of rainfall data with thin plate smoothing splines.Part I:Two dimensional smoothing of data with short range correlation [J].
|
| [22] |
Interpolation of rainfall data with thin plate smoothing splines.PartII:Analysis of topographic dependence [J].
ABSTRACT Thin plate smoothing splines incorporating varying degrees of topographic dependence were used to interpolate 100 daily rainfall values, with the degree of data smoothing determined by minimizing the generalised cross validation. Analyses were performed on the square roots of the rainfall values. Model calibration was made difficult by short range correlation and the small size of the data set. Short range correlation was partially overcome by removing one point from each of the five closest pairs of data points. An additional five representative points were removed to make up a set of 10 withheld points to assess model error. Three dimensional spline functions of position and elevation, from digital elevation models of varying resolution, were used to assess the optimum scaling of elevation and an optimum DEM resolution of 10 km. A linear sub-model, depending on the two horizontal components of the unit normal to the scaled DEM, was used to form a five dimensional partial spline model which identified a south western aspect effect. This model also had slightly smaller estimated predictive error. The model was validated by reference to the prevailing upper atmosphere wind field and by comparing predictive accuracies on 367 withheld data points. Model selection was further validated by fitting the various spline models to the 367 data points and using the 100 data points to assess model error. This verified that there were small, but significant, elevation and topographic aspect effects in the data, when calculated from a 10 km resolution DEM, providing a physical explanation for the short range correlation identified by the two dimensional analysis in the companion paper. KEYWORDS : partial thin plate smoothing splines, digital elevation model, topographic dependence, generalized cross validation, data smoothing, short range correlation, rainfall data, square root transformation.
|
| [23] |
青海高原近44年来气候变化的事实及其特征 [J].
利用青海省26个代表站 1961-2004年逐月气温、降水量资料,给出了加权平均的气温、降水量标准序列,分析了青海近44年来气温、降水量变化特征。结果表明:青海气温变化 趋势与同期全国气温变化趋势基本一致,气候存在着变暖的总趋势,年平均增温率为0.36℃/10 a,气候明显变暖的地区主要在北部,气候变暖主要是夜间气温明显上升所致,变暖的季节主要是冬季,青海高原气温变化的位相超前于全国气温的变化;青海高原 降水量变化趋势的空间分布不一致,高原降水日数在减少,但降水强度在增大。
|
| [24] |
基于Sen+Mann-Kendall的北京植被变化趋势分析 [J].
基于1998年到2011年长时序SPOT VEGETATION归一化植被指数数据,采用一元线性回归斜率变化法和Sen+Mann-Kendall法对北京地区的植被变化趋势做了时空分析。实验结果表明:在1998年到2011年期间,北京市城区、延庆县、怀柔区和平谷区的植被变化趋势显著上升;而植被恶化区则集中在北京市城区北部、东部和南部,并以马蹄形包围北京市区。两种方法实验结果在植被上升(下降)区域具有一致性。同时,Sen+Mann-Kendall法以其良好的抗噪性和对数据分布无要求性可广泛应用到其他区域的植被变化趋势分析中。
|
| [25] |
近25年三北防护林工程区土地退化及驱动力分析 [J].https://doi.org/10.11821/xb201205002 URL Magsci [本文引用: 1] 摘要
以长时间序列的遥感数据NOAA/AVHRRNDVI为基础,利用Sen趋势度与Mann-Kendall分析法相结合的方式分析了三北防护林工程区1982年到2006年土地退化趋势,结合气候因子降雨,运用残差法模型评价了人类活动在工程区内土地退化中所起的作用。结果表明:区域内土地退化程度整体趋于减轻,即植被上升的区域大于下降的区域,13.00%的地区退化程度显著减轻,6.20%的地区退化程度显著加重。其中绝大多数省份的土地退化程度趋于减轻,尤以内蒙古、青海和新疆最为明显,只有甘肃省土地退化程度明显趋于加重。而人类活动对植被变化起显著正作用的占11.93%,显著负作用的为6.19%。这说明在干旱、半干旱区,由于降雨随时间的变化不显著,对植被变化的影响相对较为微弱,植被显著变化主要受人类活动的影响。
|
| [1] |
柴达木盆地气温降水的长序列变化及与水资源关系 [J].
根据柴达木盆地8个气象观测站点1960年-2009年共50年的逐月平均气温及降水量资料,综合运用线性趋势分析及Mann-Kendall趋势检验等气象统计分析方法对柴达木盆地气温及降水的变化趋势进行了分析。结果表明在过去的50年里,柴达木盆地经历了明显的升温过程,且增温幅度越来越大,特别是进入20世纪90年代,总的升温幅度在0.5℃/10a左右,远大于同期全球的升温幅度;柴达木盆地降水也略有上升,变化幅度6.2mm/10a左右。从空间分布上看,柴达木盆地气温增幅从东到西逐渐增高,而降水倾向率则逐渐减小。季节分布上,盆地内冬季的气温升温幅度最为明显,增温幅度达0.72℃/10a左右,降水倾向率则夏季最大,达3.4mm/10a。累积距平曲线及Mann-Kendall趋势突变检验综合分析表明,柴达木盆地气温在20世纪80年代有一个明显的增温过程,增温起点在1987年左右。气温、降水的变化也在一定程度上影响到水资源量的变化,相关分析表明,地表水资源量与降水呈显著相关关系,但与气温关系不明显。另外,上一年降水也对地表水资源量有一定的影响。
|

/
| 〈 |
|
〉 |
